Glen Avon, California (CA) income map, earnings map, and wages data
The median household income in Glen Avon, CA in 2022 was $60,372, which was 51.6% less than the median annual income of $91,551 across the entire state of California. Compared to the median income of $37,152 in 2000 this represents an increase of 38.5%. The per capita income in 2022 was $21,909, which means an increase of 31.8% compared to 2000 when it was $14,943.
Whole page based on the data from 2000 / 2022 when the population of Glen Avon, California was 14,853 / 24,032
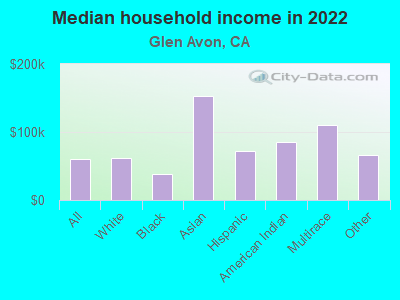
Income statistics for all residents
Median household income in Glen Avon, CA in 2022:| Glen Avon: | $60,373 |
| State: | $91,551 |
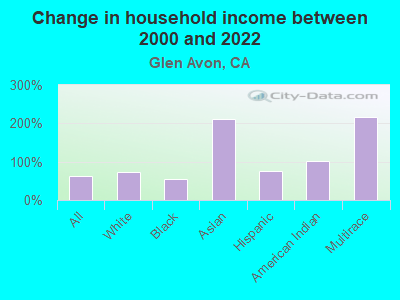
Change in median household income between 2000 and 2022:| Glen Avon, California: | +62.5% |
| State: | +92.8% |
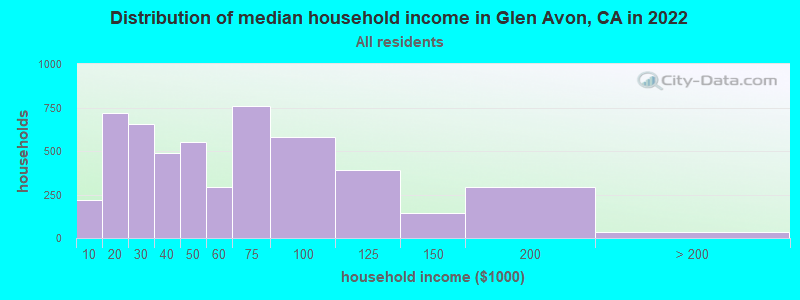
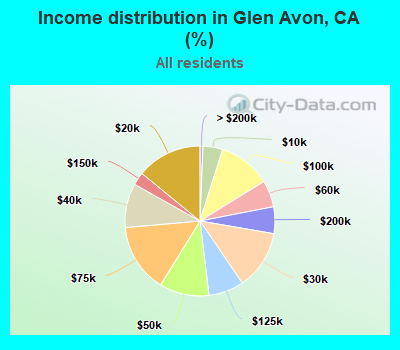
Number of households with income < $10k:| Glen Avon: | 4.3% (218) |
| State: | 4.8% (654,370) |
Number of households with income $10k - 20k:| Glen Avon: | 14.1% (721) |
| State: | 5.8% (789,493) |
Number of households with income $20k - 30k:| Glen Avon: | 12.8% (654) |
| California: | 5.7% (778,318) |
Number of households with income $30k - 40k:| Glen Avon: | 9.5% (488) |
| California: | 5.8% (783,170) |
Number of households with income $40k - 50k:| Glen Avon: | 10.7% (550) |
| California: | 5.8% (781,352) |
Number of households with income $50k - 60k:| Glen Avon: | 5.7% (294) |
| California: | 5.6% (760,175) |
Number of households with income $60k - 75k:| Glen Avon: | 14.8% (757) |
| State: | 8.2% (1,104,699) |
Number of households with income $75k - 100k:| Glen Avon: | 11.3% (579) |
| State: | 12.0% (1,627,633) |
Number of households with income $100k - 125k:| Glen Avon: | 7.6% (389) |
| State: | 10.0% (1,358,619) |
Number of households with income $125k - 150k:| Glen Avon: | 2.8% (142) |
| California: | 7.6% (1,027,455) |
Number of households with income $150k - 200k:| Glen Avon: | 5.8% (295) |
| California: | 10.6% (1,439,811) |
Number of households with income > $200k:| Glen Avon: | 0.6% (33) |
| California: | 18.0% (2,445,491) |
Aggregate household income in Glen Avon in 2022: $491,416,015
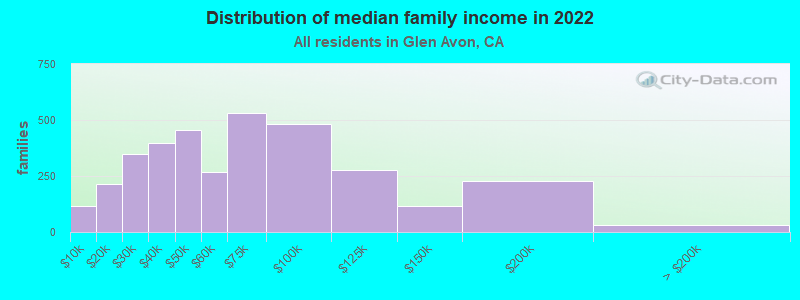
Median family income in Glen Avon in 2022:| Glen Avon: | $70,775 |
| State: | $104,823 |
Number of families with income < $10k:| Glen Avon: | 3.4% (116) |
| State: | 3.1% (280,184) |
Number of families with income $10k - 20k:| Glen Avon: | 6.2% (213) |
| California: | 3.5% (322,064) |
Number of families with income $20k - 30k:| Glen Avon: | 10.0% (348) |
| State: | 4.7% (433,722) |
Number of families with income $30k - 40k:| Glen Avon: | 11.4% (396) |
| California: | 5.2% (478,213) |
Number of families with income $40k - 50k:| Glen Avon: | 13.1% (454) |
| State: | 5.6% (511,647) |
Number of families with income $50k - 60k:| Glen Avon: | 7.8% (268) |
| California: | 5.5% (498,926) |
Number of families with income $60k - 75k:| Glen Avon: | 15.3% (530) |
| State: | 8.0% (731,094) |
Number of families with income $75k - 100k:| Glen Avon: | 13.9% (481) |
| State: | 12.2% (1,115,621) |
Number of families with income $100k - 125k:| Glen Avon: | 8.1% (279) |
| California: | 10.5% (959,600) |
Number of families with income $125k - 150k:| Glen Avon: | 3.3% (114) |
| State: | 8.4% (768,725) |
Number of families with income $150k - 200k:| Glen Avon: | 6.6% (227) |
| California: | 11.9% (1,087,239) |
Number of families with income > $200k:| Glen Avon: | 1.0% (33) |
| California: | 21.5% (1,963,769) |
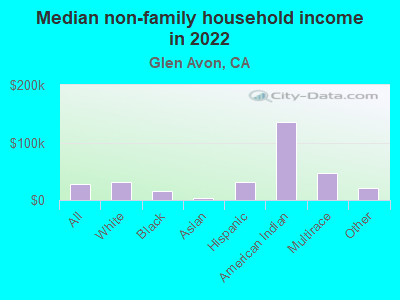
Median non-family income in Glen Avon in 2022:| Glen Avon: | $28,310 |
| State: | $59,348 |
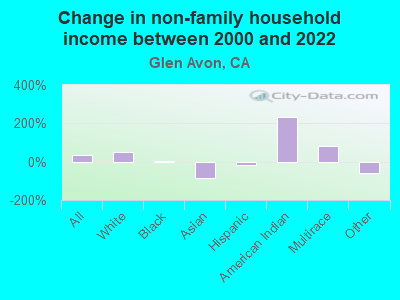
Change in median non-family income between 2000 and 2022:| Glen Avon, California: | +36.3% |
| State: | +85.3% |
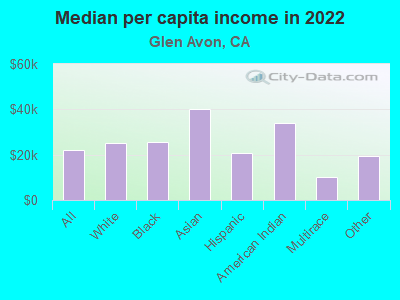
Median per capita income in Glen Avon in 2022:| Glen Avon: | $21,909 |
| State: | $46,661 |
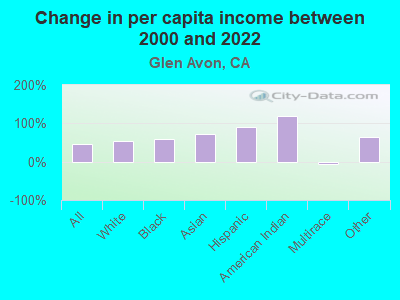
Change in median per capita income between 2000 and 2022:| Glen Avon, California: | +46.6% |
| State: | +105.5% |
Income statistics for White residents
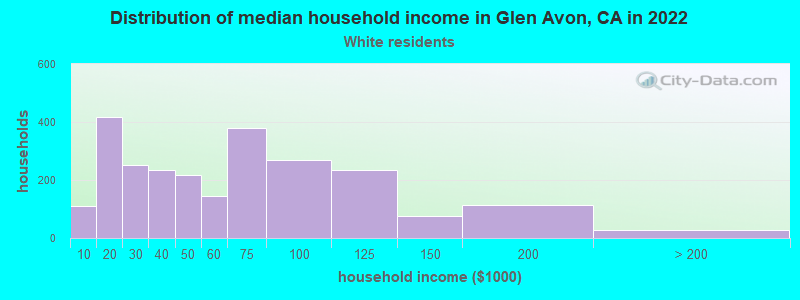
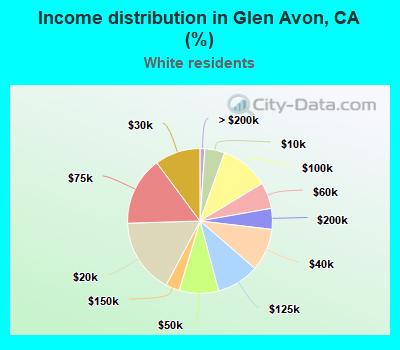
Median household income in Glen Avon, CA in 2022:| Glen Avon: | $61,248 |
| California: | $100,917 |
Change in median household income between 2000 and 2022:| Glen Avon, California: | +73.4% |
| State: | +96.8% |
Number of households with income < $10k:| Glen Avon: | 4.4% (110) |
| State: | 4.4% (284,109) |
Number of households with income $10k - 20k:| Glen Avon: | 16.8% (416) |
| California: | 5.3% (340,330) |
Number of households with income $20k - 30k:| Glen Avon: | 10.2% (252) |
| State: | 5.3% (343,145) |
Number of households with income $30k - 40k:| Glen Avon: | 9.5% (236) |
| State: | 5.1% (330,146) |
Number of households with income $40k - 50k:| Glen Avon: | 8.8% (218) |
| State: | 5.2% (335,310) |
Number of households with income $50k - 60k:| Glen Avon: | 5.8% (145) |
| California: | 5.1% (326,299) |
Number of households with income $60k - 75k:| Glen Avon: | 15.3% (380) |
| State: | 7.6% (487,640) |
Number of households with income $75k - 100k:| Glen Avon: | 10.8% (269) |
| State: | 11.5% (736,578) |
Number of households with income $100k - 125k:| Glen Avon: | 9.5% (235) |
| State: | 10.1% (648,782) |
Number of households with income $125k - 150k:| Glen Avon: | 3.1% (77) |
| California: | 7.8% (499,671) |
Number of households with income $150k - 200k:| Glen Avon: | 4.6% (115) |
| California: | 11.4% (729,603) |
Number of households with income > $200k:| Glen Avon: | 1.1% (27) |
| State: | 21.2% (1,364,246) |
Aggregate household income in Glen Avon in 2022: $248,552,468
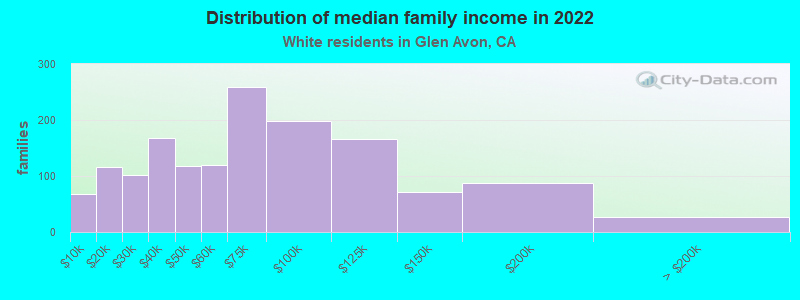
Median family income in Glen Avon in 2022:| Glen Avon: | $79,216 |
| California: | $125,379 |
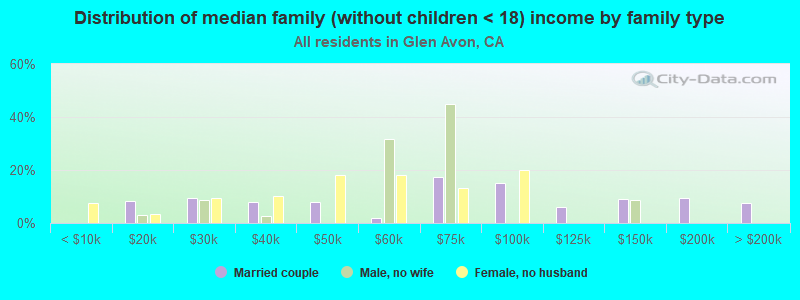
Number of families with income < $10k:| Glen Avon: | 4.5% (67) |
| State: | 2.2% (87,079) |
Number of families with income $10k - 20k:| Glen Avon: | 7.7% (116) |
| State: | 2.5% (97,716) |
Number of families with income $20k - 30k:| Glen Avon: | 6.7% (101) |
| California: | 3.5% (137,295) |
Number of families with income $30k - 40k:| Glen Avon: | 11.2% (168) |
| California: | 3.9% (152,947) |
Number of families with income $40k - 50k:| Glen Avon: | 7.9% (118) |
| California: | 4.3% (169,197) |
Number of families with income $50k - 60k:| Glen Avon: | 7.9% (119) |
| State: | 4.5% (176,192) |
Number of families with income $60k - 75k:| Glen Avon: | 17.3% (259) |
| State: | 7.0% (274,752) |
Number of families with income $75k - 100k:| Glen Avon: | 13.3% (199) |
| State: | 11.3% (445,632) |
Number of families with income $100k - 125k:| Glen Avon: | 11.1% (166) |
| State: | 10.7% (423,630) |
Number of families with income $125k - 150k:| Glen Avon: | 4.8% (71) |
| California: | 9.1% (357,408) |
Number of families with income $150k - 200k:| Glen Avon: | 5.9% (88) |
| State: | 13.5% (532,693) |
Number of families with income > $200k:| Glen Avon: | 1.8% (27) |
| State: | 27.6% (1,086,948) |
Median non-family income in Glen Avon in 2022:| Glen Avon: | $31,652 |
| California: | $62,819 |
Change in median non-family income between 2000 and 2022:| Glen Avon, California: | +51.6% |
| California: | +84.4% |
Median per capita income in Glen Avon in 2022:| Glen Avon: | $25,335 |
| State: | $61,706 |
Change in median per capita income between 2000 and 2022:| Glen Avon, California: | +52.9% |
| State: | +122.7% |
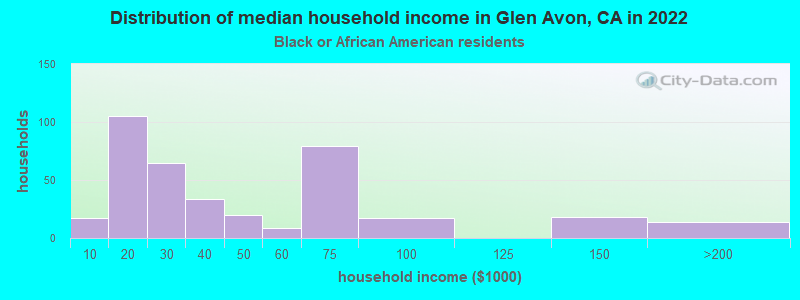
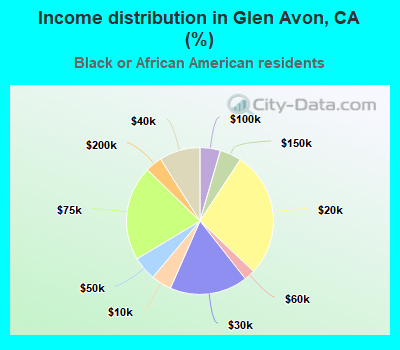
Income statistics for Black or African American residents
Median household income in Glen Avon, CA in 2022:| Glen Avon: | $38,803 |
| California: | $63,268 |
Change in median household income between 2000 and 2022:| Glen Avon, California: | +53.9% |
| State: | +81.0% |
Number of households with income < $10k:| Glen Avon: | 4.5% (17) |
| State: | 9.0% (73,219) |
Number of households with income $10k - 20k:| Glen Avon: | 27.8% (105) |
| State: | 10.6% (86,666) |
Number of households with income $20k - 30k:| Glen Avon: | 17.2% (65) |
| State: | 7.1% (57,719) |
Number of households with income $30k - 40k:| Glen Avon: | 9.0% (34) |
| State: | 7.2% (58,714) |
Number of households with income $40k - 50k:| Glen Avon: | 5.3% (20) |
| California: | 7.1% (58,075) |
Number of households with income $50k - 60k:| Glen Avon: | 2.4% (9) |
| State: | 6.8% (55,229) |
Number of households with income $60k - 75k:| Glen Avon: | 20.9% (79) |
| California: | 8.8% (71,895) |
Number of households with income $75k - 100k:| Glen Avon: | 4.5% (17) |
| State: | 11.9% (96,893) |
Number of households with income $100k - 125k:| Glen Avon: | 0.0% (0) |
| California: | 8.7% (70,729) |
Number of households with income $125k - 150k:| Glen Avon: | 4.8% (18) |
| State: | 6.3% (51,211) |
Number of households with income $150k - 200k:| Glen Avon: | 3.7% (14) |
| State: | 7.2% (58,687) |
Number of households with income > $200k:| Glen Avon: | 0.0% (0) |
| State: | 9.3% (75,487) |
Aggregate household income in Glen Avon in 2022: $27,865,755
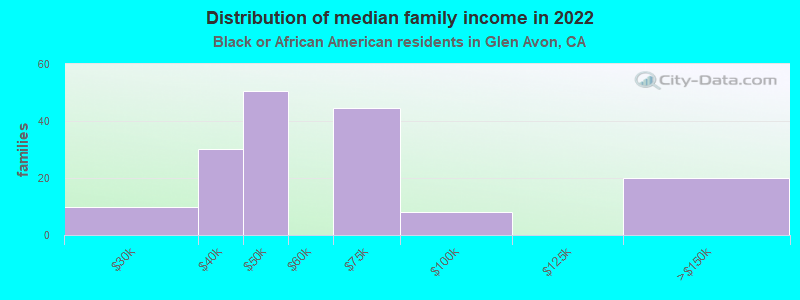
Median family income in Glen Avon in 2022:| Glen Avon: | $61,255 |
| State: | $77,263 |
Number of families with income $20k - 30k:| Glen Avon: | 6.1% (10) |
| State: | 5.6% (25,755) |
Number of families with income $30k - 40k:| Glen Avon: | 18.5% (30) |
| California: | 6.8% (30,948) |
Number of families with income $40k - 50k:| Glen Avon: | 30.8% (50) |
| State: | 8.3% (38,171) |
Number of families with income $60k - 75k:| Glen Avon: | 27.3% (45) |
| State: | 8.7% (40,021) |
Number of families with income $75k - 100k:| Glen Avon: | 5.0% (8) |
| California: | 12.4% (56,846) |
Number of families with income $125k - 150k:| Glen Avon: | 12.3% (20) |
| State: | 7.5% (34,434) |
Median non-family income in Glen Avon in 2022:| Glen Avon: | $14,837 |
| California: | $41,942 |
Change in median non-family income between 2000 and 2022:| Glen Avon, California: | +5.7% |
| State: | +72.0% |
Median per capita income in Glen Avon in 2022:| Glen Avon: | $25,411 |
| State: | $36,708 |
Change in median per capita income between 2000 and 2022:| Glen Avon, California: | +58.0% |
| State: | +110.4% |
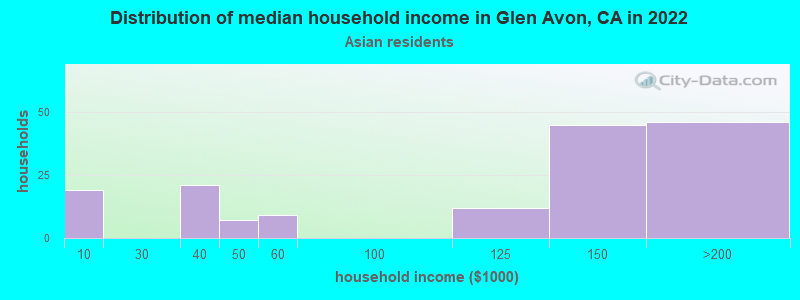
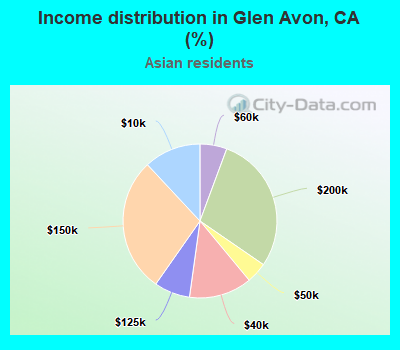
Income statistics for Asian residents
Median household income in Glen Avon, CA in 2022:| Glen Avon: | $152,355 |
| State: | $119,861 |
Number of households with income < $10k:| Glen Avon: | 11.9% (19) |
| California: | 5.1% (106,273) |
Number of households with income $10k - 20k:| Glen Avon: | 0.0% (0) |
| State: | 4.9% (101,815) |
Number of households with income $20k - 30k:| Glen Avon: | 0.0% (0) |
| State: | 4.6% (94,414) |
Number of households with income $30k - 40k:| Glen Avon: | 13.2% (21) |
| State: | 4.1% (84,491) |
Number of households with income $40k - 50k:| Glen Avon: | 4.4% (7) |
| State: | 4.0% (81,758) |
Number of households with income $50k - 60k:| Glen Avon: | 5.7% (9) |
| California: | 3.9% (80,971) |
Number of households with income $60k - 75k:| Glen Avon: | 0.0% (0) |
| California: | 6.0% (124,194) |
Number of households with income $75k - 100k:| Glen Avon: | 0.0% (0) |
| California: | 9.7% (200,337) |
Number of households with income $100k - 125k:| Glen Avon: | 7.5% (12) |
| California: | 9.4% (193,488) |
Number of households with income $125k - 150k:| Glen Avon: | 28.3% (45) |
| California: | 7.7% (158,253) |
Number of households with income $150k - 200k:| Glen Avon: | 28.9% (46) |
| California: | 12.2% (252,139) |
Number of households with income > $200k:| Glen Avon: | 0.0% (0) |
| State: | 28.4% (586,641) |
Aggregate household income in Glen Avon in 2022: $24,777,398
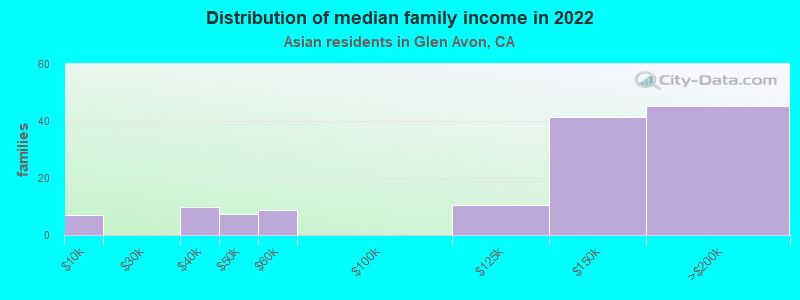
Median family income in Glen Avon in 2022:| Glen Avon: | $198,041 |
| State: | $136,040 |
Number of families with income < $10k:| Glen Avon: | 5.3% (7) |
| State: | 2.8% (42,046) |
Number of families with income $30k - 40k:| Glen Avon: | 7.5% (10) |
| State: | 3.7% (55,234) |
Number of families with income $40k - 50k:| Glen Avon: | 5.8% (8) |
| State: | 3.9% (58,471) |
Number of families with income $50k - 60k:| Glen Avon: | 6.7% (9) |
| California: | 3.9% (58,911) |
Number of families with income $100k - 125k:| Glen Avon: | 8.2% (11) |
| State: | 9.4% (142,085) |
Number of families with income $125k - 150k:| Glen Avon: | 31.7% (41) |
| State: | 8.0% (120,635) |
Number of families with income $150k - 200k:| Glen Avon: | 34.8% (45) |
| State: | 13.2% (198,099) |
Median non-family income in Glen Avon in 2022:| Glen Avon: | $3,564 |
| State: | $74,216 |
Median per capita income in Glen Avon in 2022:| Glen Avon: | $39,962 |
| State: | $58,824 |
Change in median per capita income between 2000 and 2022:| Glen Avon, California: | +71.8% |
| State: | +166.8% |
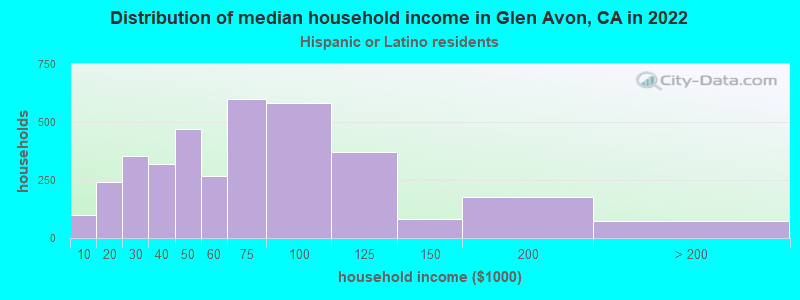
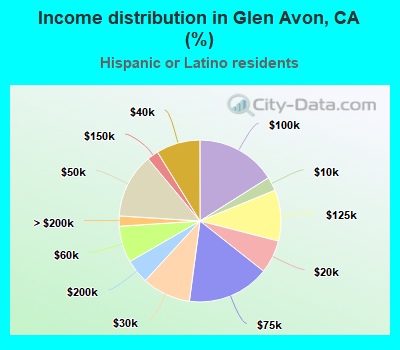
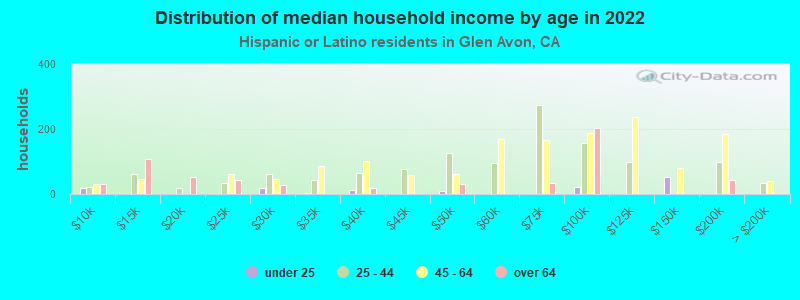
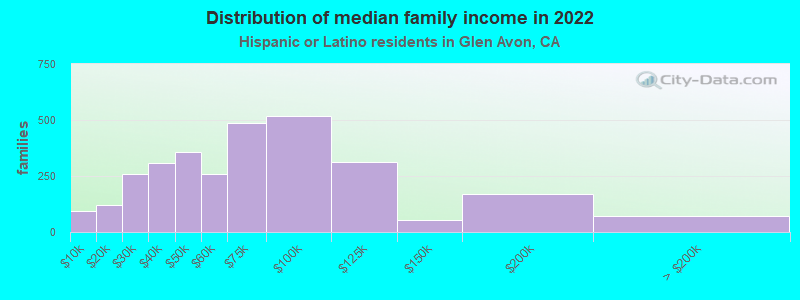
Income statistics for Hispanic or Latino residents
Median household income in Glen Avon, CA in 2022:| Glen Avon: | $72,075 |
| State: | $75,698 |
Change in median household income between 2000 and 2022:| Glen Avon, California: | +76.3% |
| California: | +107.2% |
Number of households with income < $10k:| Glen Avon: | 2.8% (101) |
| State: | 4.3% (183,294) |
Number of households with income $10k - 20k:| Glen Avon: | 6.7% (242) |
| State: | 6.0% (253,903) |
Number of households with income $20k - 30k:| Glen Avon: | 9.7% (354) |
| California: | 6.8% (286,386) |
Number of households with income $30k - 40k:| Glen Avon: | 8.8% (320) |
| State: | 7.4% (313,728) |
Number of households with income $40k - 50k:| Glen Avon: | 12.9% (471) |
| State: | 7.4% (313,199) |
Number of households with income $50k - 60k:| Glen Avon: | 7.3% (266) |
| State: | 7.2% (305,366) |
Number of households with income $60k - 75k:| Glen Avon: | 16.5% (599) |
| California: | 10.3% (434,937) |
Number of households with income $75k - 100k:| Glen Avon: | 16.0% (584) |
| State: | 14.4% (607,302) |
Number of households with income $100k - 125k:| Glen Avon: | 10.2% (370) |
| State: | 10.6% (447,424) |
Number of households with income $125k - 150k:| Glen Avon: | 2.3% (82) |
| State: | 7.5% (316,022) |
Number of households with income $150k - 200k:| Glen Avon: | 4.8% (176) |
| California: | 9.2% (386,269) |
Number of households with income > $200k:| Glen Avon: | 2.0% (74) |
| State: | 8.8% (372,651) |
Aggregate household income in Glen Avon in 2022: $339,958,117
Median family income in Glen Avon in 2022:| Glen Avon: | $75,266 |
| California: | $77,589 |
Number of families with income < $10k:| Glen Avon: | 3.1% (93) |
| State: | 3.9% (129,468) |
Number of families with income $10k - 20k:| Glen Avon: | 4.0% (119) |
| California: | 4.6% (151,997) |
Number of families with income $20k - 30k:| Glen Avon: | 8.5% (257) |
| California: | 6.6% (216,764) |
Number of families with income $30k - 40k:| Glen Avon: | 10.3% (310) |
| State: | 7.6% (249,849) |
Number of families with income $40k - 50k:| Glen Avon: | 11.8% (355) |
| State: | 7.7% (254,822) |
Number of families with income $50k - 60k:| Glen Avon: | 8.7% (261) |
| State: | 7.4% (244,815) |
Number of families with income $60k - 75k:| Glen Avon: | 16.2% (487) |
| State: | 10.5% (345,838) |
Number of families with income $75k - 100k:| Glen Avon: | 17.2% (518) |
| State: | 14.9% (491,589) |
Number of families with income $100k - 125k:| Glen Avon: | 10.3% (311) |
| State: | 10.7% (355,400) |
Number of families with income $125k - 150k:| Glen Avon: | 1.8% (55) |
| State: | 7.8% (259,317) |
Number of families with income $150k - 200k:| Glen Avon: | 5.6% (169) |
| California: | 9.3% (306,566) |
Number of families with income > $200k:| Glen Avon: | 2.4% (71) |
| State: | 9.1% (299,984) |
Median non-family income in Glen Avon in 2022:| Glen Avon: | $30,992 |
| California: | $49,746 |
Median per capita income in Glen Avon in 2022:| Glen Avon: | $20,556 |
| State: | $27,240 |
Change in median per capita income between 2000 and 2022:| Glen Avon, California: | +91.4% |
| State: | +133.3% |
Income statistics for American Indian and Alaska Native residents
Median household income in Glen Avon, CA in 2022:| Glen Avon: | $85,193 |
| State: | $76,752 |
Change in median household income between 2000 and 2022:| Glen Avon, California: | +101.6% |
| California: | +110.0% |
Number of households with income < $10k:| Glen Avon: | 0.0% (0) |
| California: | 5.4% (8,471) |
Number of households with income $10k - 20k:| Glen Avon: | 0.0% (0) |
| State: | 6.0% (9,381) |
Number of households with income $20k - 30k:| Glen Avon: | 0.0% (0) |
| State: | 5.5% (8,668) |
Number of households with income $30k - 40k:| Glen Avon: | 100.0% (30) |
| California: | 8.3% (13,030) |
Number of households with income $40k - 50k:| Glen Avon: | 0.0% (0) |
| State: | 6.9% (10,908) |
Number of households with income $50k - 60k:| Glen Avon: | 0.0% (0) |
| California: | 7.1% (11,198) |
Number of households with income $60k - 75k:| Glen Avon: | 0.0% (0) |
| California: | 9.6% (15,190) |
Number of households with income $75k - 100k:| Glen Avon: | 0.0% (0) |
| State: | 14.1% (22,274) |
Number of households with income $100k - 125k:| Glen Avon: | 0.0% (0) |
| California: | 11.2% (17,643) |
Number of households with income $125k - 150k:| Glen Avon: | 0.0% (0) |
| State: | 8.3% (13,117) |
Number of households with income $150k - 200k:| Glen Avon: | 0.0% (0) |
| California: | 8.8% (13,853) |
Number of households with income > $200k:| Glen Avon: | 0.0% (0) |
| State: | 8.8% (13,925) |
Aggregate household income in Glen Avon in 2022: $18,892,032
Median family income in Glen Avon in 2022:| Glen Avon: | $108,335 |
| State: | $81,108 |
Median non-family income in Glen Avon in 2022:| Glen Avon: | $134,882 |
| State: | $51,296 |
Median per capita income in Glen Avon in 2022:| Glen Avon: | $33,753 |
| California: | $30,289 |
Change in median per capita income between 2000 and 2022:| Glen Avon, California: | +119.1% |
| State: | +98.9% |
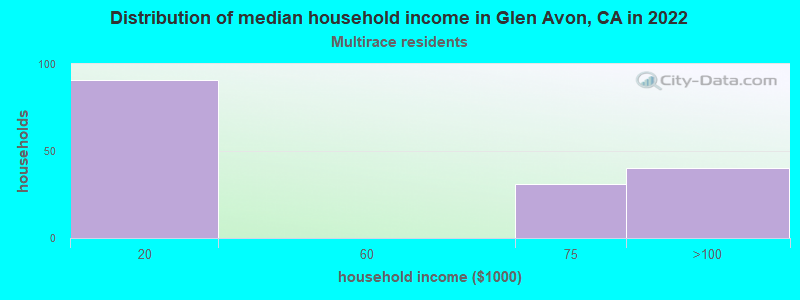
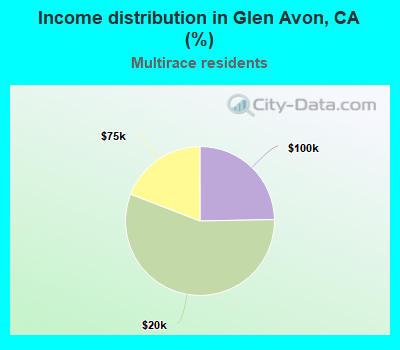
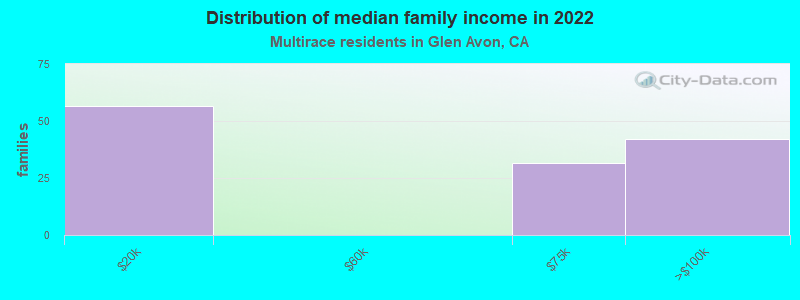
Income statistics for Multirace residents
Median household income in Glen Avon, CA in 2022:| Glen Avon: | $111,015 |
| State: | $83,153 |
Number of households with income < $10k:| Glen Avon: | 0.0% (0) |
| California: | 4.2% (85,299) |
Number of households with income $10k - 20k:| Glen Avon: | 56.2% (91) |
| State: | 6.1% (122,966) |
Number of households with income $20k - 30k:| Glen Avon: | 0.0% (0) |
| State: | 6.4% (129,328) |
Number of households with income $30k - 40k:| Glen Avon: | 0.0% (0) |
| State: | 6.4% (130,070) |
Number of households with income $40k - 50k:| Glen Avon: | 0.0% (0) |
| State: | 6.5% (131,254) |
Number of households with income $50k - 60k:| Glen Avon: | 0.0% (0) |
| State: | 6.5% (132,382) |
Number of households with income $60k - 75k:| Glen Avon: | 19.1% (31) |
| State: | 9.4% (191,472) |
Number of households with income $75k - 100k:| Glen Avon: | 24.7% (40) |
| California: | 13.3% (269,691) |
Number of households with income $100k - 125k:| Glen Avon: | 0.0% (0) |
| State: | 10.2% (207,286) |
Number of households with income $125k - 150k:| Glen Avon: | 0.0% (0) |
| California: | 7.8% (158,259) |
Number of households with income $150k - 200k:| Glen Avon: | 0.0% (0) |
| California: | 10.3% (209,227) |
Number of households with income > $200k:| Glen Avon: | 0.0% (0) |
| California: | 13.0% (263,210) |
Aggregate household income in Glen Avon in 2022: $10,368,053
Median family income in Glen Avon in 2022:| Glen Avon: | $98,356 |
| State: | $87,642 |
Number of families with income $10k - 20k:| Glen Avon: | 43.3% (56) |
| California: | 4.1% (60,419) |
Number of families with income $60k - 75k:| Glen Avon: | 24.3% (32) |
| California: | 9.5% (140,131) |
Number of families with income $75k - 100k:| Glen Avon: | 32.4% (42) |
| California: | 13.8% (203,439) |
Median non-family income in Glen Avon in 2022:| Glen Avon: | $47,346 |
| California: | $56,558 |
Change in median non-family income between 2000 and 2022:| Glen Avon, California: | +80.4% |
| State: | +100.2% |
Median per capita income in Glen Avon in 2022:| Glen Avon: | $9,994 |
| State: | $32,124 |
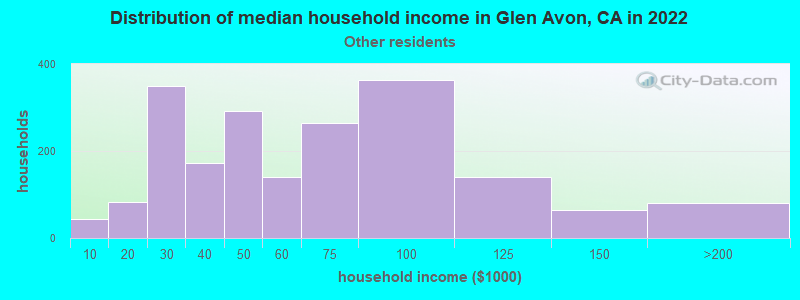
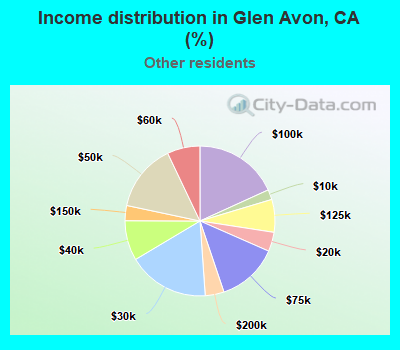
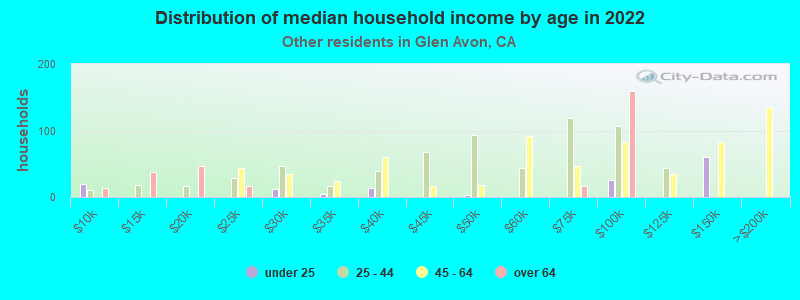
Income statistics for other residents
Median household income in Glen Avon, CA in 2022:| Glen Avon: | $65,629 |
| State: | $71,383 |
Number of households with income < $10k:| Glen Avon: | 2.2% (43) |
| State: | 4.6% (93,035) |
Number of households with income $10k - 20k:| Glen Avon: | 4.2% (83) |
| State: | 6.3% (126,222) |
Number of households with income $20k - 30k:| Glen Avon: | 17.6% (350) |
| California: | 7.1% (142,656) |
Number of households with income $30k - 40k:| Glen Avon: | 8.6% (172) |
| State: | 8.2% (165,018) |
Number of households with income $40k - 50k:| Glen Avon: | 14.6% (291) |
| California: | 8.0% (161,732) |
Number of households with income $50k - 60k:| Glen Avon: | 7.1% (141) |
| State: | 7.6% (152,152) |
Number of households with income $60k - 75k:| Glen Avon: | 13.2% (264) |
| State: | 10.4% (209,951) |
Number of households with income $75k - 100k:| Glen Avon: | 18.2% (363) |
| California: | 14.7% (296,102) |
Number of households with income $100k - 125k:| Glen Avon: | 7.1% (141) |
| State: | 10.7% (214,281) |
Number of households with income $125k - 150k:| Glen Avon: | 3.3% (65) |
| State: | 7.1% (143,092) |
Number of households with income $150k - 200k:| Glen Avon: | 4.1% (81) |
| State: | 8.6% (172,215) |
Number of households with income > $200k:| Glen Avon: | 0.0% (0) |
| California: | 6.7% (134,102) |
Aggregate household income in Glen Avon in 2022: $175,017,170
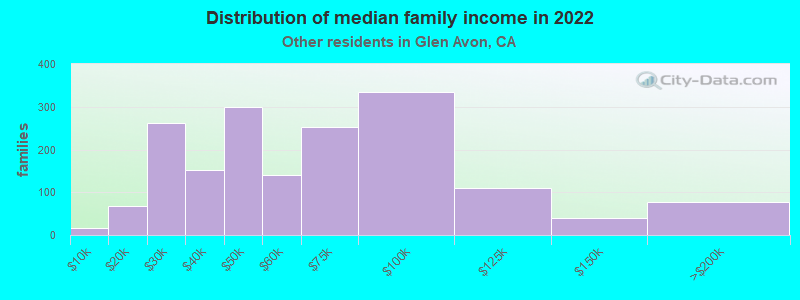
Median family income in Glen Avon in 2022:| Glen Avon: | $67,142 |
| State: | $72,756 |
Number of families with income < $10k:| Glen Avon: | 0.9% (16) |
| State: | 4.3% (69,090) |
Number of families with income $10k - 20k:| Glen Avon: | 3.9% (68) |
| California: | 5.1% (82,116) |
Number of families with income $20k - 30k:| Glen Avon: | 15.0% (263) |
| State: | 7.0% (112,854) |
Number of families with income $30k - 40k:| Glen Avon: | 8.7% (152) |
| State: | 8.4% (135,938) |
Number of families with income $40k - 50k:| Glen Avon: | 17.1% (300) |
| State: | 8.4% (135,353) |
Number of families with income $50k - 60k:| Glen Avon: | 8.0% (140) |
| State: | 7.7% (124,826) |
Number of families with income $60k - 75k:| Glen Avon: | 14.4% (252) |
| State: | 10.7% (173,628) |
Number of families with income $75k - 100k:| Glen Avon: | 19.1% (334) |
| State: | 15.2% (245,724) |
Number of families with income $100k - 125k:| Glen Avon: | 6.2% (109) |
| State: | 10.9% (176,716) |
Number of families with income $125k - 150k:| Glen Avon: | 2.3% (40) |
| California: | 7.4% (119,985) |
Number of families with income $150k - 200k:| Glen Avon: | 4.4% (77) |
| State: | 8.5% (137,332) |
Median non-family income in Glen Avon in 2022:| Glen Avon: | $20,564 |
| State: | $43,881 |
Median per capita income in Glen Avon in 2022:| Glen Avon: | $19,257 |
| California: | $25,164 |
Change in median per capita income between 2000 and 2022:| Glen Avon, California: | +64.3% |
| State: | +137.9% |