Fitchburg, MA (Massachusetts) Houses and Residents
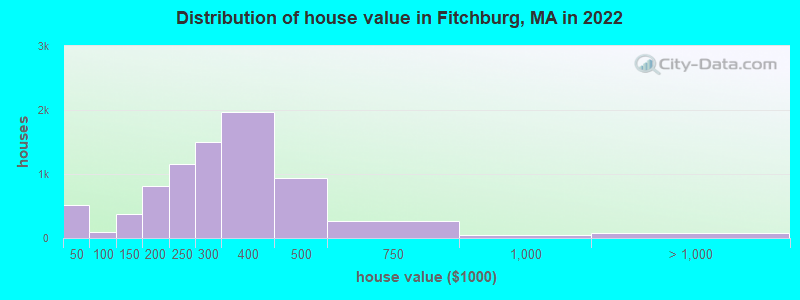
Estimated median house or condo value in 2022: $284,616 (it was $107,800 in 2000 )
Fitchburg:
$284,616Massachusetts:
$534,700
Lower value quartile - upper value quartile: $231,184 - $379,628Mean price in 2022: Detached houses: $325,914 Here:
$325,914State:
$651,570
Townhouses or other attached units: $247,668 Here:
$247,668State:
$617,749
In 2-unit structures: $399,214 Here:
$399,214State:
$594,808
In 3-to-4-unit structures: $255,785 Here:
$255,785State:
$601,912
In 5-or-more-unit structures: $196,742 Here:
$196,742State:
$555,768
Mobile homes: $83,983 Here:
$83,983State:
$170,209
Total population: 40,445 (Urban population: 36,919, Rural population: 2,183 (all nonfarm) )
Houses: 18,073 (16,842 occupied: 9,487 owner occupied, 7,548 renter occupied )
% of renters here:
44%State:
38%
Housing density: 651 houses/condos per square mile
Median price asked for vacant for-sale houses and condos in 2022: $104,746.
Median contract rent in 2022: $941 (lower quartile is $655, upper quartile is $1,255)
Median rent asked for vacant for-rent units in 2022: $1,014
Median gross rent in Fitchburg, MA in 2022: $1,167
Housing units in Fitchburg with a mortgage: 6,407 (910 second mortgage, 0 home equity loan, 746 both second mortgage and home equity loan )Houses without a mortgage: 438
Median household income for houses/condos with a mortgage: $104,079
Median household income for apartments without a mortgage: $68,607
Median monthly housing costs: $1,344
Data:
Median house or condo value ($)
Median house or condo value ($ change since 2000)
Median house or condo value ($) - White
Median house or condo value ($) - Black or African American
Median house or condo value ($) - Asian
Median house or condo value ($) - Hispanic or Latino
Median house or condo value ($) - American Indian and Alaska Native
Median house or condo value ($) - Multirace
Median house or condo value ($) - Other Race
Median price asked for mobile homes ($)
Household density (households per square mile)
Mean house or condo value by units in structure - 1, detached ($)
Mean house or condo value by units in structure - 1, attached ($)
Mean house or condo value by units in structure - 2 ($)
Mean house or condo value by units in structure by units in structure - 3 or 4 ($)
Mean house or condo value by units in structure - 5 or more ($)
Mean house or condo value by units in structure - Boat, RV, van, etc. ($)
Mean house or condo value by units in structure - Mobile home ($)
Median contract rent ($)
Median contract rent - Lower quartile ($)
Median contract rent - Upper quartile ($)
Median gross rent ($)
Urban houses (%)
Rural houses (%)
Houses occupied (%)
Houses occupied (% change since 2000)
Houses owner occupied (%)
Houses owner occupied (% change since 2000)
Houses renter occupied (%)
Houses renter occupied (% change since 2000)
Vacant housing units - For rent (%)
Vacant housing units - For rent (% change since 2000)
Vacant housing units - For sale only (%)
Vacant housing units - For sale only (% change since 2000)
Vacant housing units - Rented or sold, not occupied (%)
Vacant housing units - Rented or sold, not occupied (% change since 2000)
Vacant housing units - For seasonal, recreational, or occasional use (%)
Vacant housing units - For seasonal, recreational, or occasional use (% change since 2000)
Vacant housing units - For migrant workers (%)
Vacant housing units - For migrant workers (% change since 2000)
Vacant housing units - Other vacant (%)
Vacant housing units - Other vacant (% change since 2000)
Median monthly housing costs ($)
Median household income for houses/condos with a mortgage ($)
Median household income for houses/condos without a mortgage ($)
Median household income ($)
Median household income ($) - White
Median household income ($) - Black or African American
Median household income ($) - Asian
Median household income ($) - Hispanic or Latino
Median household income ($) - American Indian and Alaska Native
Median household income ($) - Multirace
Median household income ($) - Other Race
Mortgage status - with mortgage (%)
Mortgage status - with second mortgage (%)
Mortgage status - with home equity loan (%)
Mortgage status - with both second mortgage and home equity loan (%)
Mortgage status - without a mortgage (%)
Median year house/condo built
Median year apartment built
Household type by relationship - Male householder living alone (%)
Household type by relationship - Male householder not living alone (%)
Household type by relationship - Female householder living alone (%)
Household type by relationship - Female householder not living alone (%)
Household type by relationship - Opposite-Sex spouse (%)
Household type by relationship - Same-Sex spouse (%)
Household type by relationship - Opposite-Sex unmarried partner (%)
Household type by relationship - Same-Sex unmarried partner (%)
Household type by relationship - In group quarters (%)
Size of family households - 2-person household (%)
Size of family households - 3-person household (%)
Size of family households - 4-person household (%)
Size of family households - 5-person household (%)
Size of family households - 6-person household (%)
Size of family households - 7-or-more-person household (%)
Size of nonfamily households - 1-person household (%)
Size of nonfamily households - 2-person household (%)
Size of nonfamily households - 3-person household (%)
Size of nonfamily households - 4-person household (%)
Size of nonfamily households - 5-person household (%)
Size of nonfamily households - 6-person household (%)
Size of nonfamily households - 7-or-moreperson household (%)
Year house built - Built 2010 or later (%)
Year house built - Built 2000 to 2009 (%)
Year house built - Built 1990 to 1999 (%)
Year house built - Built 1980 to 1989 (%)
Year house built - Built 1970 to 1979 (%)
Year house built - Built 1960 to 1969 (%)
Year house built - Built 1950 to 1959 (%)
Year house built - Built 1940 to 1949 (%)
Year house built - Built 1939 or earlier (%)
Median number of rooms in houses and condos
Median number of rooms in apartments
Median number of bedrooms in owner occupied houses
Mean number of bedrooms in owner occupied houses
Median number of bedrooms in renter occupied houses
Mean number of bedrooms in renter occupied houses
Median number of vehichles in owner occupied houses
Mean number of vehichles in owner occupied houses
Median number of vehichles in renter occupied houses
Mean number of vehichles in renter occupied houses
Rooms in owner-occupied houses - 1 room (%)
Rooms in owner-occupied houses - 2 rooms (%)
Rooms in owner-occupied houses - 3 rooms (%)
Rooms in owner-occupied houses - 4 rooms (%)
Rooms in owner-occupied houses - 5 rooms (%)
Rooms in owner-occupied houses - 6 rooms (%)
Rooms in owner-occupied houses - 7 rooms (%)
Rooms in owner-occupied houses - 8 rooms (%)
Rooms in owner-occupied houses - 9+ rooms (%)
Rooms in renter-occupied houses - 1 room (%)
Rooms in renter-occupied houses - 2 rooms (%)
Rooms in renter-occupied houses - 3 rooms (%)
Rooms in renter-occupied houses - 4 rooms (%)
Rooms in renter-occupied houses - 5 rooms (%)
Rooms in renter-occupied houses - 6 rooms (%)
Rooms in renter-occupied houses - 7 rooms (%)
Rooms in renter-occupied houses - 8 rooms (%)
Rooms in renter-occupied houses - 9+ rooms (%)
Bedrooms in owner-occupied houses - no bedrooms (%)
Bedrooms in owner-occupied houses - 1 bedroom (%)
Bedrooms in owner-occupied houses - 2 bedrooms (%)
Bedrooms in owner-occupied houses - 3 bedrooms (%)
Bedrooms in owner-occupied houses - 4 bedrooms (%)
Bedrooms in owner-occupied houses - 5+ bedrooms (%)
Bedrooms in renter-occupied houses - no bedrooms (%)
Bedrooms in renter-occupied houses - 1 bedroom (%)
Bedrooms in renter-occupied houses - 2 bedrooms (%)
Bedrooms in renter-occupied houses - 3 bedrooms (%)
Bedrooms in renter-occupied houses - 4 bedrooms (%)
Bedrooms in renter-occupied houses - 5+ bedrooms (%)
Vehicles available in owner-occupied houses - no vehicle available (%)
Vehicles available in owner-occupied houses - 1 vehicle available(%)
Vehicles available in owner-occupied houses - 2 Vehicles available (%)
Vehicles available in owner-occupied houses - 3 Vehicles available (%)
Vehicles available in owner-occupied houses - 4 Vehicles available (%)
Vehicles available in owner-occupied houses - 5+ Vehicles available (%)
Vehicles available in renter-occupied houses - no vehicle available (%)
Vehicles available in renter-occupied houses - 1 vehicle available (%)
Vehicles available in renter-occupied houses - 2 Vehicles available (%)
Vehicles available in renter-occupied houses - 3 Vehicles available (%)
Vehicles available in renter-occupied houses - 4 Vehicles available (%)
Vehicles available in renter-occupied houses - 5+ Vehicles available (%)
Housing units in structures - 1, detached (%)
Housing units in structures - 1, attached (%)
Housing units in structures - 2 (%)
Housing units in structures - 3 or 4 (%)
Housing units in structures - 5 to 9 (%)
Housing units in structures - 10 to 19 (%)
Housing units in structures - 20 to 49 (%)
Housing units in structures - 50 or more (%)
Housing units in structures - Mobile home (%)
Housing units in structures - Boat, RV, van, etc. (%)
Housing units in structures - Owners - 1, detached (%)
Housing units in structures - Owners - 1, attached (%)
Housing units in structures - Owners - 2 (%)
Housing units in structures - Owners - 3 or 4 (%)
Housing units in structures - Owners - 5 to 9 (%)
Housing units in structures - Owners - 10 to 19 (%)
Housing units in structures - Owners - 20 to 49 (%)
Housing units in structures - Owners - 50 or more (%)
Housing units in structures - Owners - Mobile home (%)
Housing units in structures - Owners - Boat, RV, van, etc. (%)
Housing units in structures - Renters - 1, detached (%)
Housing units in structures - Renters - 1, attached (%)
Housing units in structures - Renters - 2 (%)
Housing units in structures - Renters - 3 or 4 (%)
Housing units in structures - Renters - 5 to 9 (%)
Housing units in structures - Renters - 10 to 19 (%)
Housing units in structures - Renters - 20 to 49 (%)
Housing units in structures - Renters - 50 or more (%)
Housing units in structures - Renters - Mobile home (%)
Housing units in structures - Renters - Boat, RV, van, etc. (%)
House/condo owner moved in on average (years ago)
Renter moved in on average (years ago)
Year householder moved into unit - Moved in 1999 to March 2000 (%)
Year householder moved into unit - Moved in 1999 to March 2000 (%) - White
Year householder moved into unit - Moved in 1999 to March 2000 (%) - Black or African American
Year householder moved into unit - Moved in 1999 to March 2000 (%) - Asian
Year householder moved into unit - Moved in 1999 to March 2000 (%) - Hispanic or Latino
Year householder moved into unit - Moved in 1999 to March 2000 (%) - American Indian and Alaska Native
Year householder moved into unit - Moved in 1999 to March 2000 (%) - Multirace
Year householder moved into unit - Moved in 1999 to March 2000 (%) - Other Race
Year householder moved into unit - Moved in 1995 to 1998 (%)
Year householder moved into unit - Moved in 1995 to 1998 (%) - White
Year householder moved into unit - Moved in 1995 to 1998 (%) - Black or African American
Year householder moved into unit - Moved in 1995 to 1998 (%) - Asian
Year householder moved into unit - Moved in 1995 to 1998 (%) - Hispanic or Latino
Year householder moved into unit - Moved in 1995 to 1998 (%) - American Indian and Alaska Native
Year householder moved into unit - Moved in 1995 to 1998 (%) - Multirace
Year householder moved into unit - Moved in 1995 to 1998 (%) - Other Race
Year householder moved into unit - Moved in 1990 to 1994 (%)
Year householder moved into unit - Moved in 1990 to 1994 (%) - White
Year householder moved into unit - Moved in 1990 to 1994 (%) - Black or African American
Year householder moved into unit - Moved in 1990 to 1994 (%) - Asian
Year householder moved into unit - Moved in 1990 to 1994 (%) - Hispanic or Latino
Year householder moved into unit - Moved in 1990 to 1994 (%) - American Indian and Alaska Native
Year householder moved into unit - Moved in 1990 to 1994 (%) - Multirace
Year householder moved into unit - Moved in 1990 to 1994 (%) - Other Race
Year householder moved into unit - Moved in 1980 to 1989 (%)
Year householder moved into unit - Moved in 1980 to 1989 (%) - White
Year householder moved into unit - Moved in 1980 to 1989 (%) - Black or African American
Year householder moved into unit - Moved in 1980 to 1989 (%) - Asian
Year householder moved into unit - Moved in 1980 to 1989 (%) - Hispanic or Latino
Year householder moved into unit - Moved in 1980 to 1989 (%) - American Indian and Alaska Native
Year householder moved into unit - Moved in 1980 to 1989 (%) - Multirace
Year householder moved into unit - Moved in 1980 to 1989 (%) - Other Race
Year householder moved into unit - Moved in 1970 to 1979 (%)
Year householder moved into unit - Moved in 1970 to 1979 (%) - White
Year householder moved into unit - Moved in 1970 to 1979 (%) - Black or African American
Year householder moved into unit - Moved in 1970 to 1979 (%) - Asian
Year householder moved into unit - Moved in 1970 to 1979 (%) - Hispanic or Latino
Year householder moved into unit - Moved in 1970 to 1979 (%) - American Indian and Alaska Native
Year householder moved into unit - Moved in 1970 to 1979 (%) - Multirace
Year householder moved into unit - Moved in 1970 to 1979 (%) - Other Race
Year householder moved into unit - Moved in 1969 or earlier (%)
Year householder moved into unit - Moved in 1969 or earlier (%) - White
Year householder moved into unit - Moved in 1969 or earlier (%) - Black or African American
Year householder moved into unit - Moved in 1969 or earlier (%) - Asian
Year householder moved into unit - Moved in 1969 or earlier (%) - Hispanic or Latino
Year householder moved into unit - Moved in 1969 or earlier (%) - American Indian and Alaska Native
Year householder moved into unit - Moved in 1969 or earlier (%) - Multirace
Year householder moved into unit - Moved in 1969 or earlier (%) - Other Race
Housing units lacking complete plumbing facilities (%)
Housing units lacking complete kitchen facilities (%)
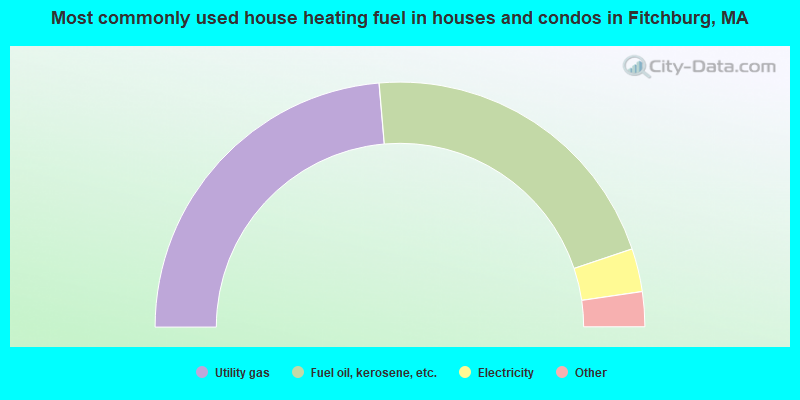
House heating fuel used in houses and condos - Utility gas (%)
House heating fuel used in houses and condos - Bottled, tank, or LP gas (%)
House heating fuel used in houses and condos - Electricity (%)
House heating fuel used in houses and condos - Fuel oil, kerosene, etc. (%)
House heating fuel used in houses and condos - Coal or coke (%)
House heating fuel used in houses and condos - Wood (%)
House heating fuel used in houses and condos - Solar energy (%)
House heating fuel used in houses and condos - Other fuel (%)
House heating fuel used in houses and condos - No fuel used (%)
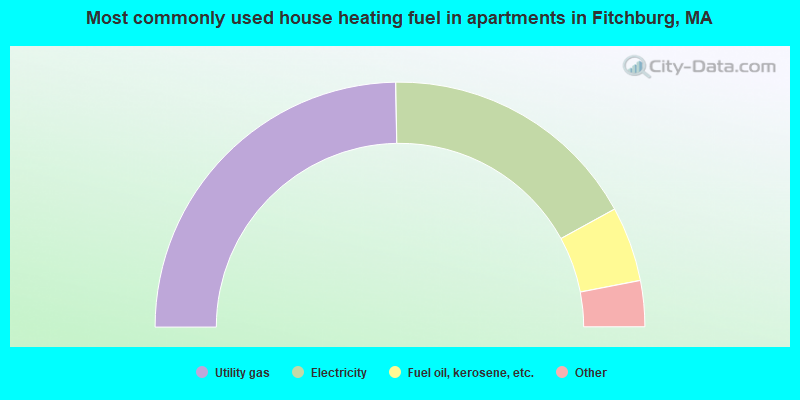
House heating fuel used in apartments - Utility gas (%)
House heating fuel used in apartments - Bottled, tank, or LP gas (%)
House heating fuel used in apartments - Electricity (%)
House heating fuel used in apartments - Fuel oil, kerosene, etc. (%)
House heating fuel used in apartments - Coal or coke (%)
House heating fuel used in apartments - Wood (%)
House heating fuel used in apartments - Solar energy (%)
House heating fuel used in apartments - Other fuel (%)
House heating fuel used in apartments - No fuel used (%)
Latest news about housing in Fitchburg, MA collected exclusively by city-data.com from local newspapers, TV, and radio stations
Median year house/condo built: 1952Median year apartment built: 1950Household type by relationship:
Households: 41,816
Male householders: 7,414 (2,539 living alone ), Female householders: 9,308 (2,873 living alone )5,902 spouses (5,832 opposite-sex spouses ), 1,604 unmarried partners , (1,578 opposite-sex unmarried partners ), 11,573 children (10,692 natural , 195 adopted , 684 stepchildren ), 676 grandchildren , 459 brothers or sisters , 799 parents , 156 foster children , 632 other relatives , 1,664 non-relatives In group quarters: 1,623
Size of family households: 4,033 2-persons , 2,391 3-persons , 2,267 4-persons , 473 5-persons , 261 6-persons , 259 7-or-more-persons .
Size of nonfamily households: 5,592 1-person , 1,320 2-persons , 386 3-persons , 118 4-persons , 20 6-persons , 42 7-or-more-persons .
4,075 married couples with children. single-parent households (1,091 men , 2,264 women ).
70.7% of residents of Fitchburg speak English at home. of residents speak Spanish at home (59% speak English very well , 18% speak English well , 17% speak English not well , 7% don't speak English at all ).of residents speak other Indo-European language at home (71% speak English very well , 28% speak English well , 1% speak English not well ).of residents speak Asian or Pacific Island language at home (43% speak English very well , 25% speak English well , 23% speak English not well , 9% don't speak English at all ).of residents speak other language at home (76% speak English very well , 21% speak English well , 1% speak English not well , 2% don't speak English at all ).
Foreign born population: 4,441 (10.6%)of them are naturalized citizens )
Median number of rooms in houses and condos:
Median number of rooms in apartments
Owner-occupied Renter-occupied
Rooms in owner-occupied houses in Fitchburg, Massachusetts
18 1 room 17 2 rooms 116 3 rooms 1,170 4 rooms 1,874 5 rooms 2,477 6 rooms 1,468 7 rooms 954 8 rooms 1,394 9+ rooms
Rooms in renter-occupied apartments in Fitchburg, Massachusetts
447 1 room 496 2 rooms 1,668 3 rooms 2,032 4 rooms 1,526 5 rooms 1,035 6 rooms 212 7 rooms 43 8 rooms 89 9+ rooms
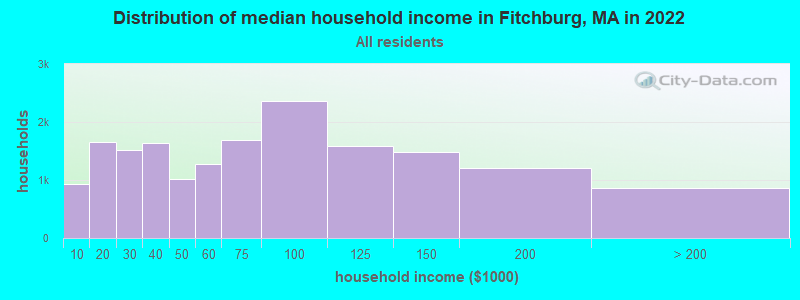
Fitchburg, MA household income distribution 939 Less than $10,0001,662 $10,000 to $19,9991,519 $20,000 to $29,9991,642 $30,000 to $39,9991,013 $40,000 to $49,9991,272 $50,000 to $59,9991,690 $60,000 to $74,9992,368 $75,000 to $99,9991,585 $100,000 to $124,9991,488 $125,000 to $149,9991,211 $150,000 to $199,999863 $200,000 or more
Home value of owner - occupied houses in 2022 in Fitchburg, MA 159 Less than $10,00077 $10,000 to $14,99955 $15,000 to $19,999175 $20,000 to $24,99947 $25,000 to $29,9994 $40,000 to $49,99919 $50,000 to $59,9994 $70,000 to $79,99952 $80,000 to $89,99915 $90,000 to $99,999119 $100,000 to $124,999259 $125,000 to $149,999348 $150,000 to $174,999457 $175,000 to $199,9991,163 $200,000 to $249,9991,498 $250,000 to $299,9991,971 $300,000 to $399,999944 $400,000 to $499,999262 $500,000 to $749,99942 $750,000 to $999,99945 $1,000,000 to $1,499,99929 $2,000,000 or moreRent paid by renters in 2022 in Fitchburg, MA 26 Less than $10069 $100 to $149101 $150 to $199412 $200 to $249491 $250 to $299137 $300 to $349143 $350 to $39998 $400 to $44957 $450 to $499341 $500 to $54979 $550 to $599185 $600 to $64996 $650 to $699388 $700 to $749365 $750 to $799666 $800 to $899968 $900 to $9991,439 $1,000 to $1,249667 $1,250 to $1,499814 $1,500 to $1,999108 $2,000 to $2,49991 $2,500 to $2,99947 $3,500 or more185 No cash rent
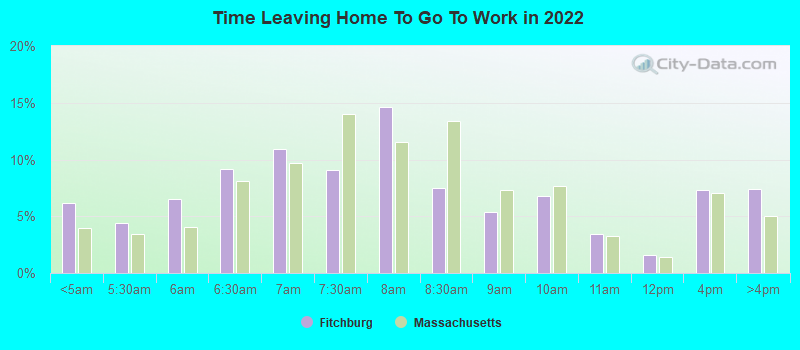
Percentage of workers working in this county: 77.6%Number of people working at home: 2,276 (11.0% of all workers )
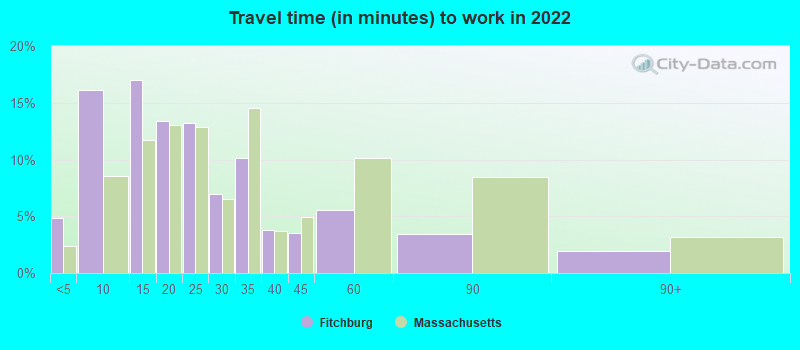
Travel time to work (commute)
Less than 5 minutes: 6225 to 9 minutes: 2,50310 to 14 minutes: 3,03115 to 19 minutes: 2,76120 to 24 minutes: 2,09525 to 29 minutes: 1,16830 to 34 minutes: 1,54035 to 39 minutes: 71440 to 44 minutes: 72945 to 59 minutes: 1,80460 to 89 minutes: 77690 or more minutes: 474
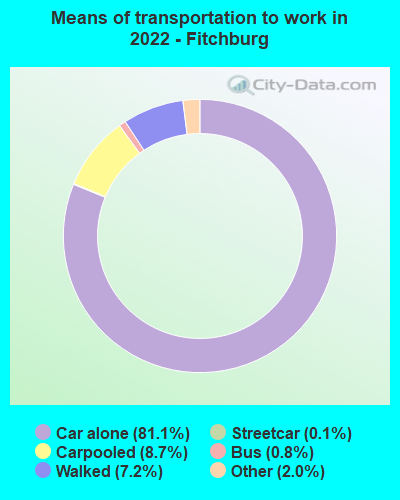
Means of transportation to work:
Drove a car alone: 10,552 (68.4%)Carpooled: 1,210 (7.8%)Bus : 128 (0.8%)Subway or elevated rail : 18 (0.1%)Taxi: 329 (2.1%)Bicycle: 5 (0.0%)Walked: 691 (4.5%)Worked at home: 2,276 (14.7%)
Unemployment by race in 2022
Unemployment rate for White non-Hispanic residents 5.0% Males3.8% FemalesUnemployment rate for Black residents 3.3% Males23.4% FemalesUnemployment rate for Asian residents 5.5% Males22.8% FemalesUnemployment rate for other race residents 5.8% Males21.9% FemalesUnemployment rate for two or more race residents 7.1% Males16.5% FemalesUnemployment rate for Hispanic or Latino residents 8.2% Males14.3% Females
Year of entry for the foreign-born population in Fitchburg, Massachusetts
1,986 2010 or later 958 2000 to 2009 540 1990 to 1999 936 1980 to 1989 374 1970 to 1979 1,024 Before 1970
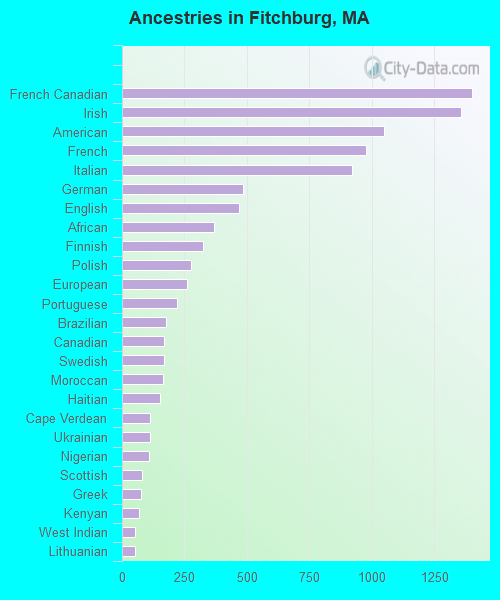
First ancestries reported:
French Canadian: 1,400 (7.2%)
Irish: 1,359 (7.0%)
American: 1,048 (5.4%)
French: 979 (5.0%)
Italian: 922 (4.7%)
German: 485 (2.5%)
English: 468 (2.4%)
African: 369 (1.9%)
Finnish: 323 (1.7%)
Polish: 278 (1.4%)
European: 261 (1.3%)
Portuguese: 220 (1.1%)
Brazilian: 176 (0.9%)
Canadian: 169 (0.9%)
Swedish: 167 (0.9%)
Moroccan: 163 (0.8%)
Haitian: 153 (0.8%)
Cape Verdean: 114 (0.6%)
Ukrainian: 112 (0.6%)
Nigerian: 107 (0.5%)
Scottish: 80 (0.4%)
Greek: 75 (0.4%)
Kenyan: 70 (0.4%)
West Indian: 52 (0.3%)
Lithuanian: 52 (0.3%)
Jamaican: 44 (0.2%)
Albanian: 32 (0.2%)
Armenian: 29 (0.1%)
Scotch-Irish: 25 (0.1%)
Celtic: 17 (0.09%)
Norwegian: 16 (0.08%)
Hungarian: 15 (0.08%)
Northern European: 12 (0.06%)
British: 11 (0.06%)
Lebanese: 9 (0.05%)
Ghanaian: 8 (0.04%)
Russian: 7 (0.04%)
Australian: 6 (0.03%)
Bulgarian: 5 (0.03%) Most common places of birth for foreign-born residents (%): Uruguay Fitchburg:
19.3% (841)Massachusetts:
0.2% (2,282)
Mexico Fitchburg:
7.9% (343)Massachusetts:
1.1% (13,065)
Laos Fitchburg:
6.4% (277)Massachusetts:
0.2% (2,448)
Canada Fitchburg:
5.5% (242)Massachusetts:
2.3% (28,158)
Kenya Fitchburg:
5.5% (238)Massachusetts:
0.7% (8,746)
Dominican Republic Fitchburg:
5.4% (237)Massachusetts:
8.3% (101,767)
Africa, n.e.c. Fitchburg:
4.2% (184)Massachusetts:
0.3% (3,864)
India Fitchburg:
3.6% (158)Massachusetts:
6.8% (82,934)
Ireland Fitchburg:
3.1% (137)Massachusetts:
1.1% (13,446)
Brazil Fitchburg:
3.1% (135)Massachusetts:
7.6% (92,959)
Colombia Fitchburg:
2.9% (128)Massachusetts:
2.3% (27,810)
Guatemala Fitchburg:
2.8% (124)Massachusetts:
2.7% (32,733)
Haiti Fitchburg:
2.8% (120)Massachusetts:
4.9% (60,432)
Jamaica Fitchburg:
2.2% (96)Massachusetts:
1.7% (21,468)
Germany Fitchburg:
2.1% (90)Massachusetts:
1.0% (12,529)
Portugal Fitchburg:
1.9% (82)Massachusetts:
4.1% (50,360)
Philippines Fitchburg:
1.8% (79)Massachusetts:
0.9% (10,810)
Vietnam Fitchburg:
1.7% (73)Massachusetts:
3.0% (37,197)
Chile Fitchburg:
1.6% (71)Massachusetts:
0.2% (2,809)
Morocco Fitchburg:
1.6% (71)Massachusetts:
0.7% (8,562)
Place of birth for U.S.-born residents:
This state: 26,777Other state: 6,473Northeast: 3,204Midwest: 861South: 1,622West: 847 89.2% of Fitchburg residents lived in the same house 1 years ago.
Out of people who lived in different houses, 37.7% lived in this county.
Out of people who lived in different counties, 64.2% lived in Massachusetts.
Fitchburg:
89.2%State average:
87.7%
Education attainment for males 25 years and older:
No schooling: 395Nursery to 4th grade: 695th and 6th grade: 1897th and 8th grade: 4429th grade: 28410th grade: 30011th grade: 39812th grade, no diploma: 201High school graduate (or equivalency): 5,051Less than 1 year of college: 1,047Some college more than 1 year, no degree: 1,827Associate degree: 993Bachelor's degree: 2,385Master's degree: 563Professional school degree: 126Doctorate degree: 99
Education attainment for females 25 years and older:
No schooling: 259Nursery to 4th grade: 955th and 6th grade: 1387th and 8th grade: 3019th grade: 49810th grade: 7411th grade: 15412th grade, no diploma: 204High school graduate (or equivalency): 4,187Less than 1 year of college: 1,305Some college more than 1 year, no degree: 2,015Associate degree: 1,430Bachelor's degree: 2,056Master's degree: 1,155Professional school degree: 107Doctorate degree: 63
Housing units in structures:
One, detached: 7,772One, attached: 1,214Two: 2,3093 or 4: 3,2035 to 9: 1,12110 to 19: 51620 to 49: 37650 or more: 1,481Mobile homes: 78Housing units lacking complete plumbing facilities in 2022: 0.8%Housing units lacking complete kitchen facilities in 2022: 1.0%House/condo owner moved in on average 11 years ago
Renter moved in on average 5 years ago
Private vs. public school enrollment:
Students in private schools in grades 1 to 8 (elementary and middle school): 477 Here:
13.1%Massachusetts:
10.3%
Students in private schools in grades 9 to 12 (high school): 137 Here:
7.7%Massachusetts:
12.3%
Students in private undergraduate colleges: 888 Here:
30.5%Massachusetts:
51.2%