Races in Fitchburg, Massachusetts (MA) Detailed Stats
Data:
Races - White alone (%)
Races - White alone (% change since 2000)
Races - Black alone (%)
Races - Black alone (% change since 2000)
Races - American Indian alone (%)
Races - American Indian alone (% change since 2000)
Races - Asian alone (%)
Races - Asian alone (% change since 2000)
Races - Hispanic (%)
Races - Hispanic (% change since 2000)
Races - Native Hawaiian and Other Pacific Islander alone (%)
Races - Native Hawaiian and Other Pacific Islander alone (% change since 2000)
Races - Two or more races(%)
Races - Two or more races(% change since 2000)
Races - Other race alone (%)
Races - Other race alone (% change since 2000)
Racial diversity
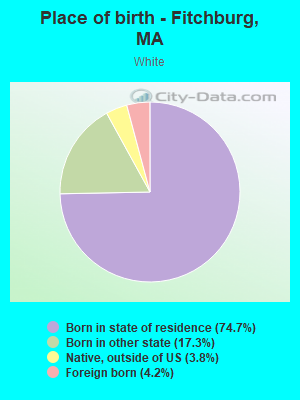
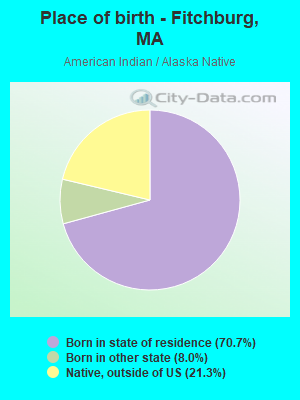
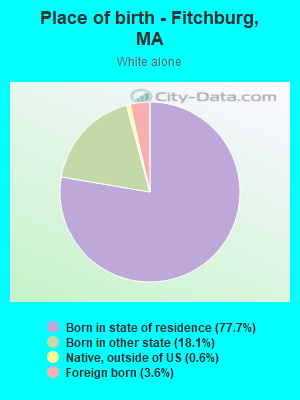
Place of birth - Born in state of residence (%)
Place of birth - Born in state of residence (%) - White
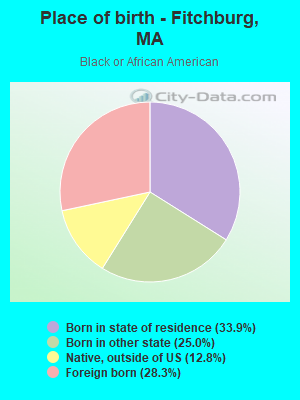
Place of birth - Born in state of residence (%) - Black or African American
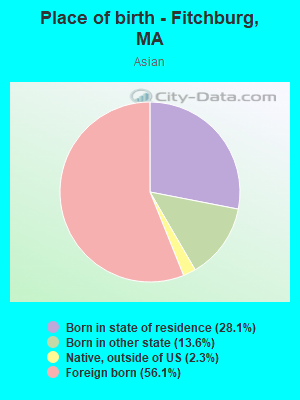
Place of birth - Born in state of residence (%) - Asian
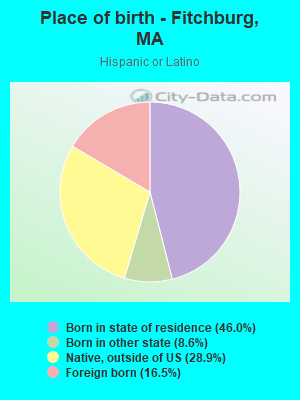
Place of birth - Born in state of residence (%) - Hispanic or Latino
Place of birth - Born in state of residence (%) - American Indian and Alaska Native
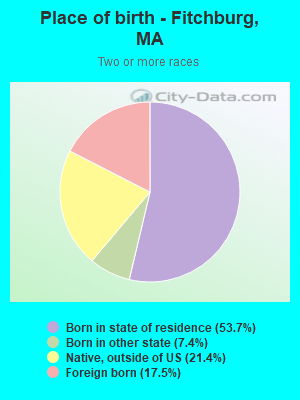
Place of birth - Born in state of residence (%) - Multirace
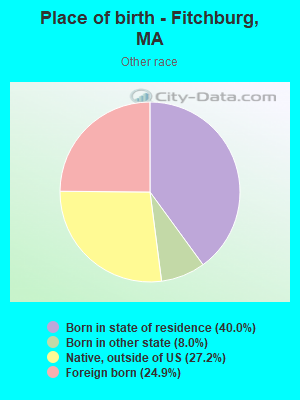
Place of birth - Born in state of residence (%) - Other Race
Place of birth - Born in other state (%)
Place of birth - Born in other state (%) - White
Place of birth - Born in other state (%) - Black or African American
Place of birth - Born in other state (%) - Asian
Place of birth - Born in other state (%) - Hispanic or Latino
Place of birth - Born in other state (%) - American Indian and Alaska Native
Place of birth - Born in other state (%) - Multirace
Place of birth - Born in other state (%) - Other Race
Place of birth - Native, outside of US (%)
Place of birth - Native, outside of US (%) - White
Place of birth - Native, outside of US (%) - Black or African American
Place of birth - Native, outside of US (%) - Asian
Place of birth - Native, outside of US (%) - Hispanic or Latino
Place of birth - Native, outside of US (%) - American Indian and Alaska Native
Place of birth - Native, outside of US (%) - Multirace
Place of birth - Native, outside of US (%) - Other Race
Place of birth - Foreign born (%)
Place of birth - Foreign born (%) - White
Place of birth - Foreign born (%) - Black or African American
Place of birth - Foreign born (%) - Asian
Place of birth - Foreign born (%) - Hispanic or Latino
Place of birth - Foreign born (%) - American Indian and Alaska Native
Place of birth - Foreign born (%) - Multirace
Place of birth - Foreign born (%) - Other Race
Residents speaking English at home (%)
Residents speaking English at home - Born in the United States (%)
Residents speaking English at home - Native, born elsewhere (%)
Residents speaking English at home - Foreign born (%)
Residents speaking Spanish at home (%)
Residents speaking Spanish at home - Born in the United States (%)
Residents speaking Spanish at home - Native, born elsewhere (%)
Residents speaking Spanish at home - Foreign born (%)
Residents speaking other language at home (%)
Residents speaking other language at home - Born in the United States (%)
Residents speaking other language at home - Native, born elsewhere (%)
Residents speaking other language at home - Foreign born (%)
Marital status - Never married (%)
Marital status - Now married (%)
Marital status - Separated (%)
Marital status - Widowed (%)
Marital status - Divorced (%)
Ancestries Reported - Arab (%)
Ancestries Reported - Czech (%)
Ancestries Reported - Danish (%)
Ancestries Reported - Dutch (%)
Ancestries Reported - English (%)
Ancestries Reported - French (%)
Ancestries Reported - French Canadian (%)
Ancestries Reported - German (%)
Ancestries Reported - Greek (%)
Ancestries Reported - Hungarian (%)
Ancestries Reported - Irish (%)
Ancestries Reported - Italian (%)
Ancestries Reported - Lithuanian (%)
Ancestries Reported - Norwegian (%)
Ancestries Reported - Polish (%)
Ancestries Reported - Portuguese (%)
Ancestries Reported - Russian (%)
Ancestries Reported - Scotch-Irish (%)
Ancestries Reported - Scottish (%)
Ancestries Reported - Slovak (%)
Ancestries Reported - Subsaharan African (%)
Ancestries Reported - Swedish (%)
Ancestries Reported - Swiss (%)
Ancestries Reported - Ukrainian (%)
Ancestries Reported - United States (%)
Ancestries Reported - Welsh (%)
Ancestries Reported - West Indian (%)
Ancestries Reported - Other (%)
Geographical mobility - Same house 1 year ago (%)
Geographical mobility - Same house 1 year ago (%) - White
Geographical mobility - Same house 1 year ago (%) - Black or African American
Geographical mobility - Same house 1 year ago (%) - Asian
Geographical mobility - Same house 1 year ago (%) - Hispanic or Latino
Geographical mobility - Same house 1 year ago (%) - American Indian and Alaska Native
Geographical mobility - Same house 1 year ago (%) - Multirace
Geographical mobility - Same house 1 year ago (%) - Other Race
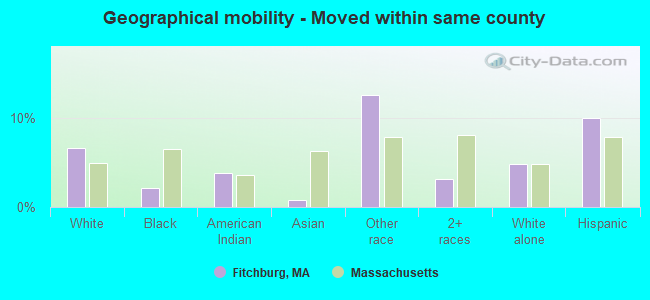
Geographical mobility - Moved within same county (%)
Geographical mobility - Moved within same county (%) - White
Geographical mobility - Moved within same county (%) - Black or African American
Geographical mobility - Moved within same county (%) - Asian
Geographical mobility - Moved within same county (%) - Hispanic or Latino
Geographical mobility - Moved within same county (%) - American Indian and Alaska Native
Geographical mobility - Moved within same county (%) - Multirace
Geographical mobility - Moved within same county (%) - Other Race
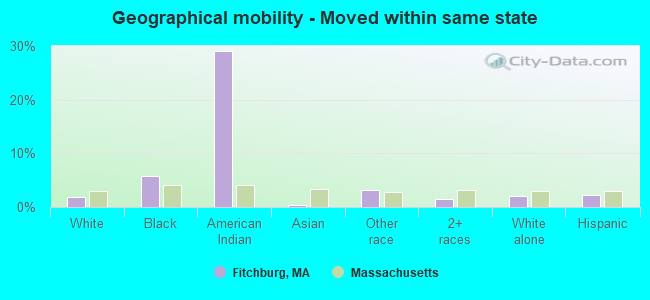
Geographical mobility - Moved from different county within same state (%)
Geographical mobility - Moved from different county within same state (%) - White
Geographical mobility - Moved from different county within same state (%) - Black or African American
Geographical mobility - Moved from different county within same state (%) - Asian
Geographical mobility - Moved from different county within same state (%) - Hispanic or Latino
Geographical mobility - Moved from different county within same state (%) - American Indian and Alaska Native
Geographical mobility - Moved from different county within same state (%) - Multirace
Geographical mobility - Moved from different county within same state (%) - Other Race
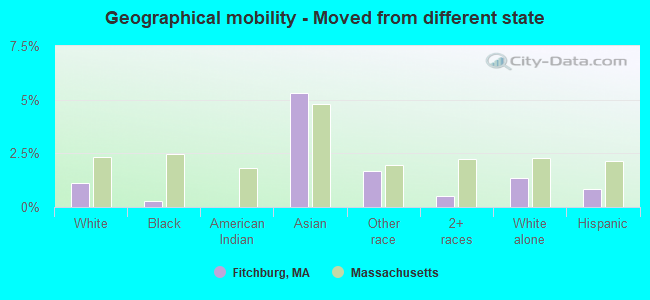
Geographical mobility - Moved from different state (%)
Geographical mobility - Moved from different state (%) - White
Geographical mobility - Moved from different state (%) - Black or African American
Geographical mobility - Moved from different state (%) - Asian
Geographical mobility - Moved from different state (%) - Hispanic or Latino
Geographical mobility - Moved from different state (%) - American Indian and Alaska Native
Geographical mobility - Moved from different state (%) - Multirace
Geographical mobility - Moved from different state (%) - Other Race
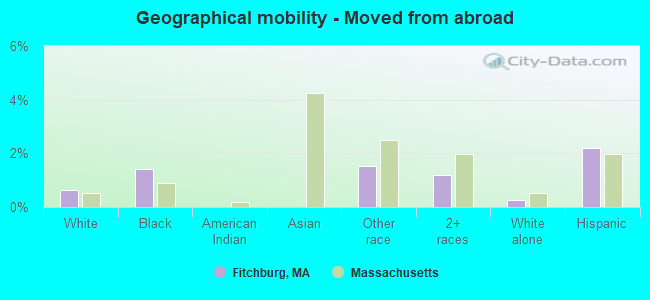
Geographical mobility - Moved from abroad (%)
Geographical mobility - Moved from abroad (%) - White
Geographical mobility - Moved from abroad (%) - Black or African American
Geographical mobility - Moved from abroad (%) - Asian
Geographical mobility - Moved from abroad (%) - Hispanic or Latino
Geographical mobility - Moved from abroad (%) - American Indian and Alaska Native
Geographical mobility - Moved from abroad (%) - Multirace
Geographical mobility - Moved from abroad (%) - Other Race
Place of birth for the foreign-born population - Ireland (%)
Place of birth for the foreign-born population - Denmark (%)
Place of birth for the foreign-born population - Norway (%)
Place of birth for the foreign-born population - Sweden (%)
Place of birth for the foreign-born population - United Kingdom (%)
Place of birth for the foreign-born population - England (%)
Place of birth for the foreign-born population - Scotland (%)
Place of birth for the foreign-born population - Other Northern Europe (%)
Place of birth for the foreign-born population - Austria (%)
Place of birth for the foreign-born population - Belgium (%)
Place of birth for the foreign-born population - France (%)
Place of birth for the foreign-born population - Germany (%)
Place of birth for the foreign-born population - Netherlands (%)
Place of birth for the foreign-born population - Switzerland (%)
Place of birth for the foreign-born population - Other Western Europe (%)
Place of birth for the foreign-born population - Greece (%)
Place of birth for the foreign-born population - Italy (%)
Place of birth for the foreign-born population - Portugal (%)
Place of birth for the foreign-born population - Spain (%)
Place of birth for the foreign-born population - Other Southern Europe (%)
Place of birth for the foreign-born population - Albania (%)
Place of birth for the foreign-born population - Belarus (%)
Place of birth for the foreign-born population - Bosnia and Herzegovina (%)
Place of birth for the foreign-born population - Bulgaria (%)
Place of birth for the foreign-born population - Croatia (%)
Place of birth for the foreign-born population - Czechoslovakia (%)
Place of birth for the foreign-born population - Hungary (%)
Place of birth for the foreign-born population - Latvia (%)
Place of birth for the foreign-born population - Lithuania (%)
Place of birth for the foreign-born population - North Macedonia (Macedonia) (%)
Place of birth for the foreign-born population - Moldova (%)
Place of birth for the foreign-born population - Poland (%)
Place of birth for the foreign-born population - Romania (%)
Place of birth for the foreign-born population - Russia (%)
Place of birth for the foreign-born population - Serbia (%)
Place of birth for the foreign-born population - Ukraine (%)
Place of birth for the foreign-born population - Other Eastern Europe (%)
Place of birth for the foreign-born population - China (%)
Place of birth for the foreign-born population - Hong Kong (%)
Place of birth for the foreign-born population - Taiwan (%)
Place of birth for the foreign-born population - Japan (%)
Place of birth for the foreign-born population - Korea (%)
Place of birth for the foreign-born population - Other Eastern Asia (%)
Place of birth for the foreign-born population - Afghanistan (%)
Place of birth for the foreign-born population - Bangladesh (%)
Place of birth for the foreign-born population - India (%)
Place of birth for the foreign-born population - Iran (%)
Place of birth for the foreign-born population - Kazakhstan (%)
Place of birth for the foreign-born population - Nepal (%)
Place of birth for the foreign-born population - Pakistan (%)
Place of birth for the foreign-born population - Sri Lanka (%)
Place of birth for the foreign-born population - Uzbekistan (%)
Place of birth for the foreign-born population - Other South Central Asia (%)
Place of birth for the foreign-born population - Burma (%)
Place of birth for the foreign-born population - Cambodia (%)
Place of birth for the foreign-born population - Indonesia (%)
Place of birth for the foreign-born population - Laos (%)
Place of birth for the foreign-born population - Malaysia (%)
Place of birth for the foreign-born population - Philippines (%)
Place of birth for the foreign-born population - Singapore (%)
Place of birth for the foreign-born population - Thailand (%)
Place of birth for the foreign-born population - Vietnam (%)
Place of birth for the foreign-born population - Other South Eastern Asia (%)
Place of birth for the foreign-born population - Armenia (%)
Place of birth for the foreign-born population - Iraq (%)
Place of birth for the foreign-born population - Israel (%)
Place of birth for the foreign-born population - Jordan (%)
Place of birth for the foreign-born population - Kuwait (%)
Place of birth for the foreign-born population - Lebanon (%)
Place of birth for the foreign-born population - Saudi Arabia (%)
Place of birth for the foreign-born population - Syria (%)
Place of birth for the foreign-born population - Turkey (%)
Place of birth for the foreign-born population - Yemen (%)
Place of birth for the foreign-born population - Other Western Asia (%)
Place of birth for the foreign-born population - Eritrea (%)
Place of birth for the foreign-born population - Ethiopia (%)
Place of birth for the foreign-born population - Kenya (%)
Place of birth for the foreign-born population - Somalia (%)
Place of birth for the foreign-born population - Uganda (%)
Place of birth for the foreign-born population - Zimbabwe (%)
Place of birth for the foreign-born population - Other Eastern Africa (%)
Place of birth for the foreign-born population - Cameroon (%)
Place of birth for the foreign-born population - Congo (%)
Place of birth for the foreign-born population - Democratic Republic of Congo (Zaire) (%)
Place of birth for the foreign-born population - Other Middle Africa (%)
Place of birth for the foreign-born population - Egypt (%)
Place of birth for the foreign-born population - Morocco (%)
Place of birth for the foreign-born population - Sudan (%)
Place of birth for the foreign-born population - Other Northern Africa (%)
Place of birth for the foreign-born population - South Africa (%)
Place of birth for the foreign-born population - Other Southern Africa (%)
Place of birth for the foreign-born population - Cabo Verde (%)
Place of birth for the foreign-born population - Ghana (%)
Place of birth for the foreign-born population - Liberia (%)
Place of birth for the foreign-born population - Nigeria (%)
Place of birth for the foreign-born population - Senegal (%)
Place of birth for the foreign-born population - Sierra Leone (%)
Place of birth for the foreign-born population - Other Western Africa (%)
Place of birth for the foreign-born population - Australia (%)
Place of birth for the foreign-born population - New Zealand (%)
Place of birth for the foreign-born population - Fiji (%)
Place of birth for the foreign-born population - Micronesia (%)
Place of birth for the foreign-born population - Bahamas (%)
Place of birth for the foreign-born population - Barbados (%)
Place of birth for the foreign-born population - Cuba (%)
Place of birth for the foreign-born population - Dominica (%)
Place of birth for the foreign-born population - Dominican Republic (%)
Place of birth for the foreign-born population - Grenada (%)
Place of birth for the foreign-born population - Haiti (%)
Place of birth for the foreign-born population - Jamaica (%)
Place of birth for the foreign-born population - St. Vincent and the Grenadines (%)
Place of birth for the foreign-born population - Trinidad and Tobago (%)
Place of birth for the foreign-born population - West Indies (%)
Place of birth for the foreign-born population - Other Caribbean (%)
Place of birth for the foreign-born population - Belize (%)
Place of birth for the foreign-born population - Costa Rica (%)
Place of birth for the foreign-born population - El Salvador (%)
Place of birth for the foreign-born population - Guatemala (%)
Place of birth for the foreign-born population - Honduras (%)
Place of birth for the foreign-born population - Mexico (%)
Place of birth for the foreign-born population - Nicaragua (%)
Place of birth for the foreign-born population - Panama (%)
Place of birth for the foreign-born population - Other Central America (%)
Place of birth for the foreign-born population - Argentina (%)
Place of birth for the foreign-born population - Bolivia (%)
Place of birth for the foreign-born population - Brazil (%)
Place of birth for the foreign-born population - Chile (%)
Place of birth for the foreign-born population - Colombia (%)
Place of birth for the foreign-born population - Ecuador (%)
Place of birth for the foreign-born population - Guyana (%)
Place of birth for the foreign-born population - Peru (%)
Place of birth for the foreign-born population - Uruguay (%)
Place of birth for the foreign-born population - Venezuela (%)
Place of birth for the foreign-born population - Other South America (%)
Place of birth for the foreign-born population - Canada (%)
Place of birth for the foreign-born population - Other Northern America (%)
Place of birth for the foreign-born population - Other (%)
Latest news about races in Fitchburg, MA collected exclusively by city-data.com from local newspapers, TV, and radio stations
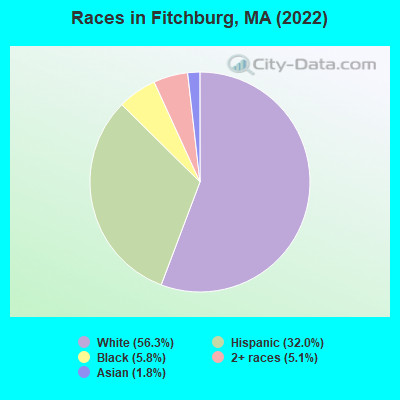
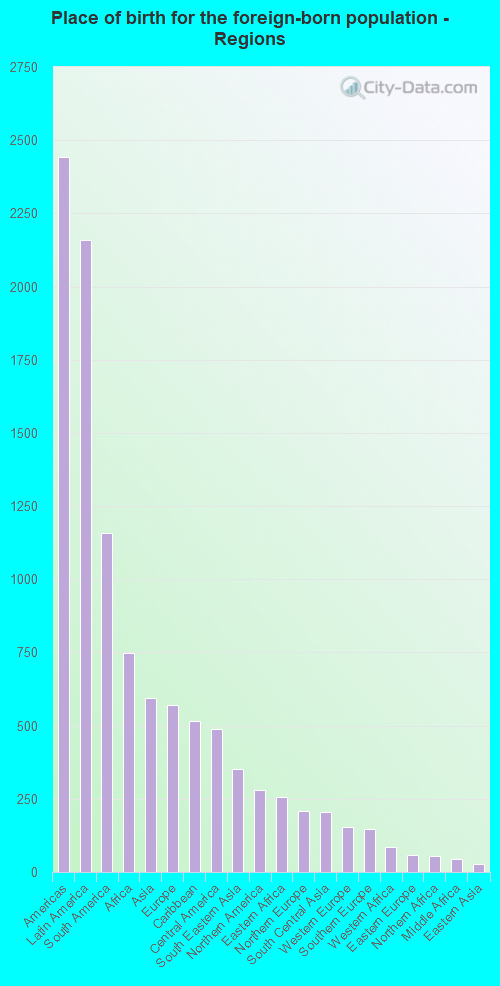
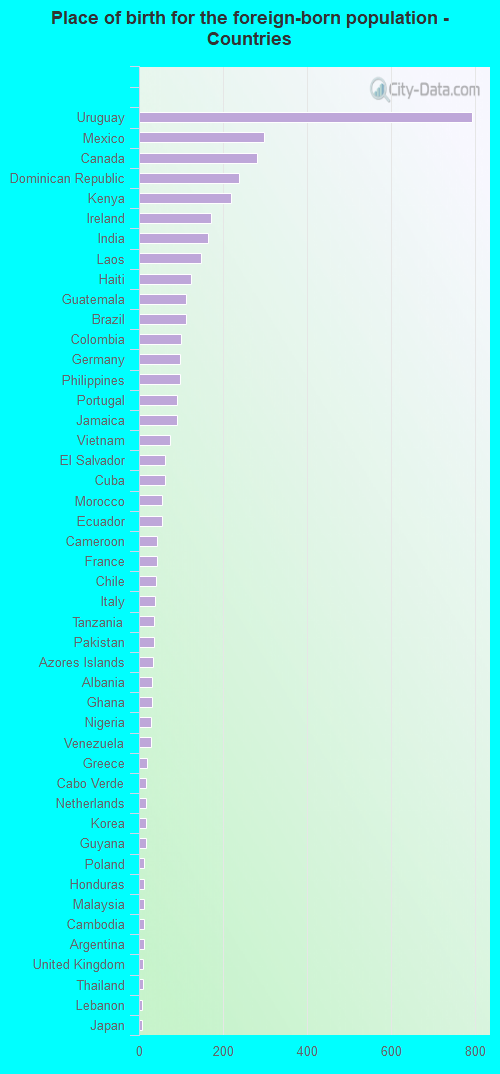
According to 2022 data, the most numerous races in Fitchburg, MA are White alone (23,563 residents), Hispanic (13,392 residents), and Asian alone (756 residents). 70.7% of Fitchburg residents speak English at home. 10.4% of Fitchburg, MA residents are foreign-born (5.1% born in Latin America, 1.8% born in Africa, 1.4% born in Asia, 1.3% born in Europe), which is 72.6% less than the foreign-born rate of 18.0% across the entire state of Massachusetts.
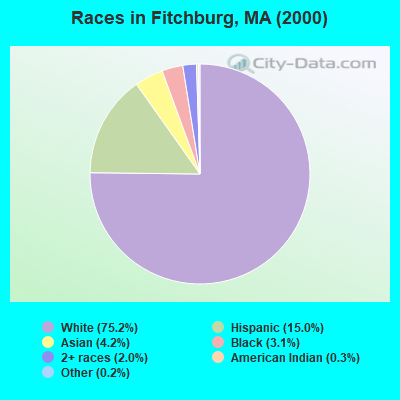
Race distribution in Fitchburg
2000 2022
5,198,359 81.9% White alone 428,729 6.8% Hispanic 318,329 5.0% Black alone 236,786 3.7% Asian alone 110,338 1.7% Two or more races 43,586 0.7% Other race alone 11,264 0.2% American Indian alone 1,706 0.03% Native Hawaiian and Other
4,676,627 67.0% White alone 911,038 13.0% Hispanic 501,463 7.2% Asian alone 459,740 6.6% Black alone 341,889 4.9% Two or more races 84,403 1.2% Other race alone 5,838 0.08% American Indian alone 976 0.01% Native Hawaiian and Other
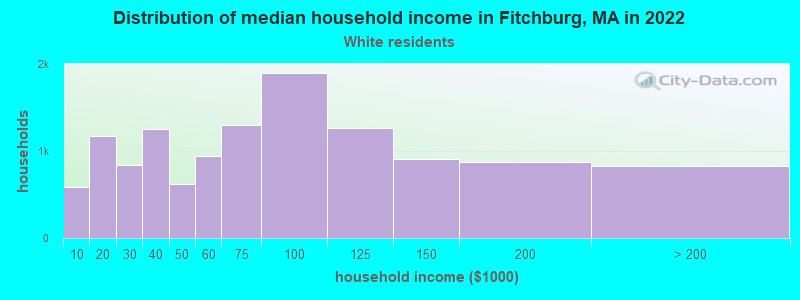
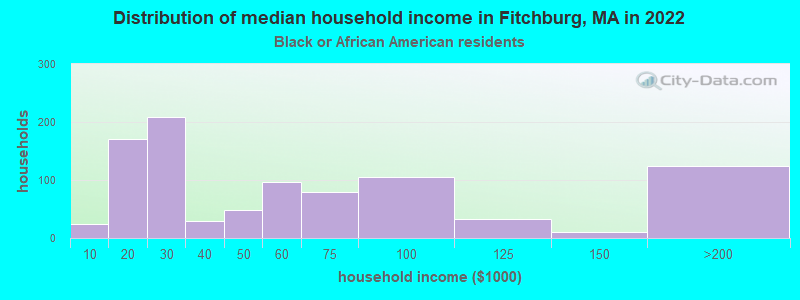
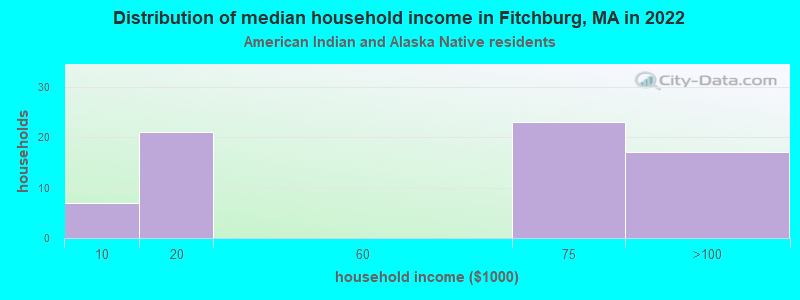
Income and house value in Fitchburg Median household income in 2022 $67,051 White non-Hispanic householders$43,431 Black householders$129,497 Asian householders$44,131 Some other race householders$57,040 Two or more races householders$59,174 Hispanic or Latino race householdersMedian 2022 house value $297,288 White Non-Hispanic householders$250,029 Black or African American householders$250,821 American Indian or Alaska Native householders $298,609 Asian householders$276,431 Some other race householders$270,886 Two or more races householders$301,777 Hispanic or Latino householders
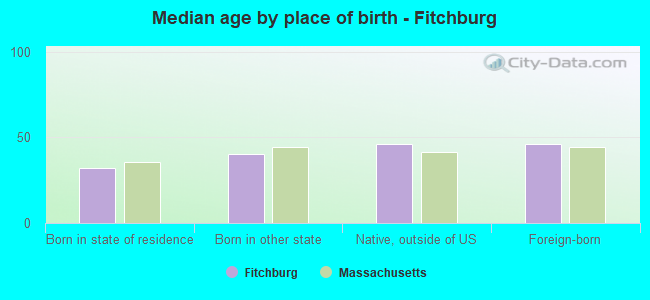
Median age by race in Fitchburg
43.2 Median age for White residents44.9 42.4 26.9 Median age for Black or African American residents26.0 30.6 46.0 Median age for American Indian / Alaska Native residents45.6 51.4 32.4 Median age for Asian residents32.3 31.7 -601,918,464.6 Median age for Native Hawaiian / Pacific Islander residents-513,131,312.6 -508,717,948.2 34.7 Median age for Other race residents35.8 33.5 27.9 Median age for Two or more races residents30.1 27.3 47.3 Median age for White alone residents46.9 48.3 28.4 Median age for Hispanic or Latino residents31.5 24.6
Owner/renter occupied households by race in Fitchburg
House owners and renters - White residents 7,608 60.8% Owner occupied4,915 39.2% Renter occupiedHouse owners and renters - Black or African American residents 242 25.3% Owner occupied714 74.7% Renter occupiedHouse owners and renters - American Indian / Alaska Native residents 24 32.8% Owner occupied48 67.2% Renter occupiedHouse owners and renters - Asian residents 94 41.6% Owner occupied132 58.4% Renter occupiedHouse owners and renters - Other race residents 317 29.7% Owner occupied750 70.3% Renter occupiedHouse owners and renters - Two or more races residents 1,030 37.1% Owner occupied1,748 62.9% Renter occupiedHouse owners and renters - White alone residents 7,224 63.8% Owner occupied4,094 36.2% Renter occupiedHouse owners and renters - Hispanic or Latino residents 1,257 29.9% Owner occupied2,941 70.1% Renter occupied
Language usage in Fitchburg
English speakers - Total 70.7% of residents of Fitchburg speak English at home.
22.7% of residents speak Spanish at home 5,308 59.2% Speak English very well3,657 40.8% Speak English less than very well6.6% of residents speak other language at home 1,704 65.2% Speak English very well908 34.8% Speak English less than very well
English speakers - Born in the United States 85.5% of residents of Fitchburg speak English at home.
11.2% of residents speak Spanish at home 316 44.3% Speak English very well398 55.7% Speak English less than very well4.4% of residents speak other language at home 245 87.5% Speak English very well35 12.5% Speak English less than very well
English speakers - Native, born elsewhere 10.7% of residents of Fitchburg speak English at home.
84.9% of residents speak Spanish at home 1,695 49.4% Speak English very well1,738 50.6% Speak English less than very well2.5% of residents speak other language at home 103 100.0% Speak English very well
English speakers - Foreign-born 17.8% of residents of Fitchburg speak English at home.
44.8% of residents speak Spanish at home 783 39.6% Speak English very well1,194 60.4% Speak English less than very well39.3% of residents speak other language at home 931 53.7% Speak English very well803 46.3% Speak English less than very well
White (Caucasian) - Speak only English Native:
88.0% (22,324)Foreign-born:
31.9% (356)
White (Caucasian) - Speak another language Native:
9.9% (2,519)Foreign-born:
66.9% (746)
Black or African American - Speak only English Native:
70.9% (1,320)Foreign-born:
24.2% (218)
Black or African American - Speak another language Native:
29.8% (556)Foreign-born:
76.2% (688)
Asian - Speak only English Native:
38.8% (127)Foreign-born:
5.2% (22)
Asian - Speak another language Native:
61.4% (201)Foreign-born:
96.0% (410)
Other race - Speak only English Native:
27.4% (619)Foreign-born:
16.2% (129)
Other race - Speak another language Native:
72.7% (1,639)Foreign-born:
85.7% (680)
Two or more races - Speak only English Native:
51.0% (3,187)Foreign-born:
5.3% (82)
Two or more races - Speak another language Native:
50.1% (3,133)Foreign-born:
95.1% (1,458)
White alone - Speak only English Native:
96.2% (21,281)Foreign-born:
43.4% (362)
White alone - Speak another language Native:
3.8% (831)Foreign-born:
51.7% (431)
Hispanic or Latino - Speak only English Native:
31.5% (3,092)Foreign-born:
5.3% (115)
Hispanic or Latino - Speak another language Native:
68.6% (6,735)Foreign-born:
94.2% (2,034)
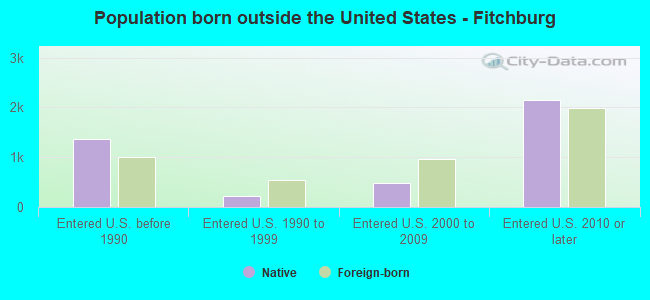
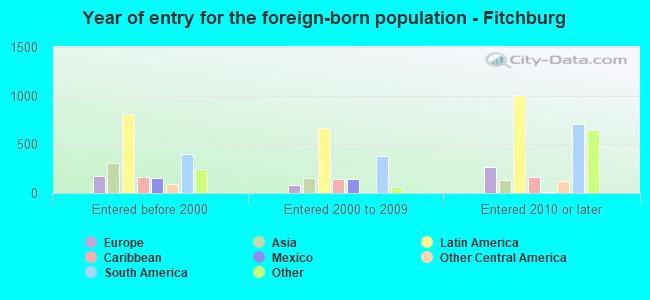
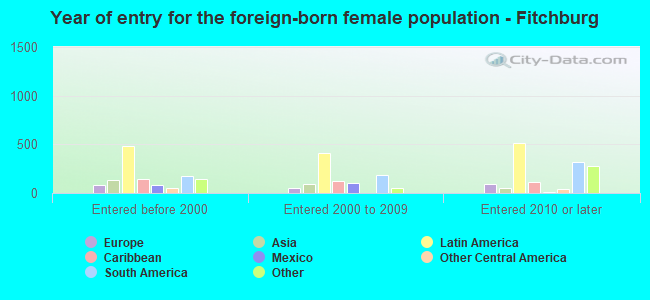
Foreign-born residents in Fitchburg 4,362 residents are foreign born (5.1% Latin America , 1.8% Africa , 1.4% Asia , 1.3% Europe ).
This city:
10.4%Massachusetts:
17.6%
Marital status for residents in Fitchburg Marital status - White (Caucasian) population 15 years and over
Males 41.4% Never married40.3% Now married1.4% Separated3.5% Widowed13.5% DivorcedFemales 34.1% Never married37.8% Now married1.6% Separated10.9% Widowed15.6% DivorcedWomen who gave birth in the past 12 months Now married:
10.9% (41)Unmarried:
89.1% (333)
Women who did not give birth in the past 12 months Now married:
34.4% (1,951)Unmarried:
65.6% (3,722)
Marital status - Black or African American population 15 years and over
Males 58.9% Never married35.9% Now married2.2% Separated2.9% Widowed0.0% DivorcedFemales 55.5% Never married22.8% Now married0.0% Separated8.5% Widowed13.2% DivorcedWomen who gave birth in the past 12 months Now married:
82.8% (49)Unmarried:
17.2% (10)
Women who did not give birth in the past 12 months Now married:
20.4% (174)Unmarried:
79.6% (678)
Marital status - American Indian / Alaska Native population 15 years and over
Males 47.5% Never married0.0% Now married0.0% Separated0.0% Widowed52.5% DivorcedFemales 64.9% Never married21.6% Now married0.0% Separated13.5% Widowed0.0% DivorcedWomen who did not give birth in the past 12 months Now married:
0.0% (0)Unmarried:
100.0% (21)
Marital status - Asian population 15 years and over
Males 39.1% Never married51.9% Now married0.0% Separated0.0% Widowed9.0% DivorcedFemales 34.8% Never married56.4% Now married2.5% Separated2.5% Widowed3.8% DivorcedWomen who did not give birth in the past 12 months Now married:
48.1% (130)Unmarried:
51.9% (141)
Marital status - Other race population 15 years and over
Males 58.1% Never married35.4% Now married0.3% Separated3.4% Widowed2.8% DivorcedFemales 33.3% Never married33.9% Now married6.7% Separated8.8% Widowed17.3% DivorcedWomen who did not give birth in the past 12 months Now married:
55.5% (384)Unmarried:
44.5% (308)
Marital status - Two or more races population 15 years and over
Males 47.9% Never married34.3% Now married2.9% Separated0.0% Widowed14.8% DivorcedFemales 42.6% Never married35.7% Now married6.2% Separated6.8% Widowed8.7% DivorcedWomen who gave birth in the past 12 months Now married:
83.5% (108)Unmarried:
16.5% (21)
Women who did not give birth in the past 12 months Now married:
36.1% (729)Unmarried:
63.9% (1,293)
Marital status - White alone, not Hispanic / Latino population 15 years and over
Males 40.3% Never married40.8% Now married0.6% Separated3.4% Widowed14.8% DivorcedFemales 30.7% Never married39.7% Now married1.6% Separated11.7% Widowed16.2% DivorcedWomen who gave birth in the past 12 months Now married:
10.9% (42)Unmarried:
89.1% (344)
Women who did not give birth in the past 12 months Now married:
37.2% (1,675)Unmarried:
62.8% (2,822)
Marital status - Hispanic or Latino population 15 years and over
Males 49.1% Never married36.3% Now married3.0% Separated2.4% Widowed9.2% DivorcedFemales 46.6% Never married31.4% Now married4.1% Separated7.6% Widowed10.2% DivorcedWomen who gave birth in the past 12 months Now married:
83.5% (83)Unmarried:
16.5% (16)
Women who did not give birth in the past 12 months Now married:
33.9% (1,162)Unmarried:
66.1% (2,267)
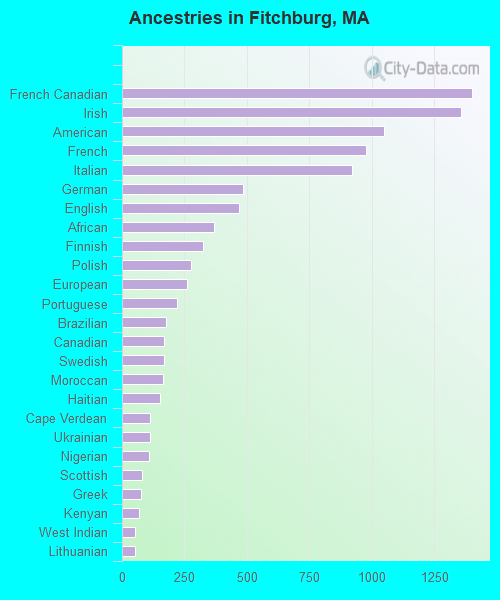
Ancestries in Fitchburg
1,400 7.2% French Canadian1,359 7.0% Irish1,048 5.4% American979 5.0% French922 4.7% Italian485 2.5% German468 2.4% English369 1.9% African323 1.7% Finnish278 1.4% Polish261 1.3% European220 1.1% Portuguese176 0.9% Brazilian169 0.9% Canadian167 0.9% Swedish163 0.8% Moroccan153 0.8% Haitian114 0.6% Cape Verdean112 0.6% Ukrainian107 0.5% Nigerian80 0.4% Scottish75 0.4% Greek70 0.4% Kenyan52 0.3% West Indian52 0.3% Lithuanian44 0.2% Jamaican32 0.2% Albanian29 0.1% Armenian25 0.1% Scotch-Irish17 0.09% Celtic16 0.08% Norwegian15 0.08% Hungarian12 0.06% Northern European11 0.06% British9 0.05% Lebanese8 0.04% Ghanaian7 0.04% Russian6 0.03% Australian5 0.03% Bulgarian
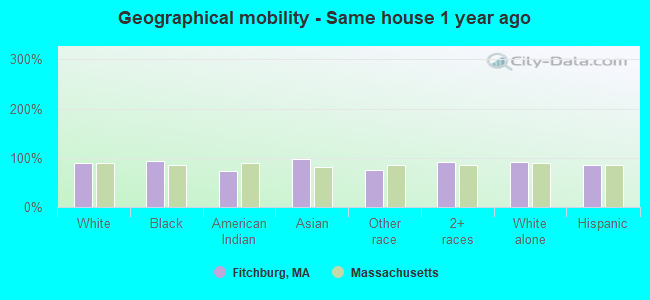
Geographical mobility in Fitchburg Same house 1 year ago 24,264 89.5% White (Caucasian)2,815 92.9% Black or African American103 73.9% American Indian / Alaska Native742 97.2% Asian2,449 74.6% Other race8,155 92.4% Two or more races21,407 91.3% White alone, not Hispanic / Latino11,133 84.8% Hispanic or LatinoMoved within same county 1,779 6.6% White / Caucasian66 2.2% Black or African American5 3.8% American Indian / Alaska Native6 0.8% Asian410 12.5% Other race272 3.1% Two or more races1,135 4.8% White alone, not Hispanic / Latino1,304 9.9% Hispanic or LatinoMoved within same state 492 1.8% White / Caucasian174 5.7% Black or African American40 29.0% American Indian / Alaska Native2 0.3% Asian103 3.1% Other race129 1.5% Two or more races496 2.1% White alone, not Hispanic / Latino300 2.3% Hispanic or LatinoMoved from different state 305 1.1% White / Caucasian8 0.3% Black or African American41 5.3% Asian55 1.7% Other race47 0.5% Two or more races317 1.4% White alone, not Hispanic / Latino111 0.8% Hispanic or LatinoMoved from abroad 175 0.6% White43 1.4% Black or African American50 1.5% Other race105 1.2% Two or more races60 0.3% White alone, not Hispanic / Latino290 2.2% Hispanic or Latino
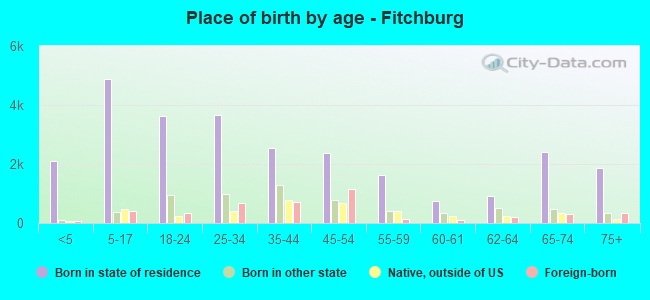
Children Nativity (place of birth) in Fitchburg
Children under 6 years - Living with two parents Both parents native 789 100.0% NativeBoth parents foreign-born 325 100.0% NativeOne native, one foreign-born parent 69 100.0% NativeChildren under 6 years - Living with one parent Native parent 1,186 100.0% NativeForeign-born parent 104 100.0% NativeChildren 6 to 17 years - Living with two parents Both parents native 1,992 99.5% Native11 0.5% Foreign-bornBoth parents foreign-born 377 53.0% Native334 47.0% Foreign-bornOne native, one foreign-born parent 197 95.5% Native9 4.5% Foreign-bornChildren 6 to 17 years - Living with one parent Native parent 2,166 100.0% NativeForeign-born parent 191 54.1% Native162 45.9% Foreign-born
Grandparents responsible for own grandchildren in Fitchburg
Grandparents (30 to 59 years) White / Caucasian 14 19.2% Responsible for grandchildren59 80.8% Not responsible for grandchildrenBlack or African American 18 74.4% Responsible for grandchildren6 25.6% Not responsible for grandchildrenOther race 45 100.0% Not responsible for grandchildrenTwo or more races 418 100.0% Not responsible for grandchildrenWhite alone, not Hispanic / Latino 6 9.4% Responsible for grandchildren57 90.6% Not responsible for grandchildrenHispanic or Latino 6 1.3% Responsible for grandchildren464 98.7% Not responsible for grandchildrenGrandparents (60 years and over) White / Caucasian 90 42.0% Responsible for grandchildren124 58.0% Not responsible for grandchildrenBlack or African American 25 100.0% Not responsible for grandchildrenOther race 35 30.3% Responsible for grandchildren81 69.7% Not responsible for grandchildrenTwo or more races 15 56.7% Responsible for grandchildren12 43.3% Not responsible for grandchildrenWhite alone, not Hispanic / Latino 48 35.7% Responsible for grandchildren87 64.3% Not responsible for grandchildrenHispanic or Latino 110 43.3% Responsible for grandchildren144 56.7% Not responsible for grandchildren