Easton, MA (Massachusetts) Houses and Residents
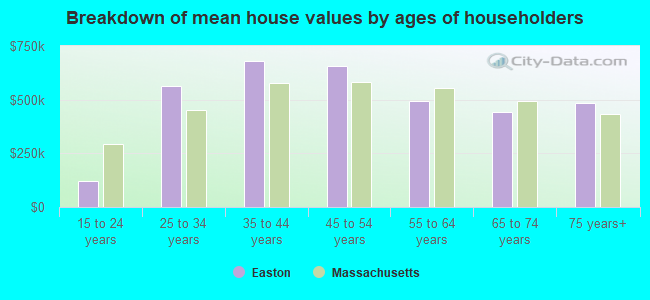
| Easton: | $602,627 |
| Massachusetts: | $534,700 |
Total population: 23,112 (Urban population: 20,199, Rural population: 2,100 (all nonfarm))
Houses: 7,631 (7,489 occupied: 6,122 owner occupied, 1,367 renter occupied)
| % of renters here: | 18% |
| State: | 38% |
Housing density: 268 houses/condos per square mile
Median price asked for vacant for-sale houses and condos in 2022 in this county: $509,684.
Median contract rent in 2022: $1,628 (lower quartile is $1,174, upper quartile is over $2,000)
Median rent asked for vacant for-rent units in 2022: $1,898
Median gross rent in Easton, MA in 2022: $1,794
Housing units in Easton with a mortgage: 4,241 (470 second mortgage, 576 home equity loan, 26 both second mortgage and home equity loan)
Houses without a mortgage: 937
Compare current foreclosures near Easton, MA:
| Photo | Address | Area | Beds / Baths | Price | Details |
|---|---|---|---|---|---|

|
#1
Tall Oaks Dr Unit 508
South Weymouth, MA 02190
|
1,300 sq. feet
|
2 baths 2 beds |
$285,000
|
show details |

|
#2
Johnson Rd
North Weymouth, MA 02191
|
748 sq. feet
|
1 baths 2 beds |
$365,000
|
show details |

|
#3
Prospect St
Norwell, MA 02061
|
5,483 sq. feet
|
5 baths 5 beds |
$1,800,000
|
show details |

|
#4
Somerset Ave
Taunton, MA 02780
|
3,196 sq. feet
|
3 baths 4 beds |
$754,900
|
show details |

|
#5
Loomis St
North Attleboro, MA 02760
|
2,294 sq. feet
|
2 baths 4 beds |
$700,000
|
show details |

|
#6
Cook Rd
Cumberland, RI 02864
|
2,050 sq. feet
|
2 baths 4 beds |
$724,900
|
show details |

|
#7
County St
East Taunton, MA 02718
|
1,157 sq. feet
|
1 baths 1 beds |
$219,900
|
show details |

|
#8
Bittersweet Ln
Randolph, MA 02368
|
882 sq. feet
|
1 baths 2 beds |
show details | |

|
#9
Kendrick Ave Apt 307
Quincy, MA 02169
|
1,234 sq. feet
|
2 baths 2 beds |
show details | |

|
#10
Emily Jeffers Rd # L
Randolph, MA 02368
|
1,350 sq. feet
|
1 baths 3 beds |
show details |
| Photo | Address | Area | Beds / Baths | Price | Details |
|---|---|---|---|---|---|

|
#11
Berkshire Ave
Sharon, MA 02067
|
1,289 sq. feet
|
2 baths 3 beds |
show details | |

|
#12
Richmond St
Boston, MA 02124
|
2,516 sq. feet
|
2 baths 4 beds |
show details | |

|
#13
Neponset St
Canton, MA 02021
|
1,053 sq. feet
|
1 baths 2 beds |
show details | |

|
#14
Ballou St
Quincy, MA 02169
|
1,758 sq. feet
|
1 baths 3 beds |
show details | |

|
#15
N Main St
Middleboro, MA 02346
|
1,898 sq. feet
|
2 baths 4 beds |
show details | |

|
#16
Hubbard Rd
East Bridgewater, MA 02333
|
1,344 sq. feet
|
2 baths 4 beds |
show details | |

|
#17
S Franklin St
Holbrook, MA 02343
|
940 sq. feet
|
2 baths 2 beds |
show details | |

|
#18
Vera Dr
Bridgewater, MA 02324
|
1,836 sq. feet
|
2 baths 3 beds |
show details | |

|
#19
Tremont St
Brockton, MA 02301
|
1,470 sq. feet
|
2 baths 4 beds |
show details | |

|
#20
Powhattan Dr
East Taunton, MA 02718
|
1,632 sq. feet
|
1 baths 3 beds |
show details |
| Photo | Address | Area | Beds / Baths | Price | Details |
|---|---|---|---|---|---|

|
#21
Congress Pl
Dedham, MA 02026
|
1,966 sq. feet
|
2 baths 4 beds |
show details | |

|
#22
Dwinell Rd
Taunton, MA 02780
|
1,632 sq. feet
|
2 baths 4 beds |
show details | |

|
#23
Pond St
East Bridgewater, MA 02333
|
864 sq. feet
|
1 baths 2 beds |
show details | |

|
#24
Rockland St
Abington, MA 02351
|
1,700 sq. feet
|
1 baths 4 beds |
show details | |

|
#25
Cappys Way
Brockton, MA 02302
|
2,128 sq. feet
|
2 baths 4 beds |
show details | |

|
#26
Great Cedar Dr # 4
Hanson, MA 02341
|
- sq. feet
|
1 baths 2 beds |
show details | |

|
#27
Brahms St
Roslindale, MA 02131
|
1,604 sq. feet
|
1 baths 4 beds |
show details | |

|
#28
Melville Ct
Brockton, MA 02301
|
1,140 sq. feet
|
2 baths 3 beds |
show details | |

|
#29
Winter St
Hanson, MA 02341
|
1,844 sq. feet
|
3 baths 3 beds |
show details | |

|
#30
Pridemark Ln
Attleboro, MA 02703
|
1,340 sq. feet
|
1 baths 2 beds |
show details |
| Photo | Address | Area | Beds / Baths | Price | Details |
|---|---|---|---|---|---|

|
#31
Ashland St
Taunton, MA 02780
|
1,680 sq. feet
|
2 baths 4 beds |
show details | |

|
#32
Woodland Ave
Seekonk, MA 02771
|
4,611 sq. feet
|
4 baths 4 beds |
show details | |

|
#33
Webster St
Randolph, MA 02368
|
1,080 sq. feet
|
1 baths 3 beds |
show details | |

|
#34
Belvoir Rd
Milton, MA 02186
|
2,528 sq. feet
|
2 baths 4 beds |
show details | |

|
#35
Rockwell Ave
Brockton, MA 02302
|
1,774 sq. feet
|
1 baths 3 beds |
show details | |

|
#36
Ridgehill Rd
Canton, MA 02021
|
1,196 sq. feet
|
1 baths 3 beds |
show details | |

|
#37
Partridge Dr
Westwood, MA 02090
|
4,487 sq. feet
|
4 baths 5 beds |
show details | |

|
#38
Copley Dr
Taunton, MA 02780
|
1,414 sq. feet
|
1 baths 3 beds |
show details | |

|
#39
Fulling Mill Ln
Hingham, MA 02043
|
2,384 sq. feet
|
2 baths 4 beds |
show details | |

|
#40
Granite Ln
South Easton, MA 02375
|
2,635 sq. feet
|
2 baths 4 beds |
show details |
| Photo | Address | Area | Beds / Baths | Price | Details |
|---|---|---|---|---|---|

|
#41
Plain St
Taunton, MA 02780
|
1,988 sq. feet
|
1 baths 3 beds |
show details | |

|
#42
Johnson St
West Roxbury, MA 02132
|
2,136 sq. feet
|
2 baths 3 beds |
show details | |

|
#43
West St
Attleboro, MA 02703
|
2,399 sq. feet
|
4 baths 6 beds |
show details | |

|
#44
Elizabeth St
Attleboro, MA 02703
|
3,436 sq. feet
|
3 baths 6 beds |
show details | |

|
#45
W Squantum St # 2
Quincy, MA 02171
|
3,952 sq. feet
|
4 baths 8 beds |
show details | |

|
#46
Brick Kiln Rd
North Attleboro, MA 02760
|
2,323 sq. feet
|
3 baths 4 beds |
show details | |

|
#47
Park St
Attleboro, MA 02703
|
1,202 sq. feet
|
1 baths 3 beds |
show details | |

|
#48
Thetford Ave
Braintree, MA 02184
|
3,638 sq. feet
|
2 baths 4 beds |
show details | |

|
#49
W Selden St
Mattapan, MA 02126
|
2,631 sq. feet
|
2 baths 6 beds |
show details | |

|
Check over 1 million property listings on Foreclosure.com!
|
browse all offers | |||
Latest news about housing in Easton, MA collected exclusively by city-data.com from local newspapers, TV, and radio stations


Household type by relationship:
Households: 532,417- In family households: 444,740 (93,440 male householders, 47,898 female householders)
101,208 spouses, 160,791 children (151,812 natural, 3,293 adopted, 5,686 stepchildren), 9,612 grandchildren, 4,550 brothers or sisters, 5,590 parents, foster children, 4,929 other relatives, 12,847 non-relatives
- In nonfamily households: 87,677 (32,955 male householders (25,495 living alone)), 38,717 female householders (32,941 living alone)), 16,005 nonrelatives
- In group quarters: 15,868 (6,219 institutionalized population)
88,038 married couples with children.
33,142 single-parent households (5,908 men, 27,234 women).
92.8% of residents of Easton speak English at home.
1.7% of residents speak Spanish at home (67% speak English very well, 17% speak English well, 15% speak English not well).
4.7% of residents speak other Indo-European language at home (74% speak English very well, 17% speak English well, 9% speak English not well).
0.6% of residents speak Asian or Pacific Island language at home (78% speak English very well, 22% speak English well).
0.2% of residents speak other language at home (50% speak English very well, 50% speak English well).
Foreign born population: 1,295 (5.4%)
(73.4% of them are naturalized citizens)
| Here: | 6.4 |
| State: | 6.5 |
| Here: | 4.4 |
| State: | 4.0 |
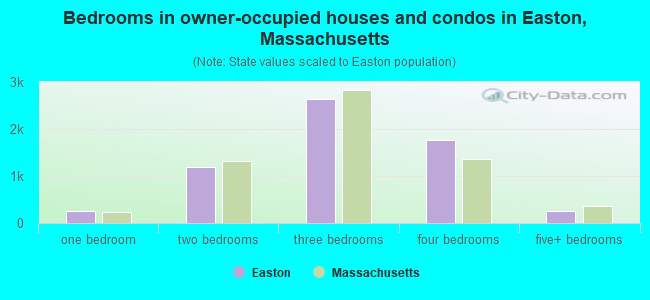
- Bedrooms in owner-occupied houses and condos in Easton, Massachusetts
- 0no bedroom
- 2641 bedroom
- 1,1962 bedrooms
- 2,6293 bedrooms
- 1,7734 bedrooms
- 2605+ bedrooms
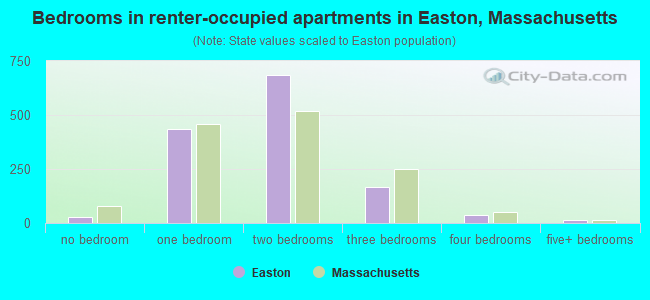
- Bedrooms in renter-occupied apartments in Easton, Massachusetts
- 28no bedroom
- 4351 bedroom
- 6862 bedrooms
- 1683 bedrooms
- 364 bedrooms
- 145+ bedrooms
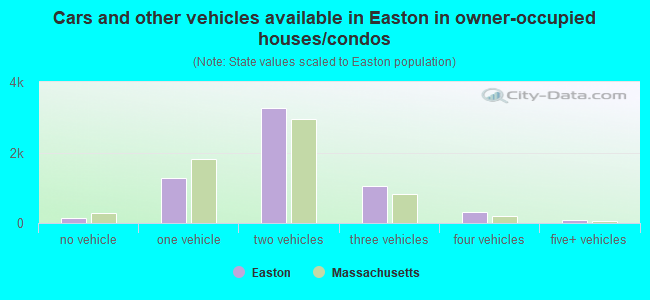
- Cars and other vehicles available in Easton in owner-occupied houses/condos
- 154no vehicle
- 1,2751 vehicle
- 3,2492 vehicles
- 1,0623 vehicles
- 3014 vehicles
- 815+ vehicles
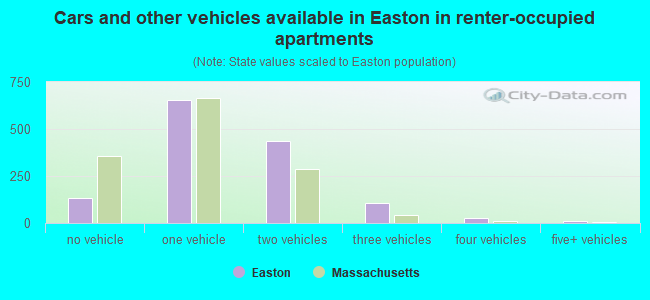
- Cars and other vehicles available in Easton in renter-occupied apartments
- 133no vehicle
- 6561 vehicle
- 4342 vehicles
- 1073 vehicles
- 254 vehicles
- 125+ vehicles
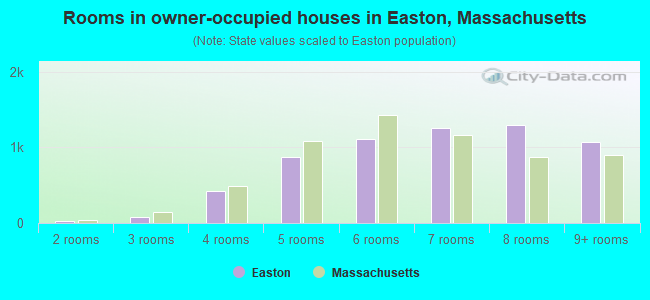
- Rooms in owner-occupied houses in Easton, Massachusetts
- 01 room
- 232 rooms
- 793 rooms
- 4214 rooms
- 8675 rooms
- 1,1146 rooms
- 1,2547 rooms
- 1,2978 rooms
- 1,0679+ rooms
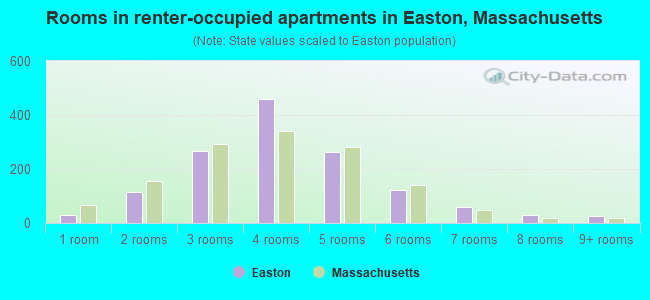
- Rooms in renter-occupied apartments in Easton, Massachusetts
- 281 room
- 1142 rooms
- 2653 rooms
- 4594 rooms
- 2635 rooms
- 1226 rooms
- 597 rooms
- 318 rooms
- 269+ rooms
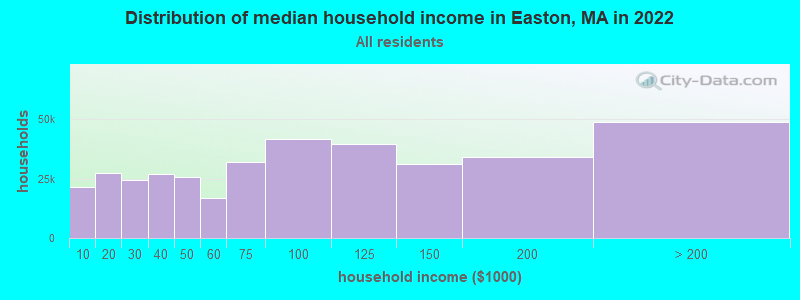
Easton, MA household income distribution

- 21,624Less than $10,000
- 27,176$10,000 to $19,999
- 24,454$20,000 to $29,999
- 27,142$30,000 to $39,999
- 25,530$40,000 to $49,999
- 16,938$50,000 to $59,999
- 31,922$60,000 to $74,999
- 41,768$75,000 to $99,999
- 39,640$100,000 to $124,999
- 31,355$125,000 to $149,999
- 34,287$150,000 to $199,999
- 48,865$200,000 or more
Percentage of workers working in this county: 32.1%
Number of people working at home: 1,641 (11.5% of all workers)
Travel time to work (commute)
- Less than 5 minutes: 425
- 5 to 9 minutes: 1,206
- 10 to 14 minutes: 1,627
- 15 to 19 minutes: 1,540
- 20 to 24 minutes: 1,452
- 25 to 29 minutes: 629
- 30 to 34 minutes: 1,458
- 35 to 39 minutes: 231
- 40 to 44 minutes: 415
- 45 to 59 minutes: 1,135
- 60 to 89 minutes: 1,335
- 90 or more minutes: 320
Means of transportation to work:
- Drove a car alone: 9,917 (81.1%)
- Carpooled: 817 (6.7%)
- Bus or trolley bus: 7 (0.1%)
- Subway or elevated: 60 (0.5%)
- Railroad: 399 (3.3%)
- Bicycle: 29 (0.2%)
- Walked: 463 (3.8%)
- Other means: 81 (0.7%)
- Worked at home: 453 (3.7%)
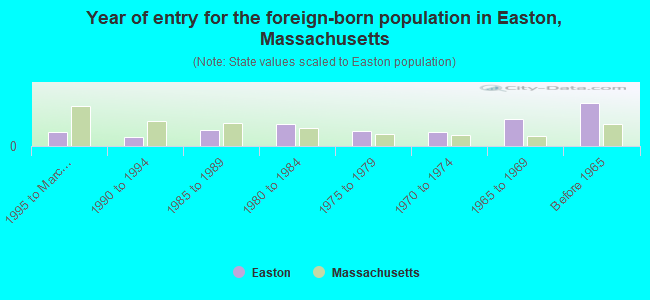
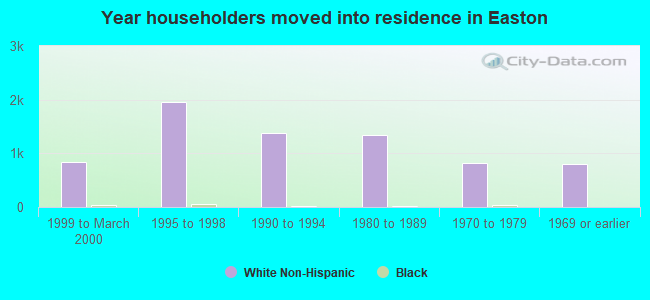
- Year of entry for the foreign-born population in Easton, Massachusetts
- 901995 to March 2000
- 601990 to 1994
- 1031985 to 1989
- 1381980 to 1984
- 981975 to 1979
- 901970 to 1974
- 1701965 to 1969
- 272Before 1965
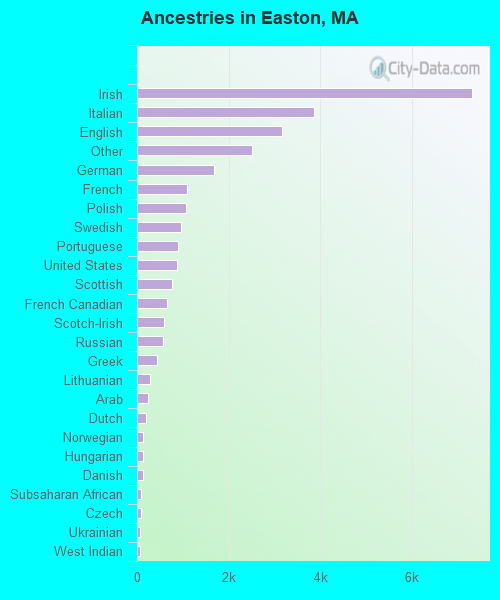
First ancestries reported:
- Irish: 7,322 (26.2%)
- Italian: 3,875 (13.8%)
- English: 3,160 (11.3%)
- Other: 2,518 (9.0%)
- German: 1,681 (6.0%)
- French: 1,082 (3.9%)
- Polish: 1,062 (3.8%)
- Swedish: 968 (3.5%)
- Portuguese: 904 (3.2%)
- United States: 871 (3.1%)
- Scottish: 772 (2.8%)
- French Canadian: 663 (2.4%)
- Scotch-Irish: 592 (2.1%)
- Russian: 561 (2.0%)
- Greek: 429 (1.5%)
- Lithuanian: 286 (1.0%)
- Arab: 237 (0.8%)
- Dutch: 206 (0.7%)
- Norwegian: 138 (0.5%)
- Hungarian: 132 (0.5%)
- Danish: 122 (0.4%)
- Subsaharan African: 92 (0.3%)
- Czech: 81 (0.3%)
- Ukrainian: 75 (0.3%)
- West Indian: 68 (0.2%)
- Swiss: 48 (0.2%)
- Welsh: 48 (0.2%)
Most common places of birth for foreign-born residents (%):
| Easton: | 12.4% (127) |
| Massachusetts: | 8.6% (66,627) |
| Easton: | 11.0% (112) |
| Massachusetts: | 5.2% (40,247) |
| Easton: | 7.9% (81) |
| Massachusetts: | 3.3% (25,403) |
| Easton: | 5.2% (53) |
| Massachusetts: | 2.3% (17,987) |
| Easton: | 5.1% (52) |
| Massachusetts: | 1.9% (14,883) |
| Easton: | 4.8% (49) |
| Massachusetts: | 1.7% (12,975) |
| Easton: | 4.8% (49) |
| Massachusetts: | 3.7% (28,319) |
| Easton: | 4.1% (42) |
| Massachusetts: | 1.7% (13,456) |
| Easton: | 3.9% (40) |
| Massachusetts: | 4.4% (33,862) |
| Easton: | 3.1% (32) |
| Massachusetts: | 4.7% (36,669) |
| Easton: | 2.9% (30) |
| Massachusetts: | 0.7% (5,693) |
| Easton: | 2.8% (29) |
| Massachusetts: | 0.4% (3,048) |
| Easton: | 2.6% (27) |
| Massachusetts: | 2.0% (15,286) |
| Easton: | 2.4% (25) |
| Massachusetts: | 3.6% (28,086) |
| Easton: | 2.3% (23) |
| Massachusetts: | 0.6% (4,578) |
| Easton: | 2.1% (21) |
| Massachusetts: | 1.8% (13,543) |
| Easton: | 1.9% (19) |
| Massachusetts: | 0.2% (1,710) |
| Easton: | 1.7% (17) |
| Massachusetts: | 2.3% (17,449) |
Place of birth for U.S.-born residents:
- This state: 17,142
- Other state: 3,988
- Northeast: 2,585
- Midwest: 541
- South: 704
- West: 158
61% of Easton residents lived in the same house 5 years ago.
Out of people who lived in different houses, 33% lived in this county.
Out of people who lived in different counties, 74% lived in Massachusetts.
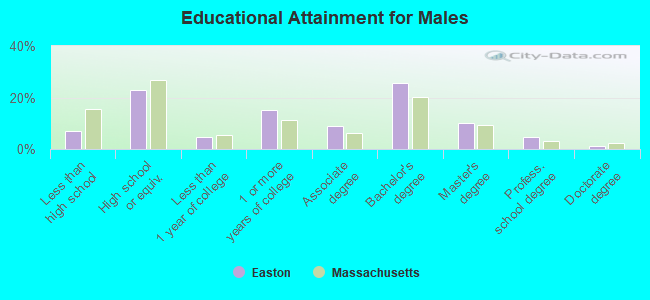
Education attainment for males 25 years and older:
- No schooling: 46
- Nursery to 4th grade: 0
- 5th and 6th grade: 14
- 7th and 8th grade: 59
- 9th grade: 77
- 10th grade: 84
- 11th grade: 51
- 12th grade, no diploma: 131
- High school graduate (or equivalency): 1,531
- Less than 1 year of college: 306
- Some college more than 1 year, no degree: 1,017
- Associate degree: 604
- Bachelor's degree: 1,701
- Master's degree: 669
- Professional school degree: 307
- Doctorate degree: 89
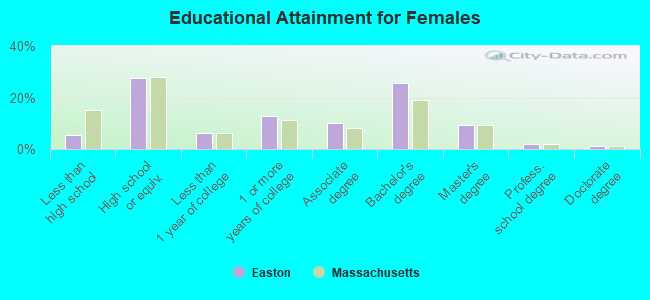
Education attainment for females 25 years and older:
- No schooling: 19
- Nursery to 4th grade: 12
- 5th and 6th grade: 20
- 7th and 8th grade: 97
- 9th grade: 41
- 10th grade: 65
- 11th grade: 53
- 12th grade, no diploma: 86
- High school graduate (or equivalency): 2,000
- Less than 1 year of college: 447
- Some college more than 1 year, no degree: 932
- Associate degree: 727
- Bachelor's degree: 1,860
- Master's degree: 669
- Professional school degree: 150
- Doctorate degree: 78
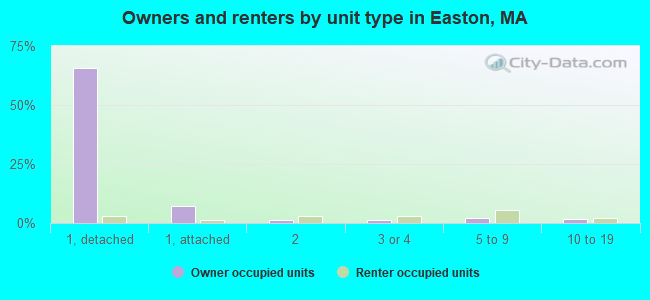
Housing units in structures:
- One, detached: 5,175
- One, attached: 664
- Two: 342
- 3 or 4: 358
- 5 to 9: 587
- 10 to 19: 268
- 20 to 49: 57
- 50 or more: 23
- Mobile homes: 157
Median worth of mobile homes: $213,551
Housing units lacking complete kitchen facilities: 0.1%
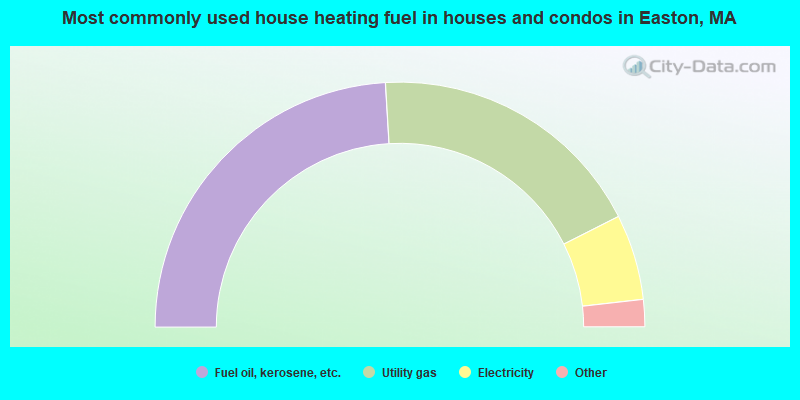
- 48.1%Fuel oil, kerosene, etc.
- 37.0%Utility gas
- 11.3%Electricity
- 2.8%Bottled, tank, or LP gas
- 0.5%Wood
- 0.1%Solar energy
- 0.1%Other fuel
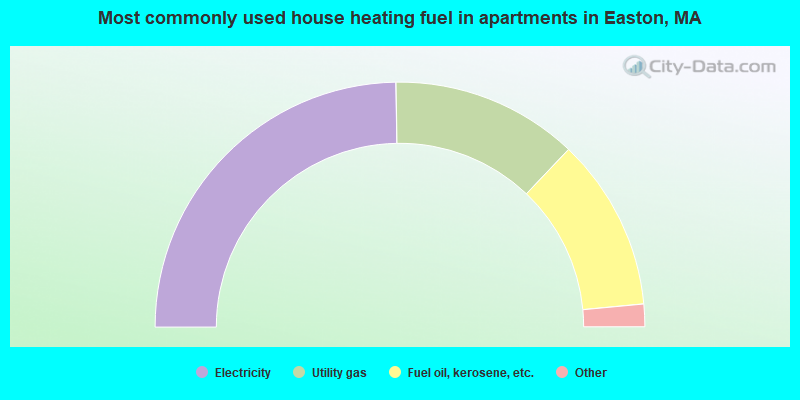
- 49.5%Electricity
- 24.7%Utility gas
- 22.8%Fuel oil, kerosene, etc.
- 2.0%Bottled, tank, or LP gas
- 0.7%Wood
- 0.4%Other fuel
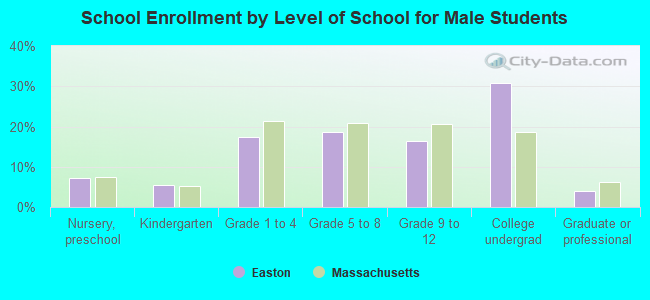
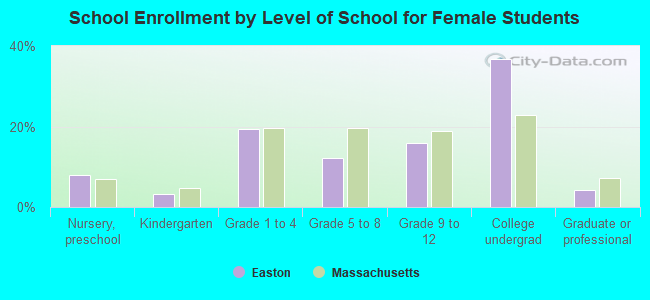
Private vs. public school enrollment:
| Here: | 6.6% |
| Massachusetts: | 10.8% |
| Here: | 10.9% |
| Massachusetts: | 12.2% |
| Here: | 78.7% |
| Massachusetts: | 48.2% |