Races in Easton, Massachusetts (MA) Detailed Stats
Ancestries, Foreign-born residents, place of birth

Recent posts about races in Easton, Massachusetts on our local forum with over 2,400,000 registered users:
 | Break-ins targeting South Asian families (58 replies) |
| Proposed new maps for Massachusetts House and Senate districts focus on strengthening minority communities (51 replies) |
| Please tell me about Easton and surrounding towns (34 replies) |
| New Job in EASTON (north) - where to live? (60 replies) |
| Brockton PS requesting National guard (125 replies) |
| Boston job possibility.. (142 replies) |
Latest news about races in Easton, MA collected exclusively by city-data.com from local newspapers, TV, and radio stations
4.6% of Easton, MA residents are foreign-born (2.2% born in Europe, 0.9% born in Asia, 0.7% born in Latin America, 0.5% born in North America), which is 293.1% less than the foreign-born rate of 18.0% across the entire state of Massachusetts.
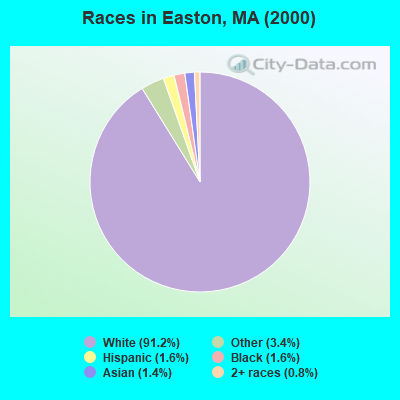
Race distribution in Easton

- 20,33591.2%White alone
- 7673.4%Other race alone
- 3521.6%Hispanic
- 3511.6%Black alone
- 3081.4%Asian alone
- 1750.8%Two or more races
- 90.04%American Indian alone
- 20.01%Native Hawaiian and Other
Pacific Islander alone
2000
2022
-
- 5,198,35981.9%White alone
- 428,7296.8%Hispanic
- 318,3295.0%Black alone
- 236,7863.7%Asian alone
- 110,3381.7%Two or more races
- 43,5860.7%Other race alone
- 11,2640.2%American Indian alone
- 1,7060.03%Native Hawaiian and Other
Pacific Islander alone

-
- 4,676,62767.0%White alone
- 911,03813.0%Hispanic
- 501,4637.2%Asian alone
- 459,7406.6%Black alone
- 341,8894.9%Two or more races
- 84,4031.2%Other race alone
- 5,8380.08%American Indian alone
- 9760.01%Native Hawaiian and Other
Pacific Islander alone

Income and house value in Easton
- Median household income in 2022
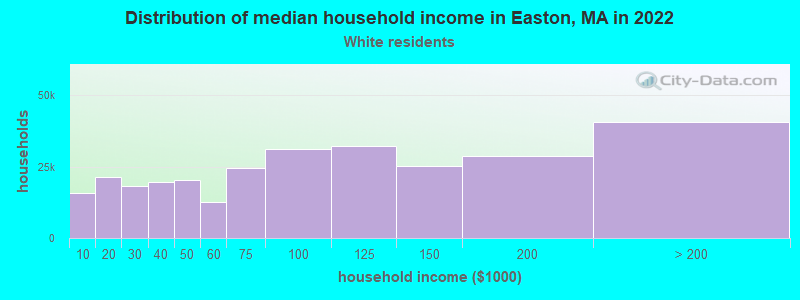
- $130,857White non-Hispanic householders
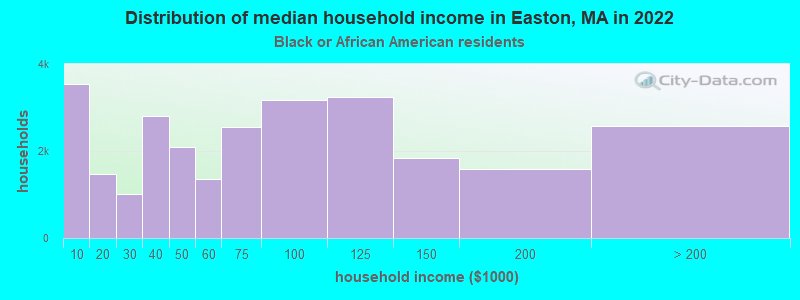
- $180,088Black householders
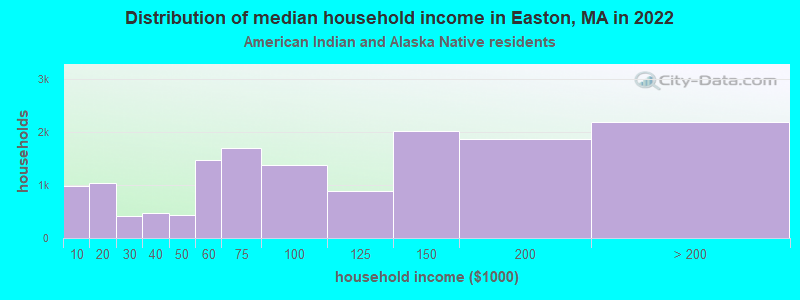
- $181,542American Indian and Alaska Native householders
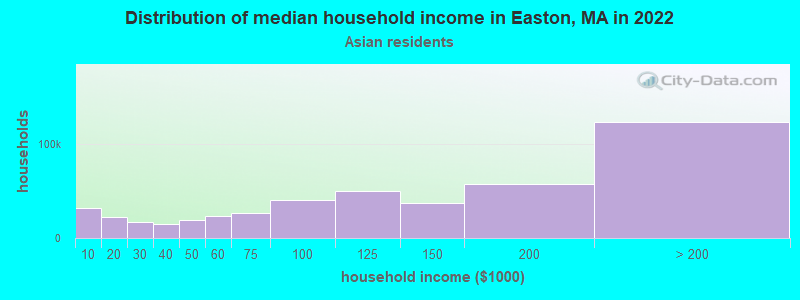
- over $200,000Asian householders
- over $200,000Some other race householders
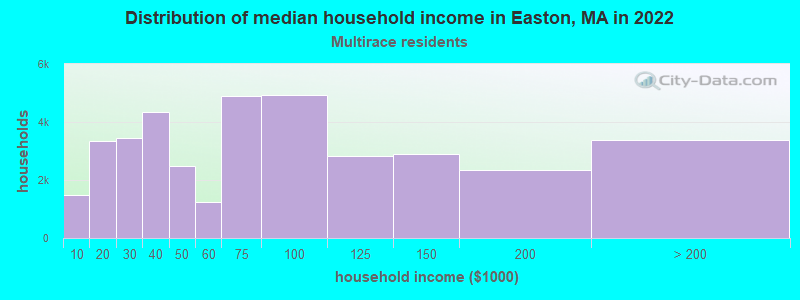
- $147,573Two or more races householders
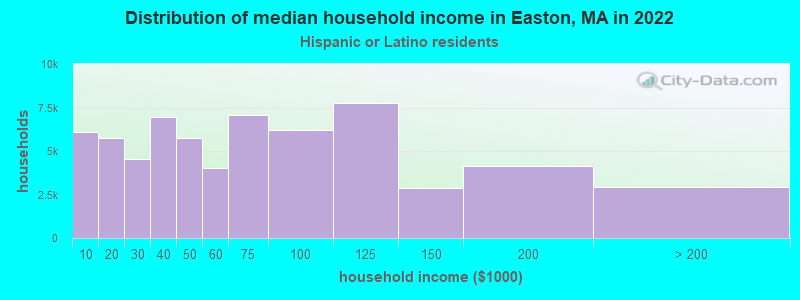
- over $200,000Hispanic or Latino race householders
- Median 2022 house value
- $644,916White Non-Hispanic householders
- $770,904Black or African American householders
- $403,806American Indian or Alaska Native householders
- $790,580Asian householders
- $683,388Some other race householders
- over $1,000,000Two or more races householders
- $602,039Hispanic or Latino householders
Household income for White non-Hispanic householders
Household income for Black householders
Household income for American Indian and Alaska Native householders
Household income for Asian householders
Household income for Two or more races householders
Household income for Hispanic or Latino race householders
Foreign-born residents in Easton
1,021 residents are foreign born (2.2% Europe, 0.9% Asia, 0.7% Latin America, 0.5% North America).
| This city: | 4.6% |
| Massachusetts: | 12.2% |
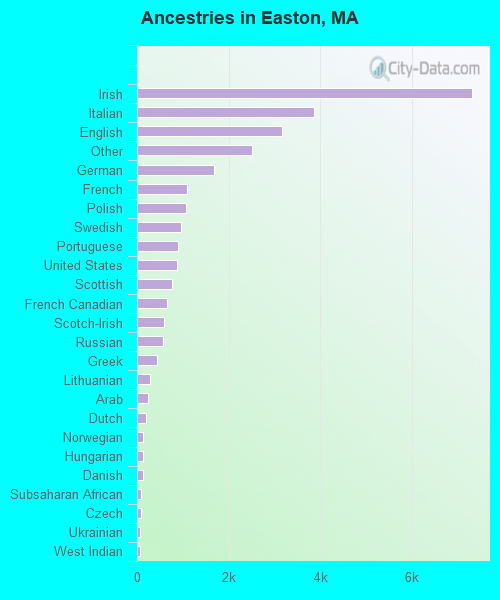
Ancestries in Easton

- 7,32226.2%Irish
- 3,87513.8%Italian
- 3,16011.3%English
- 2,5189.0%Other
- 1,6816.0%German
- 1,0823.9%French
- 1,0623.8%Polish
- 9683.5%Swedish
- 9043.2%Portuguese
- 8713.1%United States
- 7722.8%Scottish
- 6632.4%French Canadian
- 5922.1%Scotch-Irish
- 5612.0%Russian
- 4291.5%Greek
- 2861.0%Lithuanian
- 2370.8%Arab
- 2060.7%Dutch
- 1380.5%Norwegian
- 1320.5%Hungarian
- 1220.4%Danish
- 920.3%Subsaharan African
- 810.3%Czech
- 750.3%Ukrainian
- 680.2%West Indian
- 480.2%Swiss
- 480.2%Welsh
Zip codes: 02375.