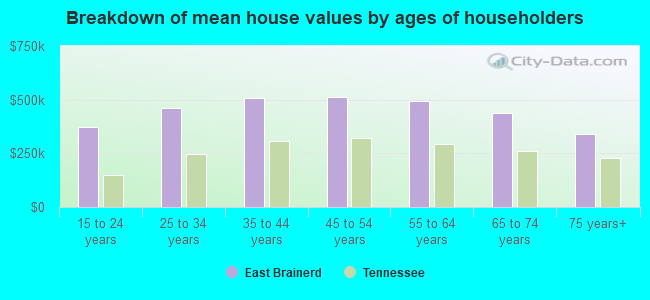
East Brainerd, TN (Tennessee) Houses and Residents
| East Brainerd: | $422,292 |
| Tennessee: | $284,800 |
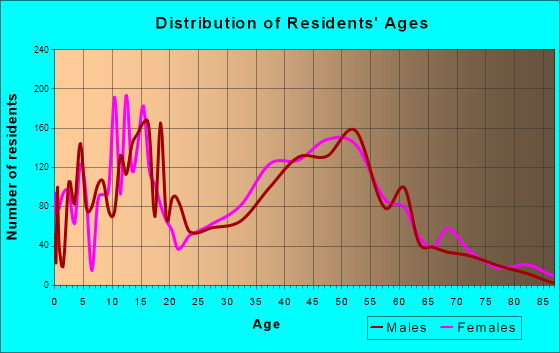
Total population: 15,187 (Urban population: 13,871, Rural population: 22 (all nonfarm))
Houses: 4,844 (4,723 occupied: 4,383 owner occupied, 340 renter occupied)
| % of renters here: | 7% |
| State: | 33% |
Housing density: 560 houses/condos per square mile
Median price asked for vacant for-sale houses and condos in 2022 in this county: $264,704.
Median contract rent in 2022: $1,528 (lower quartile is $1,104, upper quartile is over $2,000)
Median rent asked for vacant for-rent units in 2022: $1,528
Median gross rent in East Brainerd, TN in 2022: $1,741
Housing units in East Brainerd with a mortgage: 3,280 (318 second mortgage, 466 home equity loan, 13 both second mortgage and home equity loan)
Houses without a mortgage: 892
Compare current foreclosures near East Brainerd, TN:
| Photo | Address | Area | Beds / Baths | Price | Details |
|---|---|---|---|---|---|

|
#1
Peavine Rd
Rock Spring, GA 30739
|
852 sq. feet
|
1 baths 2 beds |
$119,900
|
show details |

|
#2
Short Tail Springs Rd
Harrison, TN 37341
|
3,383 sq. feet
|
3 baths 4 beds |
$855,000
|
show details |

|
#3
Long St
Cohutta, GA 30710
|
800 sq. feet
|
1 baths 2 beds |
$21,900
|
show details |

|
#4
Daisy St
Chattanooga, TN 37406
|
- sq. feet
|
- baths - beds |
$16,050
|
show details |

|
#5
Fallen Leaf Dr
Soddy Daisy, TN 37379
|
1,508 sq. feet
|
2 baths 3 beds |
show details | |

|
#6
Lundy Ln
Chattanooga, TN 37412
|
1,572 sq. feet
|
2 baths 4 beds |
show details | |

|
#7
Basil Ln
Harrison, TN 37341
|
1,858 sq. feet
|
2 baths 3 beds |
show details | |

|
#8
Gadd Rd
Chattanooga, TN 37415
|
1,066 sq. feet
|
1 baths 3 beds |
show details | |

|
#9
Laura Ln
Ringgold, GA 30736
|
1,308 sq. feet
|
2 baths 3 beds |
show details | |

|
#10
Brumby Rd
Flintstone, GA 30725
|
1,371 sq. feet
|
2 baths 2 beds |
show details |
| Photo | Address | Area | Beds / Baths | Price | Details |
|---|---|---|---|---|---|

|
#11
James St
Rossville, GA 30741
|
2,255 sq. feet
|
2 baths 3 beds |
show details | |

|
#12
Cuscowilla Trl
Chattanooga, TN 37415
|
1,608 sq. feet
|
2 baths 3 beds |
show details | |

|
#13
Everett Dr
Chattanooga, TN 37421
|
2,660 sq. feet
|
2 baths 5 beds |
show details | |

|
#14
Wiley Ave
Chattanooga, TN 37412
|
2,345 sq. feet
|
2 baths 4 beds |
show details | |

|
#15
Page Rd
Rossville, GA 30741
|
1,626 sq. feet
|
2 baths 3 beds |
show details | |

|
#16
Dolores Dr
Hixson, TN 37343
|
1,671 sq. feet
|
2 baths 3 beds |
show details | |

|
#17
Farmway Dr SE
Cleveland, TN 37323
|
1,408 sq. feet
|
2 baths 3 beds |
show details | |

|
#18
Flagstone Dr
Ooltewah, TN 37363
|
5,707 sq. feet
|
6 baths - beds |
show details | |

|
#19
Telico Dr
Dalton, GA 30721
|
1,696 sq. feet
|
2 baths - beds |
show details | |

|
#20
Longview St
Hixson, TN 37343
|
1,710 sq. feet
|
2 baths - beds |
show details |
| Photo | Address | Area | Beds / Baths | Price | Details |
|---|---|---|---|---|---|

|
#21
Black Fox Rd
Mc Donald, TN 37353
|
2,442 sq. feet
|
3 baths 3 beds |
show details | |

|
#22
Stonewood Dr NW
Cleveland, TN 37311
|
2,530 sq. feet
|
3 baths 3 beds |
show details | |

|
#23
Lee St SE
Cleveland, TN 37311
|
1,180 sq. feet
|
2 baths 3 beds |
show details | |

|
#24
White Oak Rd NW
Cleveland, TN 37312
|
1,308 sq. feet
|
1 baths - beds |
show details | |

|
#25
Colorado St
Hixson, TN 37343
|
- sq. feet
|
2 baths 3 beds |
show details | |

|
#26
Virginia Ave SW
Cleveland, TN 37311
|
1,196 sq. feet
|
2 baths 3 beds |
show details | |

|
#27
Eastview Ln
Ringgold, GA 30736
|
1,346 sq. feet
|
2 baths 3 beds |
show details | |

|
#28
Love Ln
Hixson, TN 37343
|
912 sq. feet
|
1 baths - beds |
show details | |

|
#29
Bernita Ln
Rocky Face, GA 30740
|
1,196 sq. feet
|
2 baths - beds |
show details | |

|
#30
Blue Springs Rd
Cleveland, TN 37311
|
1,495 sq. feet
|
2 baths 3 beds |
show details |
| Photo | Address | Area | Beds / Baths | Price | Details |
|---|---|---|---|---|---|

|
#31
Rim Ridge Ct
Harrison, TN 37341
|
- sq. feet
|
2 baths 4 beds |
show details | |

|
#32
W Garden Farm Rd
Rossville, GA 30741
|
1,288 sq. feet
|
1 baths - beds |
show details | |

|
#33
Morningside Dr
Soddy Daisy, TN 37379
|
- sq. feet
|
1 baths 3 beds |
show details | |

|
#34
Haven Dr
Dalton, GA 30721
|
2,213 sq. feet
|
3 baths - beds |
show details | |

|
#35
Meeks Ln
Tunnel Hill, GA 30755
|
672 sq. feet
|
1 baths - beds |
show details | |

|
#36
Crow Rd NE
Dalton, GA 30721
|
1,550 sq. feet
|
2 baths - beds |
show details | |

|
#37
E State Line Rd
Rossville, GA 30741
|
768 sq. feet
|
1 baths - beds |
show details | |

|
#38
Keith Salem Rd
Ringgold, GA 30736
|
1,731 sq. feet
|
2 baths - beds |
show details | |

|
#39
Old Mill Rd
Ringgold, GA 30736
|
1,622 sq. feet
|
1 baths - beds |
show details | |

|
#40
Vittetoe Rd
Chickamauga, GA 30707
|
1,372 sq. feet
|
2 baths - beds |
show details |
| Photo | Address | Area | Beds / Baths | Price | Details |
|---|---|---|---|---|---|

|
#41
Gilbert Rd
Ringgold, GA 30736
|
1,344 sq. feet
|
2 baths - beds |
show details | |

|
#42
Howard Leonard Rd
Ringgold, GA 30736
|
1,240 sq. feet
|
2 baths - beds |
show details | |

|
#43
Salem Rd
Rossville, GA 30741
|
672 sq. feet
|
1 baths - beds |
show details | |

|
#44
Strawhill Rd SE
Cleveland, TN 37323
|
1,884 sq. feet
|
2 baths - beds |
show details | |

|
#45
Karen Elizabeth Ln
Ringgold, GA 30736
|
1,230 sq. feet
|
2 baths - beds |
show details | |

|
#46
Robin Cir
Rossville, GA 30741
|
960 sq. feet
|
1 baths - beds |
show details | |

|
#47
Sage Brush Ln
Rossville, GA 30741
|
1,152 sq. feet
|
2 baths - beds |
show details | |

|
#48
Biscayne Blvd
Rossville, GA 30741
|
1,100 sq. feet
|
2 baths - beds |
show details | |

|
#49
Glass Slipper Trl
Flintstone, GA 30725
|
1,094 sq. feet
|
2 baths - beds |
show details | |

|
Check over 1 million property listings on Foreclosure.com!
|
browse all offers | |||

 | Why are homes in Hixson cheaper than other areas? (5 replies) |
| New to town, looking for fun/safe place to live (14 replies) |
| 1 BR apartment options? (2 replies) |
| Hamilton County, Tennessee: Grocery Stores (14 replies) |
| Best time/season to visit, want to look around for possible relocation (1 reply) |
| Possibly moving to near Cleveland, TN (5 replies) |
Household type by relationship:
Households: 326,685- In family households: 267,315 (59,706 male householders, 28,443 female householders)
63,343 spouses, 87,531 children (80,438 natural, 2,467 adopted, 4,626 stepchildren), 8,956 grandchildren, 3,302 brothers or sisters, 2,892 parents, foster children, 4,302 other relatives, 6,916 non-relatives
- In nonfamily households: 59,370 (21,874 male householders (17,159 living alone)), 26,659 female householders (22,956 living alone)), 10,837 nonrelatives
- In group quarters: 9,778 (3,711 institutionalized population)
43,864 married couples with children.
18,910 single-parent households (3,044 men, 15,866 women).
94.3% of residents of East Brainerd speak English at home.
2.5% of residents speak Spanish at home (59% speak English very well, 27% speak English well, 14% speak English not well).
1.2% of residents speak other Indo-European language at home (71% speak English very well, 14% speak English well, 11% speak English not well, 4% don't speak English at all).
1.6% of residents speak Asian or Pacific Island language at home (56% speak English very well, 28% speak English well, 12% speak English not well, 4% don't speak English at all).
0.4% of residents speak other language at home (100% speak English very well).
Foreign born population: 924 (5.5%)
(60.3% of them are naturalized citizens)
| Here: | 7.9 |
| State: | 6.5 |
| Here: | 5.1 |
| State: | 4.4 |
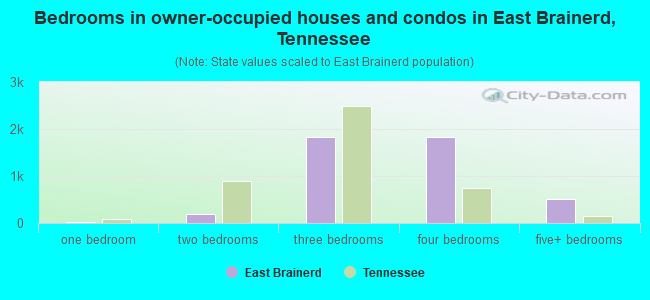
- Bedrooms in owner-occupied houses and condos in East Brainerd, Tennessee
- 0no bedroom
- 301 bedroom
- 1932 bedrooms
- 1,8273 bedrooms
- 1,8294 bedrooms
- 5045+ bedrooms
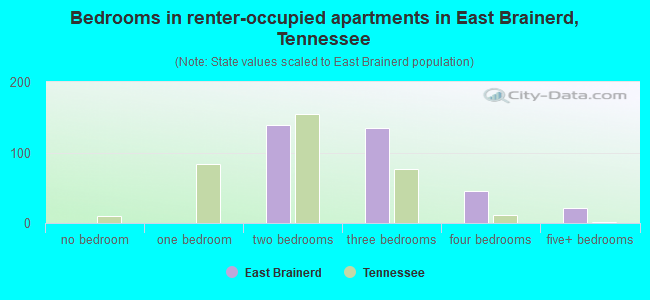
- Bedrooms in renter-occupied apartments in East Brainerd, Tennessee
- 0no bedroom
- 01 bedroom
- 1392 bedrooms
- 1353 bedrooms
- 454 bedrooms
- 215+ bedrooms
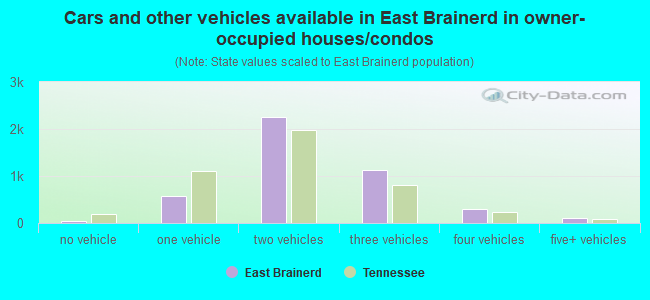
- Cars and other vehicles available in East Brainerd in owner-occupied houses/condos
- 37no vehicle
- 5701 vehicle
- 2,2582 vehicles
- 1,1263 vehicles
- 2934 vehicles
- 995+ vehicles
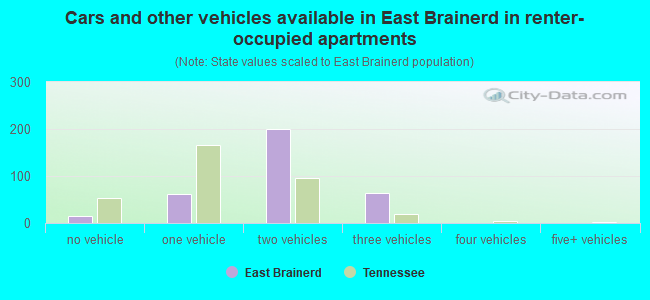
- Cars and other vehicles available in East Brainerd in renter-occupied apartments
- 15no vehicle
- 611 vehicle
- 2002 vehicles
- 643 vehicles
- 04 vehicles
- 05+ vehicles
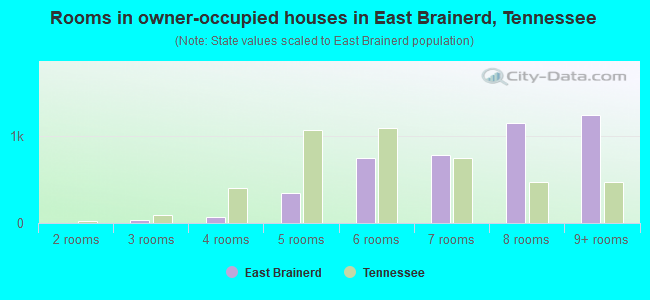
- Rooms in owner-occupied houses in East Brainerd, Tennessee
- 01 room
- 02 rooms
- 323 rooms
- 744 rooms
- 3485 rooms
- 7496 rooms
- 7807 rooms
- 1,1568 rooms
- 1,2449+ rooms
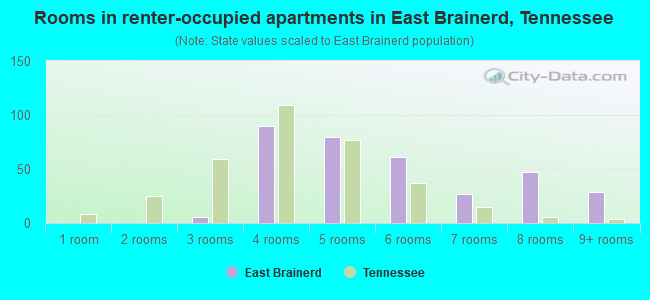
- Rooms in renter-occupied apartments in East Brainerd, Tennessee
- 01 room
- 02 rooms
- 63 rooms
- 904 rooms
- 805 rooms
- 616 rooms
- 277 rooms
- 478 rooms
- 299+ rooms
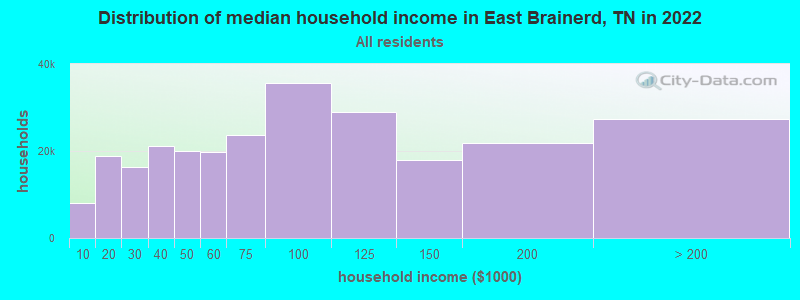
East Brainerd, TN household income distribution

- 7,974Less than $10,000
- 18,924$10,000 to $19,999
- 16,338$20,000 to $29,999
- 21,205$30,000 to $39,999
- 20,054$40,000 to $49,999
- 19,716$50,000 to $59,999
- 23,793$60,000 to $74,999
- 35,667$75,000 to $99,999
- 28,851$100,000 to $124,999
- 18,029$125,000 to $149,999
- 21,784$150,000 to $199,999
- 27,393$200,000 or more
Percentage of workers working in this county: 86.4%
Number of people working at home: 1,510 (15.8% of all workers)
Travel time to work (commute)
- Less than 5 minutes: 59
- 5 to 9 minutes: 414
- 10 to 14 minutes: 792
- 15 to 19 minutes: 1,220
- 20 to 24 minutes: 1,431
- 25 to 29 minutes: 964
- 30 to 34 minutes: 1,355
- 35 to 39 minutes: 241
- 40 to 44 minutes: 98
- 45 to 59 minutes: 318
- 60 to 89 minutes: 46
- 90 or more minutes: 247
Means of transportation to work:
- Drove a car alone: 6,294 (85.2%)
- Carpooled: 827 (11.2%)
- Walked: 36 (0.5%)
- Other means: 28 (0.4%)
- Worked at home: 206 (2.8%)
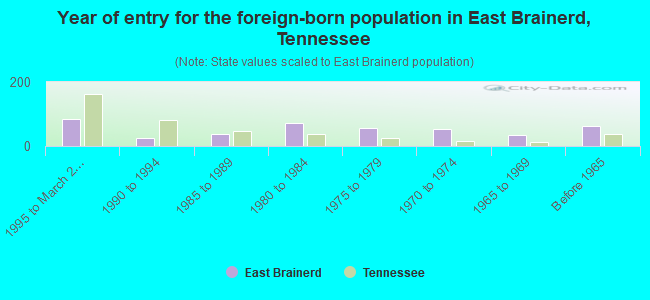
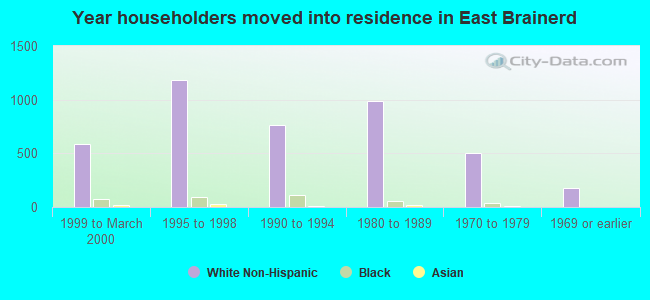
- Year of entry for the foreign-born population in East Brainerd, Tennessee
- 831995 to March 2000
- 251990 to 1994
- 381985 to 1989
- 731980 to 1984
- 551975 to 1979
- 541970 to 1974
- 331965 to 1969
- 61Before 1965
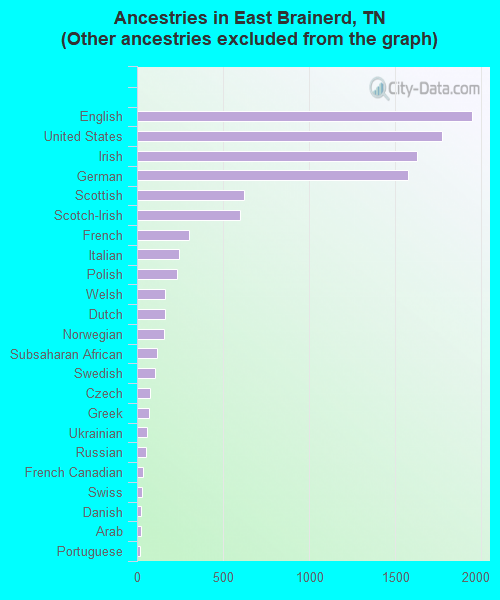
First ancestries reported:
- Other: 2,576 (20.4%)
- English: 1,947 (15.4%)
- United States: 1,773 (14.1%)
- Irish: 1,624 (12.9%)
- German: 1,573 (12.5%)
- Scottish: 621 (4.9%)
- Scotch-Irish: 601 (4.8%)
- French: 303 (2.4%)
- Italian: 243 (1.9%)
- Polish: 234 (1.9%)
- Welsh: 164 (1.3%)
- Dutch: 162 (1.3%)
- Norwegian: 156 (1.2%)
- Subsaharan African: 114 (0.9%)
- Swedish: 105 (0.8%)
- Czech: 75 (0.6%)
- Greek: 67 (0.5%)
- Ukrainian: 58 (0.5%)
- Russian: 53 (0.4%)
- French Canadian: 32 (0.3%)
- Swiss: 30 (0.2%)
- Danish: 23 (0.2%)
- Arab: 22 (0.2%)
- Portuguese: 20 (0.2%)
- Lithuanian: 14 (0.1%)
- Hungarian: 9 (0.07%)
- Slovak: 6 (0.05%)
Most common places of birth for foreign-born residents (%):
| East Brainerd: | 20.9% (88) |
| Tennessee: | 3.8% (6,106) |
| East Brainerd: | 8.3% (35) |
| Tennessee: | 1.0% (1,540) |
| East Brainerd: | 6.2% (26) |
| Tennessee: | 5.2% (8,316) |
| East Brainerd: | 5.9% (25) |
| Tennessee: | 0.7% (1,046) |
| East Brainerd: | 5.5% (23) |
| Tennessee: | 0.5% (849) |
| East Brainerd: | 5.2% (22) |
| Tennessee: | 2.3% (3,669) |
| East Brainerd: | 5.0% (21) |
| Tennessee: | 0.8% (1,196) |
| East Brainerd: | 4.7% (20) |
| Tennessee: | 0.9% (1,381) |
| East Brainerd: | 4.5% (19) |
| Tennessee: | 2.3% (3,660) |
| East Brainerd: | 4.3% (18) |
| Tennessee: | 28.1% (44,682) |
| East Brainerd: | 3.8% (16) |
| Tennessee: | 0.6% (899) |
| East Brainerd: | 3.6% (15) |
| Tennessee: | 1.1% (1,705) |
| East Brainerd: | 3.3% (14) |
| Tennessee: | 0.3% (481) |
| East Brainerd: | 3.1% (13) |
| Tennessee: | 3.7% (5,949) |
| East Brainerd: | 2.8% (12) |
| Tennessee: | 0.5% (871) |
| East Brainerd: | 2.6% (11) |
| Tennessee: | 0.8% (1,283) |
| East Brainerd: | 2.4% (10) |
| Tennessee: | 0.9% (1,385) |
| East Brainerd: | 2.1% (9) |
| Tennessee: | 0.3% (486) |
| East Brainerd: | 1.7% (7) |
| Tennessee: | 0.3% (429) |
Place of birth for U.S.-born residents:
- This state: 6,702
- Other state: 6,712
- Northeast: 988
- Midwest: 1,646
- South: 3,565
- West: 513
60% of East Brainerd residents lived in the same house 5 years ago.
Out of people who lived in different houses, 51% lived in this county.
Out of people who lived in different counties, 19% lived in Tennessee.
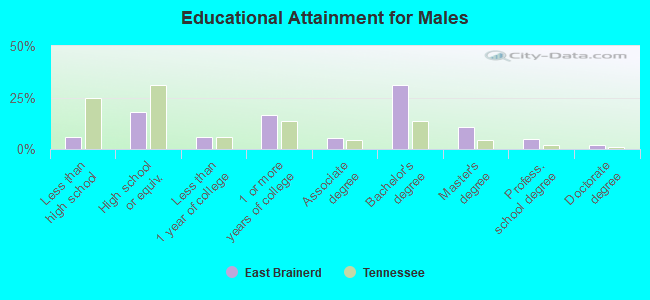
Education attainment for males 25 years and older:
- No schooling: 0
- Nursery to 4th grade: 15
- 5th and 6th grade: 23
- 7th and 8th grade: 34
- 9th grade: 26
- 10th grade: 49
- 11th grade: 43
- 12th grade, no diploma: 68
- High school graduate (or equivalency): 776
- Less than 1 year of college: 264
- Some college more than 1 year, no degree: 714
- Associate degree: 226
- Bachelor's degree: 1,355
- Master's degree: 467
- Professional school degree: 212
- Doctorate degree: 90
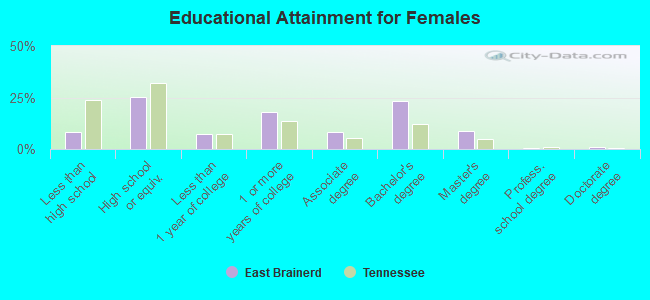
Education attainment for females 25 years and older:
- No schooling: 22
- Nursery to 4th grade: 18
- 5th and 6th grade: 25
- 7th and 8th grade: 74
- 9th grade: 34
- 10th grade: 49
- 11th grade: 49
- 12th grade, no diploma: 128
- High school graduate (or equivalency): 1,214
- Less than 1 year of college: 349
- Some college more than 1 year, no degree: 852
- Associate degree: 398
- Bachelor's degree: 1,124
- Master's degree: 416
- Professional school degree: 22
- Doctorate degree: 35
Housing units in structures:
- One, detached: 4,676
- One, attached: 41
- Two: 75
- Mobile homes: 52
Median worth of mobile homes: $74,039
Housing units lacking complete kitchen facilities: 0.2%
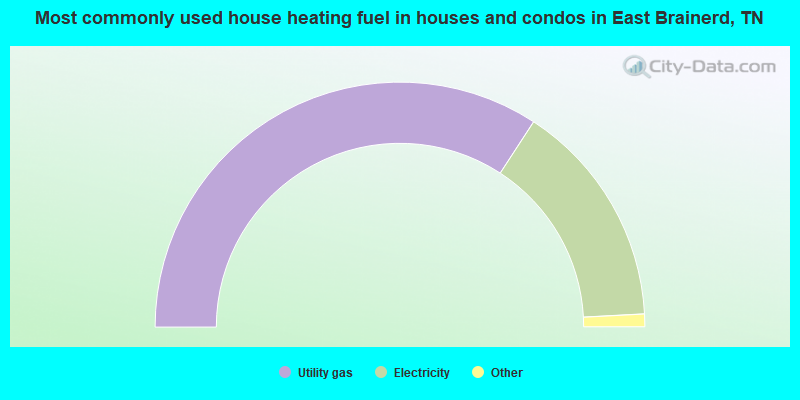
- 68.4%Utility gas
- 29.9%Electricity
- 1.5%Bottled, tank, or LP gas
- 0.2%Fuel oil, kerosene, etc.
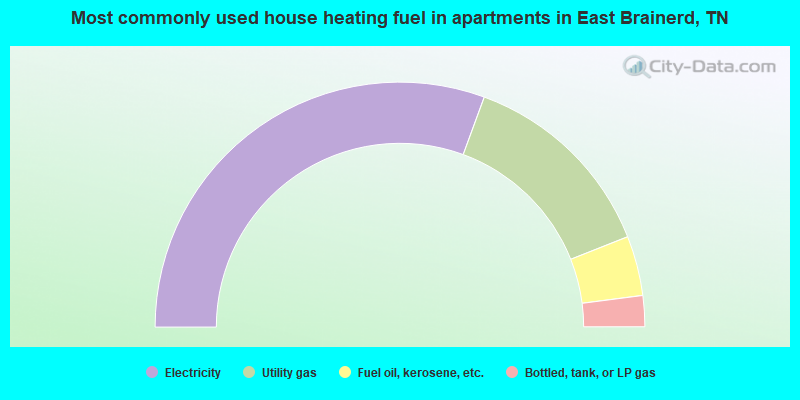
- 61.2%Electricity
- 26.8%Utility gas
- 7.9%Fuel oil, kerosene, etc.
- 4.1%Bottled, tank, or LP gas
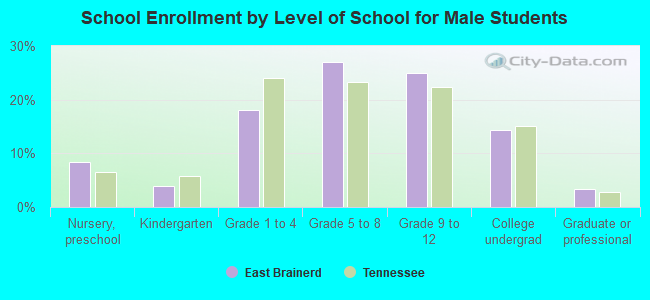
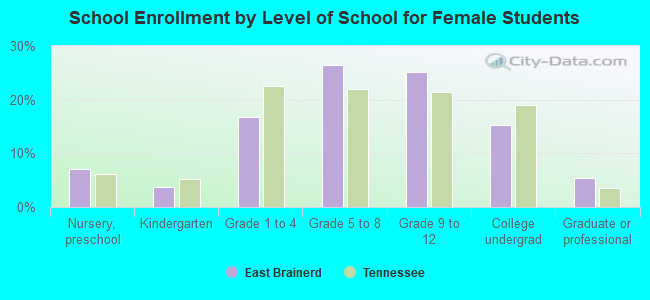
Private vs. public school enrollment:
| Here: | 34.9% |
| Tennessee: | 9.5% |
| Here: | 46.3% |
| Tennessee: | 10.4% |
| Here: | 14.8% |
| Tennessee: | 22.8% |