Races in East Brainerd, Tennessee (TN) Detailed Stats
Ancestries, Foreign-born residents, place of birth

Recent posts about races in East Brainerd, Tennessee on our local forum with over 2,400,000 registered users:
 | Tell me about Apison (2 replies) |
| Best time/season to visit, want to look around for possible relocation (1 reply) |
| Possibly moving to near Cleveland, TN (5 replies) |
| NEW East Brainerd Elem? delayed? (6 replies) |
| East Brainerd Elementary (12 replies) |
| 1 BR apartment options? (2 replies) |
3.0% of East Brainerd, TN residents are foreign-born (1.4% born in Asia, 0.6% born in Europe, 0.5% born in Latin America, 0.4% born in Africa), which is 67.4% less than the foreign-born rate of 5.0% across the entire state of Tennessee.
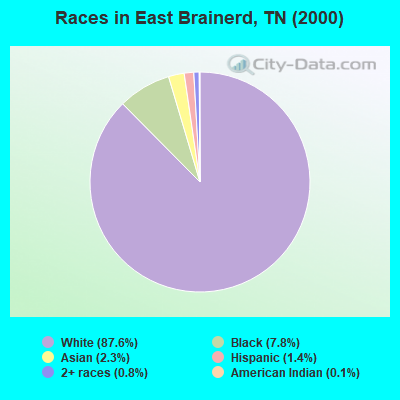
Race distribution in East Brainerd

- 12,37987.6%White alone
- 1,0997.8%Black alone
- 3192.3%Asian alone
- 1931.4%Hispanic
- 1130.8%Two or more races
- 180.1%American Indian alone
- 100.07%Other race alone
- 10.01%Native Hawaiian and Other
Pacific Islander alone
2000
2022
-
- 4,505,93079.2%White alone
- 928,20416.3%Black alone
- 123,8382.2%Hispanic
- 54,8241.0%Two or more races
- 56,0771.0%Asian alone
- 13,8200.2%American Indian alone
- 4,7800.08%Other race alone
- 1,8100.03%Native Hawaiian and Other
Pacific Islander alone

-
- 5,070,02671.9%White alone
- 1,089,73815.5%Black alone
- 442,6296.3%Hispanic
- 279,3814.0%Two or more races
- 131,8171.9%Asian alone
- 26,9720.4%Other race alone
- 6,3870.09%American Indian alone
- 4,3890.06%Native Hawaiian and Other
Pacific Islander alone

Income and house value in East Brainerd
- Median household income in 2022
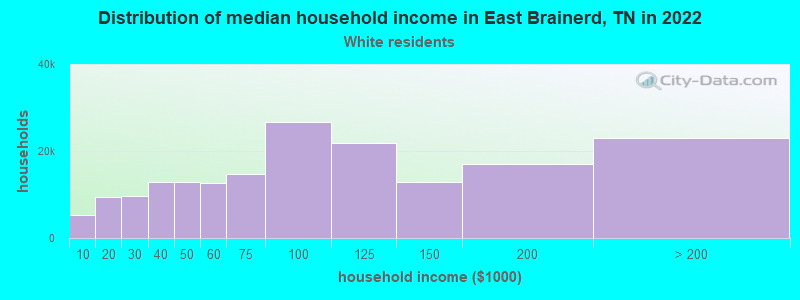
- $135,215White non-Hispanic householders
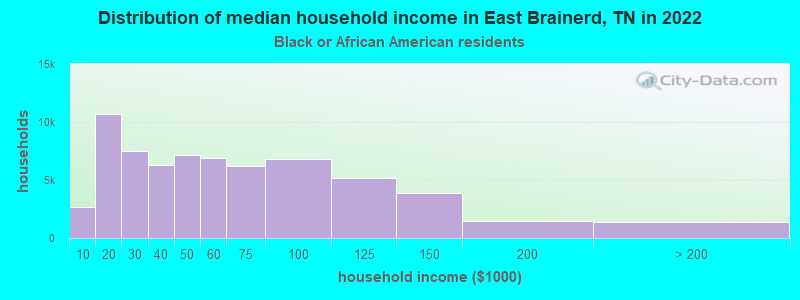
- $121,039Black householders
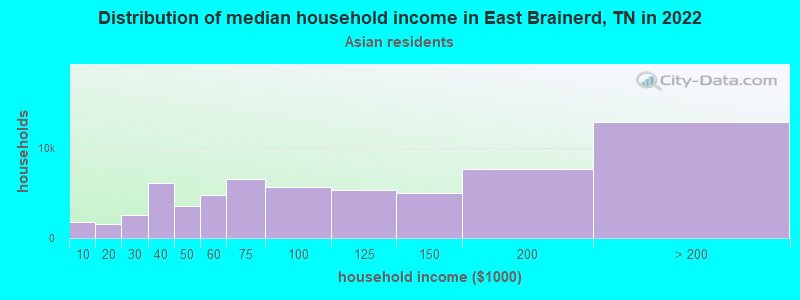
- $168,865Asian householders
- $64,871Some other race householders
- $119,058Two or more races householders
- $105,599Hispanic or Latino race householders
- Median 2022 house value
- $429,780White Non-Hispanic householders
- $367,592Black or African American householders
- $275,775Asian householders
- $309,311Some other race householders
- $390,709Two or more races householders
- $303,776Hispanic or Latino householders
Household income for White non-Hispanic householders
Household income for Black householders
Household income for Asian householders
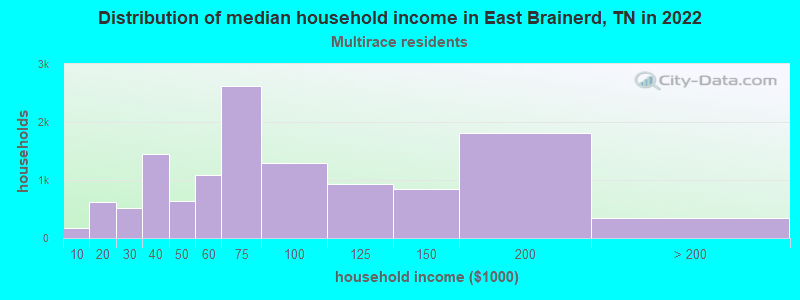
Household income for Two or more races householders
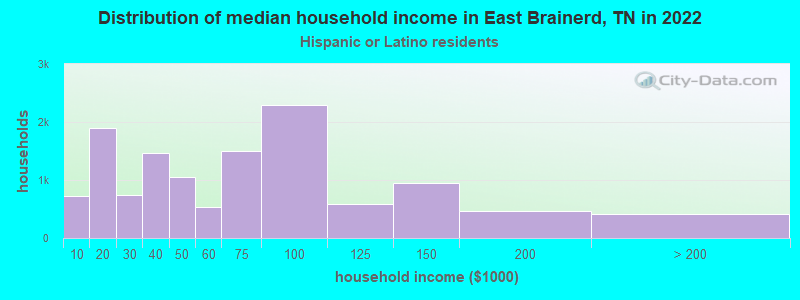
Household income for Hispanic or Latino race householders
Foreign-born residents in East Brainerd
422 residents are foreign born (1.4% Asia, 0.6% Europe, 0.5% Latin America, 0.4% Africa).
| This city: | 3.0% |
| Tennessee: | 2.8% |
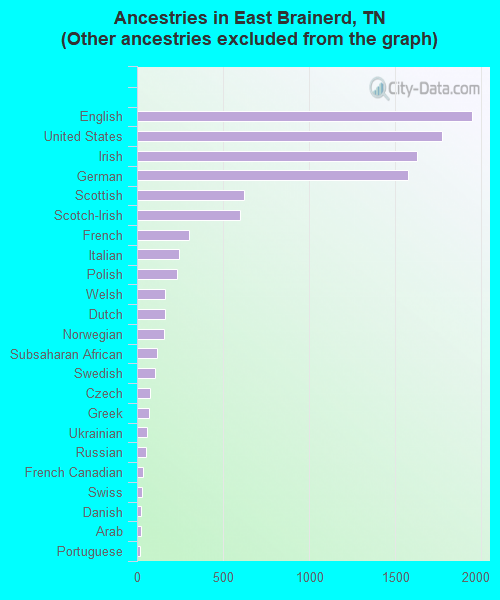
Ancestries in East Brainerd

- 2,57620.4%Other
- 1,94715.4%English
- 1,77314.1%United States
- 1,62412.9%Irish
- 1,57312.5%German
- 6214.9%Scottish
- 6014.8%Scotch-Irish
- 3032.4%French
- 2431.9%Italian
- 2341.9%Polish
- 1641.3%Welsh
- 1621.3%Dutch
- 1561.2%Norwegian
- 1140.9%Subsaharan African
- 1050.8%Swedish
- 750.6%Czech
- 670.5%Greek
- 580.5%Ukrainian
- 530.4%Russian
- 320.3%French Canadian
- 300.2%Swiss
- 230.2%Danish
- 220.2%Arab
- 200.2%Portuguese
- 140.1%Lithuanian
- 90.07%Hungarian
- 60.05%Slovak
Zip codes: 37421.