Dover, VT (Vermont) Houses and Residents
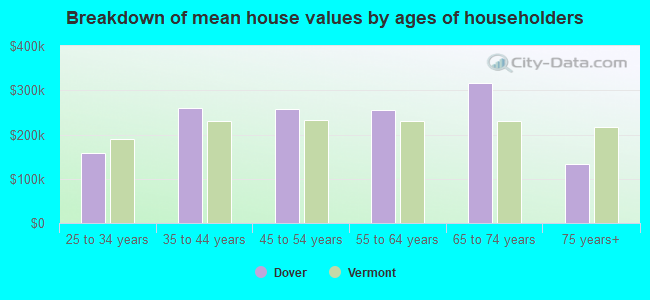
| Dover: | $356,521 |
| Vermont: | $304,700 |
Total population: 1,124 (Urban population: 0, Rural population: 1,410 (29 farm, 1,381 nonfarm))
Houses: 2,749 (611 occupied: 443 owner occupied, 168 renter occupied)
| % of renters here: | 27% |
| State: | 26% |
Housing density: 78 houses/condos per square mile
Median price asked for vacant for-sale houses and condos in 2022 in this county: $140,434.
Median contract rent in 2022: $1,054 (lower quartile is $784, upper quartile is $1,216)
Median rent asked for vacant for-rent units in 2022: $997
Median gross rent in Dover, VT in 2022: $1,190
Housing units in Dover with a mortgage: 202 (12 second mortgage, 37 home equity loan, 0 both second mortgage and home equity loan)
Houses without a mortgage: 77
Compare current foreclosures near Dover, VT:
| Photo | Address | Area | Beds / Baths | Price | Details |
|---|---|---|---|---|---|

|
#1
Chapel Rd
Bennington, VT 05201
|
1,000 sq. feet
|
1 baths 2 beds |
$273,000
|
show details |

|
#2
Pine St
Brattleboro, VT 05301
|
2,906 sq. feet
|
2 baths 5 beds |
show details | |

|
#3
Dover Rd
South Newfane, VT 05351
|
- sq. feet
|
- baths - beds |
show details | |

|
#4
Dover Rd
Williamsville, VT 05362
|
- sq. feet
|
- baths - beds |
show details | |

|
#5
Old Cyrus Stage Rd
Rowe, MA 01367
|
- sq. feet
|
- baths - beds |
show details | |

|
Check over 1 million property listings on Foreclosure.com!
|
browse all offers | |||
Latest news about housing in Dover, VT collected exclusively by city-data.com from local newspapers, TV, and radio stations

 | Vacation in Vermont (15 replies) |
| Dover and Wilmington (2 replies) |
| Putney/Dummerston/Bratt/Keene (18 replies) |
| Dover or Wilmington (14 replies) |
| Homeowner associations (12 replies) |
| Public transportation - Mt. Snow/W.Dover to Burlington (4 replies) |

Household type by relationship:
Households: 43,049- In family households: 33,200 (7,463 male householders, 3,990 female householders)
8,639 spouses, 10,419 children (9,554 natural, 386 adopted, 479 stepchildren), 542 grandchildren, 209 brothers or sisters, 219 parents, foster children, 250 other relatives, 1,292 non-relatives
- In nonfamily households: 9,849 (3,711 male householders (2,849 living alone)), 4,126 female householders (3,293 living alone)), 2,012 nonrelatives
- In group quarters: 1,464 (357 institutionalized population)
7,055 married couples with children.
2,651 single-parent households (664 men, 1,987 women).
95.2% of residents of Dover speak English at home.
1.0% of residents speak Spanish at home (57% speak English very well, 43% speak English well).
3.5% of residents speak other Indo-European language at home (96% speak English very well, 4% speak English not well).
0.2% of residents speak other language at home (100% speak English very well).
Foreign born population: 52 (3.3%)
(88.5% of them are naturalized citizens)
| Here: | 6.4 |
| State: | 6.4 |
| Here: | 4.3 |
| State: | 3.9 |
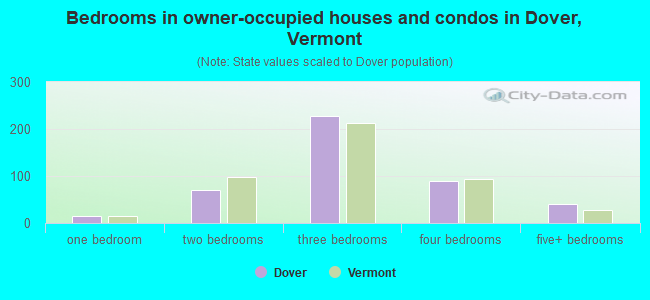
- Bedrooms in owner-occupied houses and condos in Dover, Vermont
- 0no bedroom
- 151 bedroom
- 712 bedrooms
- 2273 bedrooms
- 904 bedrooms
- 405+ bedrooms
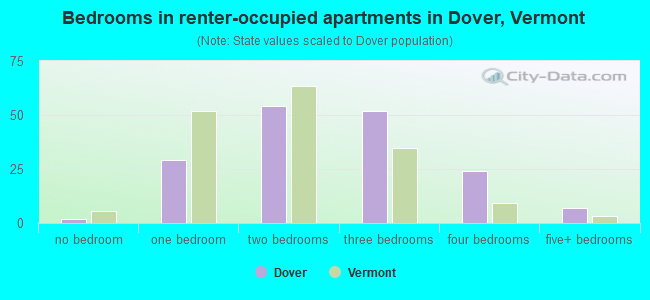
- Bedrooms in renter-occupied apartments in Dover, Vermont
- 2no bedroom
- 291 bedroom
- 542 bedrooms
- 523 bedrooms
- 244 bedrooms
- 75+ bedrooms
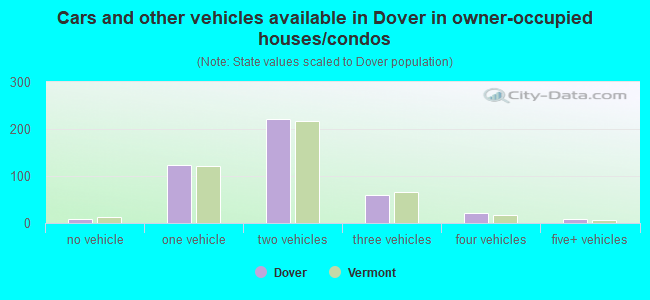
- Cars and other vehicles available in Dover in owner-occupied houses/condos
- 9no vehicle
- 1231 vehicle
- 2212 vehicles
- 603 vehicles
- 214 vehicles
- 95+ vehicles
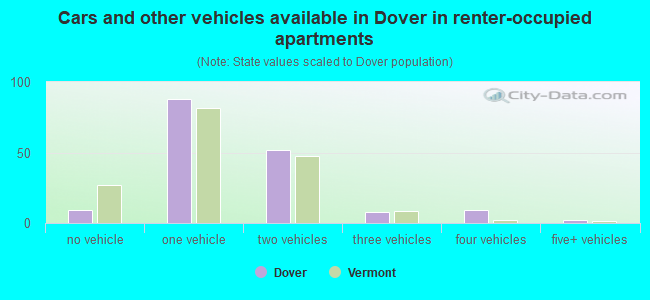
- Cars and other vehicles available in Dover in renter-occupied apartments
- 9no vehicle
- 881 vehicle
- 522 vehicles
- 83 vehicles
- 94 vehicles
- 25+ vehicles
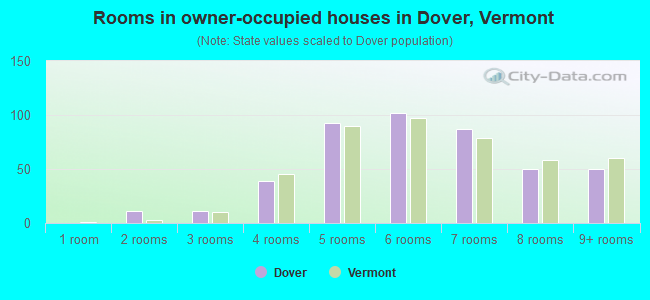
- Rooms in owner-occupied houses in Dover, Vermont
- 01 room
- 112 rooms
- 113 rooms
- 394 rooms
- 935 rooms
- 1026 rooms
- 877 rooms
- 508 rooms
- 509+ rooms
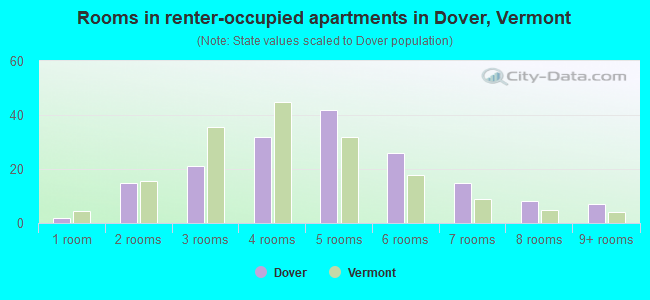
- Rooms in renter-occupied apartments in Dover, Vermont
- 21 room
- 152 rooms
- 213 rooms
- 324 rooms
- 425 rooms
- 266 rooms
- 157 rooms
- 88 rooms
- 79+ rooms
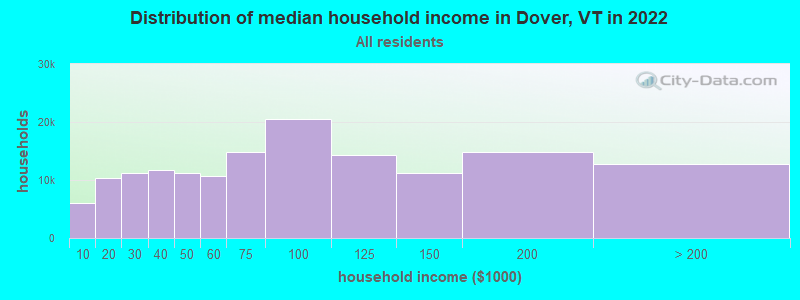
Dover, VT household income distribution

- 5,400Less than $10,000
- 11,026$10,000 to $19,999
- 12,659$20,000 to $29,999
- 14,733$30,000 to $39,999
- 13,665$40,000 to $49,999
- 13,315$50,000 to $59,999
- 17,723$60,000 to $74,999
- 26,826$75,000 to $99,999
- 17,764$100,000 to $124,999
- 14,182$125,000 to $149,999
- 18,009$150,000 to $199,999
- 16,267$200,000 or more
Percentage of workers working in this county: 85.5%
Number of people working at home: 152 (17.3% of all workers)
Travel time to work (commute)
- Less than 5 minutes: 57
- 5 to 9 minutes: 179
- 10 to 14 minutes: 158
- 15 to 19 minutes: 85
- 20 to 24 minutes: 62
- 25 to 29 minutes: 34
- 30 to 34 minutes: 60
- 35 to 39 minutes: 10
- 40 to 44 minutes: 10
- 45 to 59 minutes: 43
- 60 to 89 minutes: 24
- 90 or more minutes: 26
Means of transportation to work:
- Drove a car alone: 632 (78.3%)
- Carpooled: 64 (7.9%)
- Bus or trolley bus: 3 (0.4%)
- Subway or elevated: 5 (0.6%)
- Railroad: 11 (1.4%)
- Walked: 29 (3.6%)
- Other means: 4 (0.5%)
- Worked at home: 59 (7.3%)
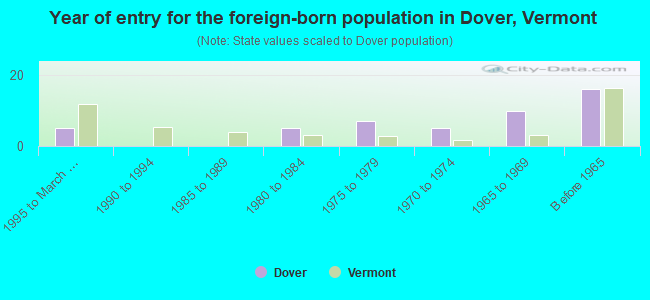
- Year of entry for the foreign-born population in Dover, Vermont
- 51995 to March 2000
- 01990 to 1994
- 01985 to 1989
- 51980 to 1984
- 71975 to 1979
- 51970 to 1974
- 101965 to 1969
- 16Before 1965
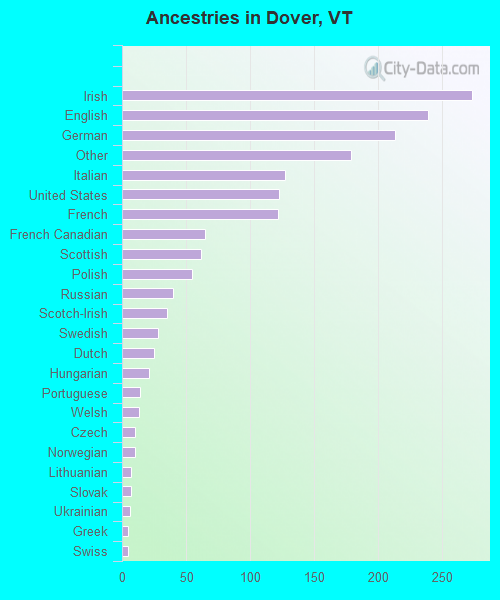
First ancestries reported:
- Irish: 273 (16.2%)
- English: 239 (14.2%)
- German: 213 (12.6%)
- Other: 179 (10.6%)
- Italian: 127 (7.5%)
- United States: 123 (7.3%)
- French: 122 (7.2%)
- French Canadian: 65 (3.9%)
- Scottish: 62 (3.7%)
- Polish: 55 (3.3%)
- Russian: 40 (2.4%)
- Scotch-Irish: 35 (2.1%)
- Swedish: 28 (1.7%)
- Dutch: 25 (1.5%)
- Hungarian: 21 (1.2%)
- Portuguese: 14 (0.8%)
- Welsh: 13 (0.8%)
- Czech: 10 (0.6%)
- Norwegian: 10 (0.6%)
- Lithuanian: 7 (0.4%)
- Slovak: 7 (0.4%)
- Ukrainian: 6 (0.4%)
- Greek: 5 (0.3%)
- Swiss: 5 (0.3%)
Most common places of birth for foreign-born residents (%):
| Dover: | 16.7% (8) |
| Vermont: | 7.2% (1,669) |
| Dover: | 14.6% (7) |
| Vermont: | 34.0% (7,912) |
| Dover: | 12.5% (6) |
| Vermont: | 1.4% (322) |
| Dover: | 12.5% (6) |
| Vermont: | 0.5% (108) |
| Dover: | 10.4% (5) |
| Vermont: | 0.3% (79) |
| Dover: | 6.2% (3) |
| Vermont: | 1.2% (273) |
| Dover: | 6.2% (3) |
| Vermont: | 1.6% (372) |
| Dover: | 4.2% (2) |
| Vermont: | 7.5% (1,744) |
| Dover: | 4.2% (2) |
| Vermont: | 1.2% (268) |
| Dover: | 4.2% (2) |
| Vermont: | 0.9% (205) |
| Dover: | 4.2% (2) |
| Vermont: | 0.2% (57) |
| Dover: | 4.2% (2) |
| Vermont: | 0.5% (111) |
Place of birth for U.S.-born residents:
- This state: 405
- Other state: 948
- Northeast: 827
- Midwest: 44
- South: 55
- West: 22
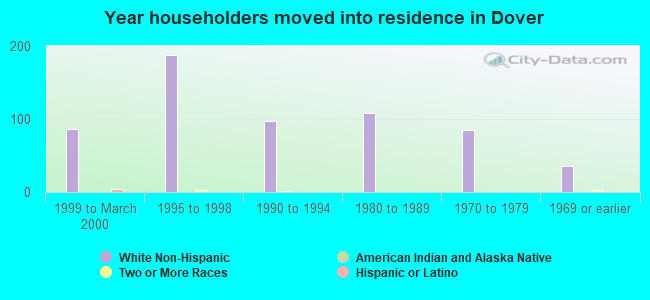
59% of Dover residents lived in the same house 5 years ago.
Out of people who lived in different houses, 45% lived in this county.
Out of people who lived in different counties, 10% lived in Vermont.
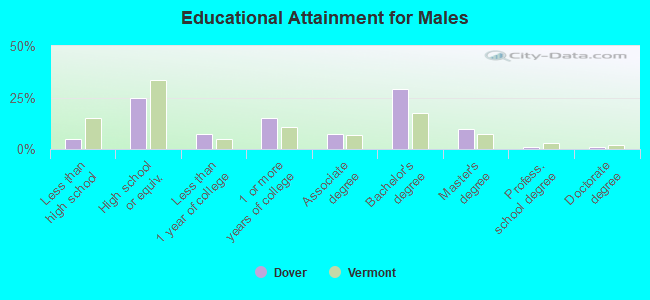
Education attainment for males 25 years and older:
- No schooling: 0
- Nursery to 4th grade: 0
- 5th and 6th grade: 1
- 7th and 8th grade: 5
- 9th grade: 6
- 10th grade: 2
- 11th grade: 6
- 12th grade, no diploma: 7
- High school graduate (or equivalency): 133
- Less than 1 year of college: 38
- Some college more than 1 year, no degree: 80
- Associate degree: 38
- Bachelor's degree: 156
- Master's degree: 53
- Professional school degree: 6
- Doctorate degree: 5
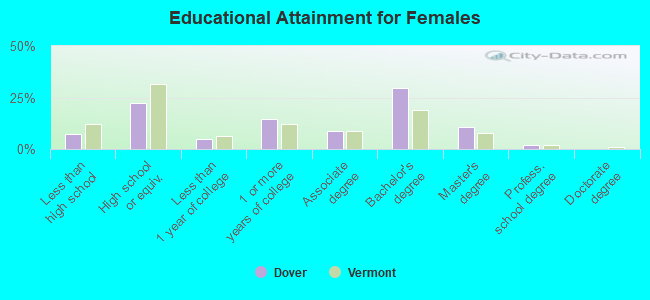
Education attainment for females 25 years and older:
- No schooling: 0
- Nursery to 4th grade: 2
- 5th and 6th grade: 0
- 7th and 8th grade: 10
- 9th grade: 4
- 10th grade: 7
- 11th grade: 4
- 12th grade, no diploma: 7
- High school graduate (or equivalency): 107
- Less than 1 year of college: 24
- Some college more than 1 year, no degree: 71
- Associate degree: 41
- Bachelor's degree: 143
- Master's degree: 52
- Professional school degree: 9
- Doctorate degree: 0


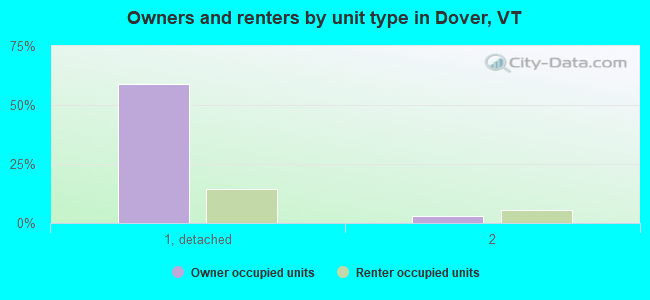
Housing units in structures:
- One, detached: 1,291
- One, attached: 1,102
- Two: 90
- 3 or 4: 58
- 5 to 9: 93
- 10 to 19: 53
- 20 to 49: 14
- 50 or more: 7
- Mobile homes: 39
- Boats, RVs, vans, etc.: 2
Median worth of mobile homes: $136,035
Housing units lacking complete kitchen facilities: 1.2%
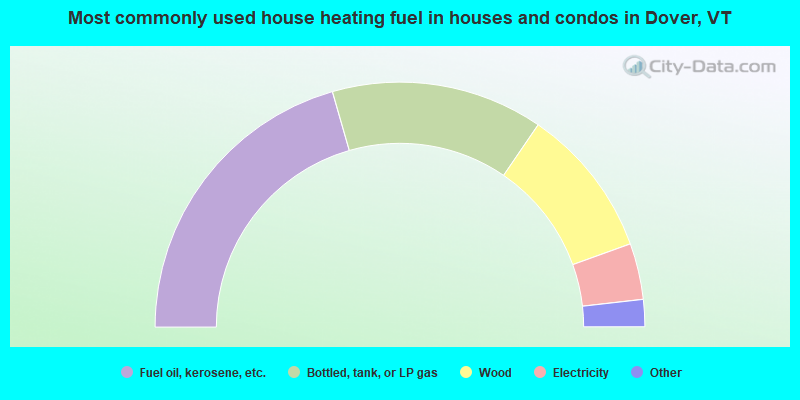
- 41.1%Fuel oil, kerosene, etc.
- 28.0%Bottled, tank, or LP gas
- 19.9%Wood
- 7.4%Electricity
- 2.3%Utility gas
- 0.9%Other fuel
- 0.5%Solar energy
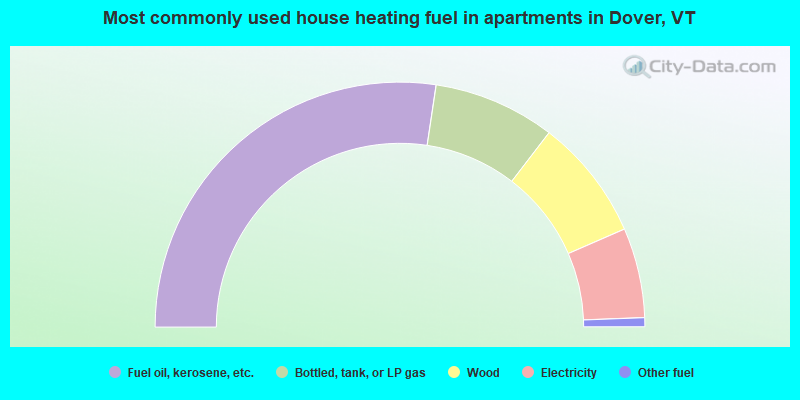
- 54.8%Fuel oil, kerosene, etc.
- 16.1%Bottled, tank, or LP gas
- 16.1%Wood
- 11.9%Electricity
- 1.2%Other fuel
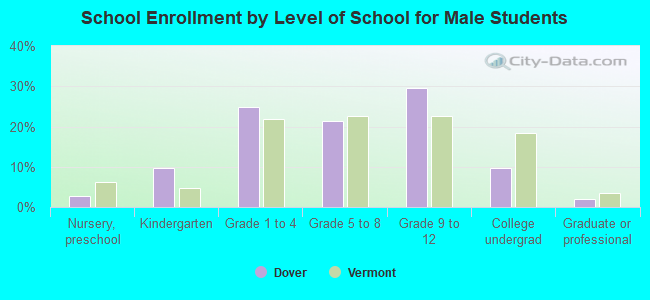
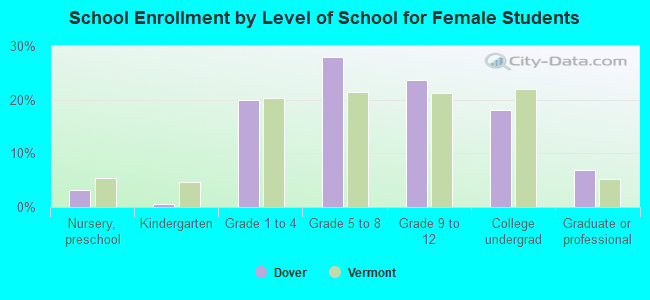
Private vs. public school enrollment:
| Here: | 22.9% |
| Vermont: | 7.2% |
| Here: | 9.9% |
| Vermont: | 10.4% |
| Here: | 27.9% |
| Vermont: | 37.7% |