Races in Dover, Vermont (VT) Detailed Stats
Ancestries, Foreign-born residents, place of birth

Recent posts about races in Dover, Vermont on our local forum with over 2,400,000 registered users:
 | Want to move to New England from NC (19 replies) |
| Here we go again Vermont.... (16 replies) |
| police looking for green plates (17 replies) |
| Does anyone here live in the Putney area? (6 replies) |
3.4% of Dover, VT residents are foreign-born (1.8% born in Europe, 0.8% born in Latin America, 0.5% born in North America), which is 17.5% less than the foreign-born rate of 4.0% across the entire state of Vermont.
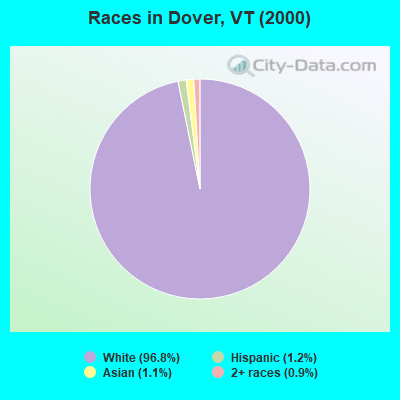
Race distribution in Dover

- 1,36596.8%White alone
- 171.2%Hispanic
- 151.1%Asian alone
- 120.9%Two or more races
- 10.07%Black alone
2000
2022
-
- 585,43196.2%White alone
- 6,8091.1%Two or more races
- 5,5040.9%Hispanic
- 5,1600.8%Asian alone
- 2,9210.5%Black alone
- 2,3250.4%American Indian alone
- 5570.09%Other race alone
- 1200.02%Native Hawaiian and Other
Pacific Islander alone

-
- 583,54690.2%White alone
- 27,3404.2%Two or more races
- 14,7702.3%Hispanic
- 11,5121.8%Asian alone
- 6,2641.0%Black alone
- 2,5210.4%Other race alone
- 1,0520.2%American Indian alone
- 590.01%Native Hawaiian and Other
Pacific Islander alone

Income and house value in Dover
- Median household income in 2022
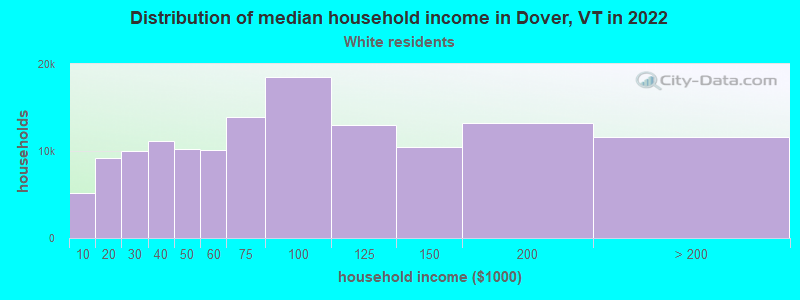
- $77,909White non-Hispanic householders
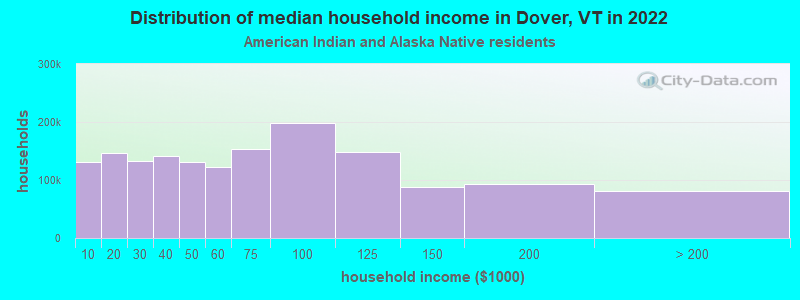
- $137,441American Indian and Alaska Native householders
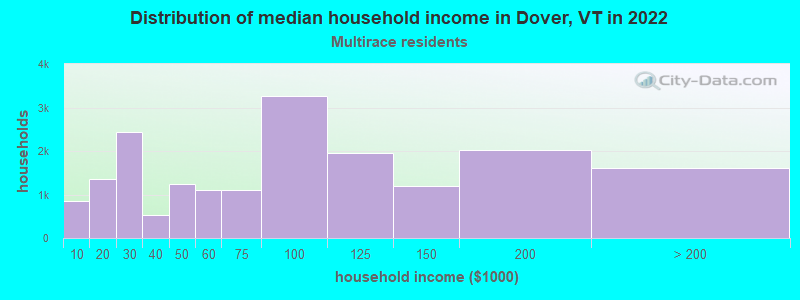
- $89,647Two or more races householders
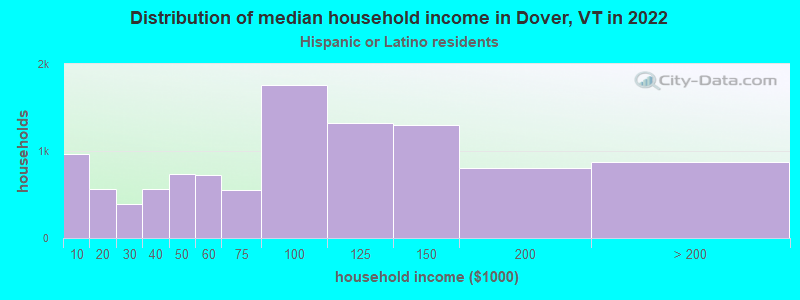
- $160,369Hispanic or Latino race householders
- Median 2022 house value
- $365,228White Non-Hispanic householders
- $186,595American Indian or Alaska Native householders
- $466,487Hispanic or Latino householders
Household income for White non-Hispanic householders
Household income for American Indian and Alaska Native householders
Household income for Two or more races householders
Household income for Hispanic or Latino race householders
Foreign-born residents in Dover
48 residents are foreign born (1.8% Europe, 0.8% Latin America, 0.5% North America).
| This city: | 3.4% |
| Vermont: | 3.8% |
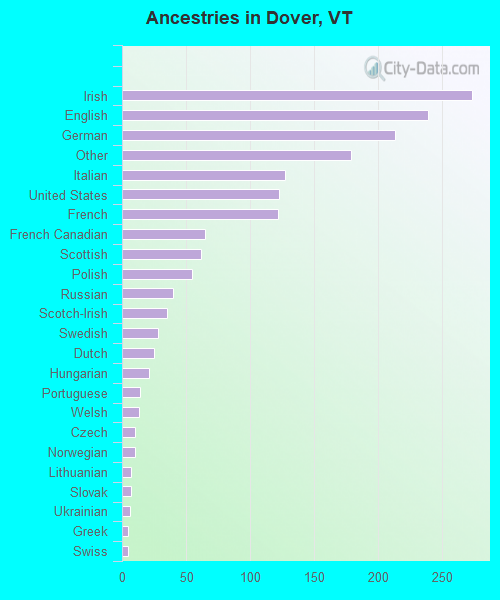
Ancestries in Dover

- 27316.2%Irish
- 23914.2%English
- 21312.6%German
- 17910.6%Other
- 1277.5%Italian
- 1237.3%United States
- 1227.2%French
- 653.9%French Canadian
- 623.7%Scottish
- 553.3%Polish
- 402.4%Russian
- 352.1%Scotch-Irish
- 281.7%Swedish
- 251.5%Dutch
- 211.2%Hungarian
- 140.8%Portuguese
- 130.8%Welsh
- 100.6%Czech
- 100.6%Norwegian
- 70.4%Lithuanian
- 70.4%Slovak
- 60.4%Ukrainian
- 50.3%Greek
- 50.3%Swiss
Zip codes: 05341.