District 7, Milestown, MD (Maryland) Houses and Residents
| District 7, Milestown: | $385,649 |
| Maryland: | $398,100 |
Total population: 3,639 (Urban population: 0, Rural population: 3,117 (181 farm, 2,936 nonfarm))
Houses: 1,580 (1,245 occupied: 1,036 owner occupied, 209 renter occupied)
| % of renters here: | 17% |
| State: | 32% |
Housing density: 60 houses/condos per square mile
Median price asked for vacant for-sale houses and condos in 2022 in this county: $475,864.
Median contract rent in 2022: $1,182 (lower quartile is $986, upper quartile is $1,578)
Median gross rent in District 7, Milestown, MD in 2022: $1,321
Housing units in District 7, Milestown with a mortgage: 515 (58 second mortgage, 101 home equity loan, 0 both second mortgage and home equity loan)
Houses without a mortgage: 349
Compare current foreclosures near District 7, Milestown, MD:
| Photo | Address | Area | Beds / Baths | Price | Details |
|---|---|---|---|---|---|

|
#1
River Springs Rd
Avenue, MD 20609
|
1,239 sq. feet
|
1 baths 2 beds |
$284,900
|
show details |

|
#2
Hickory Landing Way
Hollywood, MD 20636
|
1,659 sq. feet
|
2 baths 2 beds |
$149,900
|
show details |

|
#3
Baja Ln
Great Mills, MD 20634
|
1,056 sq. feet
|
1 baths 4 beds |
$100,000
|
show details |

|
#4
Douglas Cir
Mechanicsville, MD 20659
|
1,134 sq. feet
|
2 baths 3 beds |
show details | |

|
#5
Daniel Cir
Mechanicsville, MD 20659
|
1,332 sq. feet
|
2 baths 3 beds |
show details | |

|
#6
Holly Way
Colonial Beach, VA 22443
|
- sq. feet
|
1 baths 2 beds |
show details | |

|
#7
Owens Lndg
King George, VA 22485
|
1,404 sq. feet
|
2 baths 2 beds |
show details | |

|
#8
Village Ln
King George, VA 22485
|
2,176 sq. feet
|
2 baths 4 beds |
show details | |

|
#9
Nancy Ln
King George, VA 22485
|
3,344 sq. feet
|
3 baths 4 beds |
show details | |

|
#10
Sarah Ln
King George, VA 22485
|
1,652 sq. feet
|
2 baths 3 beds |
show details |
| Photo | Address | Area | Beds / Baths | Price | Details |
|---|---|---|---|---|---|

|
#11
Nancy Ln
King George, VA 22485
|
2,784 sq. feet
|
2 baths 3 beds |
show details | |

|
#12
Rosedale Dr
King George, VA 22485
|
1,272 sq. feet
|
2 baths 3 beds |
show details | |

|
#13
Berkley Ct
King George, VA 22485
|
4,076 sq. feet
|
2 baths 4 beds |
show details | |

|
#14
Saint Andrews Church Rd
California, MD 20619
|
1,456 sq. feet
|
2 baths - beds |
show details | |

|
#15
Lakeview Dr
Colonial Beach, VA 22443
|
2,556 sq. feet
|
1 baths - beds |
show details | |

|
#16
Holly Ln
Mechanicsville, MD 20659
|
1,656 sq. feet
|
2 baths - beds |
show details | |

|
#17
Keyport Ct
California, MD 20619
|
1,840 sq. feet
|
2 baths - beds |
show details | |

|
#18
Munley Ln
Lexington Park, MD 20653
|
1,860 sq. feet
|
2 baths - beds |
show details | |

|
#19
Baja Ln
Great Mills, MD 20634
|
1,056 sq. feet
|
1 baths - beds |
show details | |

|
#20
Barefoot Dr
California, MD 20619
|
1,947 sq. feet
|
2 baths - beds |
show details |
| Photo | Address | Area | Beds / Baths | Price | Details |
|---|---|---|---|---|---|

|
#21
Arlington Dr
Mechanicsville, MD 20659
|
1,528 sq. feet
|
1 baths - beds |
show details | |

|
#22
Edison Ct
Mechanicsville, MD 20659
|
1,916 sq. feet
|
2 baths - beds |
show details | |

|
#23
Redwood Ln
California, MD 20619
|
2,500 sq. feet
|
2 baths - beds |
show details | |

|
#24
Three Notch Rd
California, MD 20619
|
1,872 sq. feet
|
1 baths - beds |
show details | |

|
#25
Bent Oak Pl
Hughesville, MD 20637
|
3,692 sq. feet
|
2 baths - beds |
show details | |

|
#26
Jones Wharf Rd
Hollywood, MD 20636
|
1,212 sq. feet
|
1 baths - beds |
show details | |

|
#27
Veras Rd
Coltons Point, MD 20626
|
972 sq. feet
|
1 baths - beds |
show details | |

|
#28
Autumn Leaf Way
California, MD 20619
|
2,112 sq. feet
|
2 baths - beds |
show details | |

|
#29
Roundhill Rd
Charlotte Hall, MD 20622
|
1,806 sq. feet
|
2 baths - beds |
show details | |

|
#30
Vincent Cir
Mechanicsville, MD 20659
|
1,870 sq. feet
|
2 baths - beds |
show details |
| Photo | Address | Area | Beds / Baths | Price | Details |
|---|---|---|---|---|---|

|
#31
Flour Mill Ct
Great Mills, MD 20634
|
2,278 sq. feet
|
2 baths - beds |
show details | |

|
#32
Oaks Rd
Charlotte Hall, MD 20622
|
1,920 sq. feet
|
2 baths - beds |
show details | |

|
#33
Warwick Dr
Lexington Park, MD 20653
|
1,594 sq. feet
|
2 baths - beds |
show details | |

|
#34
Warwick Dr
Lexington Park, MD 20653
|
1,210 sq. feet
|
2 baths - beds |
show details | |

|
#35
Songbird Ln
Broomes Island, MD 20615
|
592 sq. feet
|
1 baths - beds |
show details | |

|
#36
Williams Wharf Rd
Saint Leonard, MD 20685
|
2,016 sq. feet
|
2 baths - beds |
show details | |

|
#37
Purple Martin Ct
Great Mills, MD 20634
|
1,308 sq. feet
|
2 baths - beds |
show details | |

|
#38
Kregel Ct
Lexington Park, MD 20653
|
1,984 sq. feet
|
2 baths - beds |
show details | |

|
#39
Shields Ct
California, MD 20619
|
1,092 sq. feet
|
1 baths - beds |
show details | |

|
#40
Calvert View Rd
Lexington Park, MD 20653
|
3,645 sq. feet
|
3 baths - beds |
show details |
| Photo | Address | Area | Beds / Baths | Price | Details |
|---|---|---|---|---|---|

|
#41
Gordon Rd
Kinsale, VA 22488
|
- sq. feet
|
2 baths 3 beds |
show details | |

|
#42
Golden Beach Rd
Mechanicsville, MD 20659
|
2,200 sq. feet
|
2 baths - beds |
show details | |

|
#43
Dudley Rd
Mechanicsville, MD 20659
|
1,834 sq. feet
|
2 baths - beds |
show details | |

|
#44
Washington Rd
Mechanicsville, MD 20659
|
1,285 sq. feet
|
2 baths - beds |
show details | |

|
#45
Calla Ln
Lexington Park, MD 20653
|
1,148 sq. feet
|
1 baths - beds |
show details | |

|
#46
Nomini Hall Rd
Hague, VA 22469
|
- sq. feet
|
2 baths 3 beds |
show details | |

|
#47
Corinthian Ct
Hughesville, MD 20637
|
4,008 sq. feet
|
4 baths - beds |
show details | |

|
#48
Evening Primrose Way
California, MD 20619
|
1,990 sq. feet
|
2 baths - beds |
show details | |

|
#49
Brigantine Ct
Great Mills, MD 20634
|
1,128 sq. feet
|
2 baths - beds |
show details | |

|
Check over 1 million property listings on Foreclosure.com!
|
browse all offers | |||

Household type by relationship:
Households: 102,225- In family households: 88,684 (19,558 male householders, 7,526 female householders)
20,870 spouses, 32,691 children (30,270 natural, 619 adopted, 1,802 stepchildren), 2,130 grandchildren, 753 brothers or sisters, 822 parents, foster children, 1,063 other relatives, 2,549 non-relatives
- In nonfamily households: 13,541 (5,680 male householders (4,251 living alone)), 4,840 female householders (3,932 living alone)), 3,021 nonrelatives
- In group quarters: 2,926 (923 institutionalized population)
17,120 married couples with children.
4,843 single-parent households (1,310 men, 3,533 women).
98.6% of residents of District 7, Milestown speak English at home.
0.6% of residents speak Spanish at home (74% speak English very well, 26% speak English not well).
0.7% of residents speak other Indo-European language at home (76% speak English very well, 24% speak English well).
Foreign born population: 21 (0.5%)
(109.5% of them are naturalized citizens)
| Here: | 7.2 |
| State: | 7.3 |
| Here: | 6.0 |
| State: | 4.2 |

- Bedrooms in owner-occupied houses and condos in District 7, Milestown, Maryland
- 0no bedroom
- 61 bedroom
- 2522 bedrooms
- 5283 bedrooms
- 1964 bedrooms
- 545+ bedrooms

- Bedrooms in renter-occupied apartments in District 7, Milestown, Maryland
- 0no bedroom
- 101 bedroom
- 872 bedrooms
- 653 bedrooms
- 374 bedrooms
- 105+ bedrooms

- Cars and other vehicles available in District 7, Milestown in owner-occupied houses/condos
- 60no vehicle
- 2001 vehicle
- 4662 vehicles
- 2103 vehicles
- 504 vehicles
- 505+ vehicles

- Cars and other vehicles available in District 7, Milestown in renter-occupied apartments
- 34no vehicle
- 941 vehicle
- 582 vehicles
- 183 vehicles
- 54 vehicles
- 05+ vehicles

- Rooms in owner-occupied houses in District 7, Milestown, Maryland
- 01 room
- 02 rooms
- 03 rooms
- 1204 rooms
- 1865 rooms
- 2676 rooms
- 1557 rooms
- 1628 rooms
- 1469+ rooms

- Rooms in renter-occupied apartments in District 7, Milestown, Maryland
- 01 room
- 02 rooms
- 103 rooms
- 544 rooms
- 495 rooms
- 456 rooms
- 227 rooms
- 118 rooms
- 189+ rooms


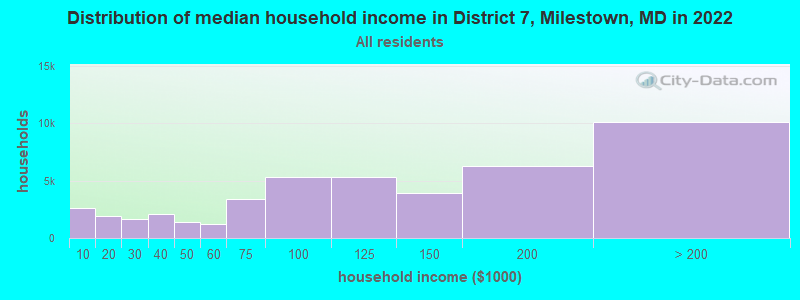
District 7, Milestown, MD household income distribution

- 2,656Less than $10,000
- 1,889$10,000 to $19,999
- 1,638$20,000 to $29,999
- 2,050$30,000 to $39,999
- 1,411$40,000 to $49,999
- 1,185$50,000 to $59,999
- 3,440$60,000 to $74,999
- 5,273$75,000 to $99,999
- 5,335$100,000 to $124,999
- 3,921$125,000 to $149,999
- 6,247$150,000 to $199,999
- 10,110$200,000 or more
Percentage of workers working in this county: 76.3%
Number of people working at home: 326 (17.7% of all workers)
Travel time to work (commute)
- Less than 5 minutes: 9
- 5 to 9 minutes: 69
- 10 to 14 minutes: 92
- 15 to 19 minutes: 94
- 20 to 24 minutes: 212
- 25 to 29 minutes: 79
- 30 to 34 minutes: 142
- 35 to 39 minutes: 81
- 40 to 44 minutes: 154
- 45 to 59 minutes: 226
- 60 to 89 minutes: 101
- 90 or more minutes: 176
Means of transportation to work:
- Drove a car alone: 1,218 (81.6%)
- Carpooled: 165 (11.1%)
- Bus or trolley bus: 31 (2.1%)
- Walked: 16 (1.1%)
- Other means: 5 (0.3%)
- Worked at home: 58 (3.9%)


- Year of entry for the foreign-born population in District 7, Milestown, Maryland
- 01995 to March 2000
- 01990 to 1994
- 01985 to 1989
- 01980 to 1984
- 01975 to 1979
- 01970 to 1974
- 01965 to 1969
- 14Before 1965
Most common places of birth for foreign-born residents (%):
| District 7, Milestown: | 57.1% (8) |
| Maryland: | 1.7% (9,019) |
| District 7, Milestown: | 42.9% (6) |
| Maryland: | 0.4% (2,102) |
Place of birth for U.S.-born residents:
- This state: 2,226
- Other state: 867
- Northeast: 145
- Midwest: 77
- South: 612
- West: 33
73% of District 7, Milestown residents lived in the same house 5 years ago.
Out of people who lived in different houses, 65% lived in this county.
Out of people who lived in different counties, 76% lived in Maryland.
Education attainment for males 25 years and older:
- No schooling: 0
- Nursery to 4th grade: 0
- 5th and 6th grade: 9
- 7th and 8th grade: 119
- 9th grade: 34
- 10th grade: 73
- 11th grade: 54
- 12th grade, no diploma: 24
- High school graduate (or equivalency): 466
- Less than 1 year of college: 84
- Some college more than 1 year, no degree: 96
- Associate degree: 19
- Bachelor's degree: 88
- Master's degree: 29
- Professional school degree: 17
- Doctorate degree: 16

Education attainment for females 25 years and older:
- No schooling: 0
- Nursery to 4th grade: 11
- 5th and 6th grade: 15
- 7th and 8th grade: 69
- 9th grade: 28
- 10th grade: 45
- 11th grade: 37
- 12th grade, no diploma: 32
- High school graduate (or equivalency): 513
- Less than 1 year of college: 91
- Some college more than 1 year, no degree: 176
- Associate degree: 47
- Bachelor's degree: 67
- Master's degree: 31
- Professional school degree: 0
- Doctorate degree: 0


Housing units in structures:
- One, detached: 1,437
- One, attached: 16
- Two: 11
- 3 or 4: 6
- 5 to 9: 20
- Mobile homes: 90
Median worth of mobile homes: $22,627
Housing units lacking complete kitchen facilities: 3.0%

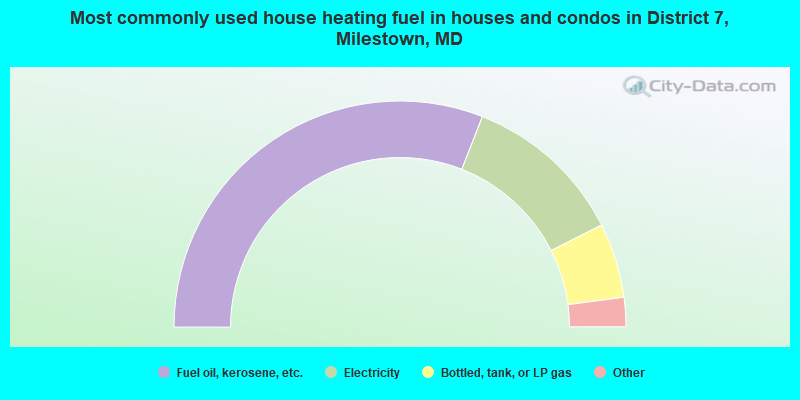
- 61.9%Fuel oil, kerosene, etc.
- 23.2%Electricity
- 10.7%Bottled, tank, or LP gas
- 2.8%Wood
- 1.4%Utility gas
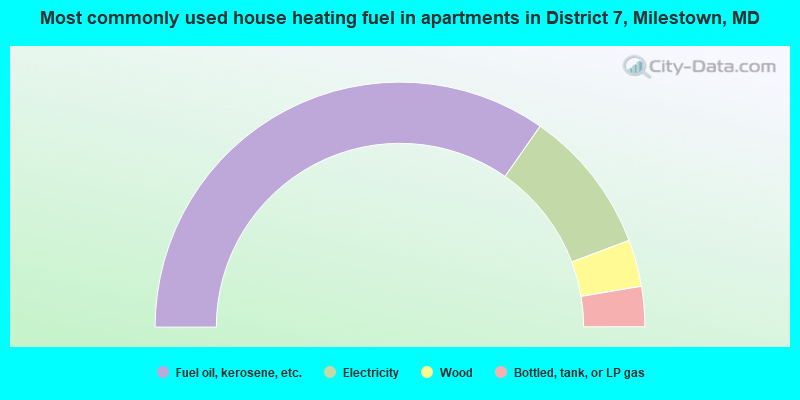
- 69.4%Fuel oil, kerosene, etc.
- 19.1%Electricity
- 6.2%Wood
- 5.3%Bottled, tank, or LP gas
Private vs. public school enrollment:
| Here: | 21.5% |
| Maryland: | 14.8% |
| Here: | 16.9% |
| Maryland: | 13.3% |
| Here: | 0.0% |
| Maryland: | 21.7% |


