District 7, Milestown, Maryland (MD) income map, earnings map, and wages data
The median household income in District 7, Milestown, MD in 2022 was $115,675, which was 17.9% greater than the median annual income of $94,991 across the entire state of Maryland. Compared to the median income of $55,648 in 2000 this represents an increase of 51.9%. The per capita income in 2022 was $61,677, which means an increase of 58.3% compared to 2000 when it was $25,722.
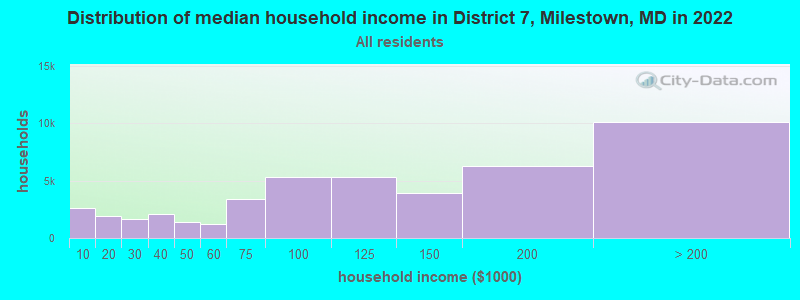
Income statistics for all residents
Median household income in District 7, Milestown, MD in 2022:| District 7, Milestown: | $115,675 |
| State: | $94,991 |
Change in median household income between 2000 and 2022:| District 7, Milestown, Maryland: | +107.9% |
| State: | +79.7% |
Number of households with income < $10k:| District 7, Milestown: | 5.9% (2,656) |
| Maryland: | 4.8% (114,450) |
Number of households with income $10k - 20k:| District 7, Milestown: | 4.2% (1,889) |
| Maryland: | 5.0% (117,883) |
Number of households with income $20k - 30k:| District 7, Milestown: | 3.6% (1,638) |
| Maryland: | 5.2% (123,350) |
Number of households with income $30k - 40k:| District 7, Milestown: | 4.5% (2,050) |
| Maryland: | 5.6% (134,104) |
Number of households with income $40k - 50k:| District 7, Milestown: | 3.1% (1,411) |
| State: | 5.6% (132,932) |
Number of households with income $50k - 60k:| District 7, Milestown: | 2.6% (1,185) |
| Maryland: | 5.6% (132,707) |
Number of households with income $60k - 75k:| District 7, Milestown: | 7.6% (3,440) |
| State: | 7.9% (188,335) |
Number of households with income $75k - 100k:| District 7, Milestown: | 11.7% (5,273) |
| Maryland: | 12.5% (297,873) |
Number of households with income $100k - 125k:| District 7, Milestown: | 11.8% (5,335) |
| State: | 10.5% (250,497) |
Number of households with income $125k - 150k:| District 7, Milestown: | 8.7% (3,921) |
| State: | 8.1% (193,208) |
Number of households with income $150k - 200k:| District 7, Milestown: | 13.8% (6,247) |
| Maryland: | 11.6% (274,905) |
Number of households with income > $200k:| District 7, Milestown: | 22.4% (10,110) |
| State: | 17.5% (415,740) |
Aggregate household income in District 7, Milestown in 2022: $257,028,370
Median family income in District 7, Milestown in 2022:| District 7, Milestown: | $135,913 |
| State: | $117,294 |
Median non-family income in District 7, Milestown in 2022:| District 7, Milestown: | $38,265 |
| State: | $57,179 |
Change in median non-family income between 2000 and 2022:| District 7, Milestown, Maryland: | +84.4% |
| Maryland: | +75.1% |
Median per capita income in District 7, Milestown in 2022:| District 7, Milestown: | $61,677 |
| State: | $49,236 |
Change in median per capita income between 2000 and 2022:| District 7, Milestown, Maryland: | +139.8% |
| Maryland: | +92.2% |
Income statistics for White residents
Median household income in District 7, Milestown, MD in 2022:| District 7, Milestown: | $120,663 |
| Maryland: | $107,160 |
Change in median household income between 2000 and 2022:| District 7, Milestown, Maryland: | +113.4% |
| Maryland: | +85.3% |
Number of households with income < $10k:| District 7, Milestown: | 6.5% (2,065) |
| State: | 3.7% (47,387) |
Number of households with income $10k - 20k:| District 7, Milestown: | 2.7% (856) |
| Maryland: | 4.1% (52,102) |
Number of households with income $20k - 30k:| District 7, Milestown: | 2.6% (842) |
| Maryland: | 4.6% (58,758) |
Number of households with income $30k - 40k:| District 7, Milestown: | 3.3% (1,059) |
| State: | 4.7% (59,745) |
Number of households with income $40k - 50k:| District 7, Milestown: | 2.1% (665) |
| Maryland: | 5.0% (62,576) |
Number of households with income $50k - 60k:| District 7, Milestown: | 2.8% (894) |
| State: | 5.1% (64,484) |
Number of households with income $60k - 75k:| District 7, Milestown: | 7.3% (2,341) |
| State: | 7.7% (97,019) |
Number of households with income $75k - 100k:| District 7, Milestown: | 10.2% (3,266) |
| State: | 11.8% (149,205) |
Number of households with income $100k - 125k:| District 7, Milestown: | 13.8% (4,419) |
| State: | 10.6% (134,231) |
Number of households with income $125k - 150k:| District 7, Milestown: | 9.1% (2,907) |
| Maryland: | 8.8% (111,081) |
Number of households with income $150k - 200k:| District 7, Milestown: | 16.0% (5,118) |
| Maryland: | 12.9% (162,966) |
Number of households with income > $200k:| District 7, Milestown: | 23.6% (7,529) |
| State: | 20.9% (264,377) |
Aggregate household income in District 7, Milestown in 2022: $203,960,979
Median family income in District 7, Milestown in 2022:| District 7, Milestown: | $151,236 |
| State: | $134,708 |
Number of families with income < $10k:| District 7, Milestown: | 2.6% (33) |
| Maryland: | 1.6% (13,064) |
Number of families with income $10k - 20k:| District 7, Milestown: | 0.4% (5) |
| Maryland: | 2.0% (16,048) |
Number of families with income $20k - 30k:| District 7, Milestown: | 0.9% (11) |
| State: | 2.2% (18,018) |
Number of families with income $30k - 40k:| District 7, Milestown: | 1.9% (23) |
| State: | 3.3% (26,886) |
Number of families with income $40k - 50k:| District 7, Milestown: | 0.5% (7) |
| State: | 3.6% (29,194) |
Number of families with income $50k - 60k:| District 7, Milestown: | 1.9% (24) |
| State: | 4.1% (33,120) |
Number of families with income $60k - 75k:| District 7, Milestown: | 6.7% (84) |
| Maryland: | 6.6% (53,501) |
Number of families with income $75k - 100k:| District 7, Milestown: | 6.7% (83) |
| State: | 11.3% (91,779) |
Number of families with income $100k - 125k:| District 7, Milestown: | 11.1% (139) |
| State: | 11.3% (91,483) |
Number of families with income $125k - 150k:| District 7, Milestown: | 4.5% (56) |
| Maryland: | 9.9% (80,832) |
Number of families with income $150k - 200k:| District 7, Milestown: | 22.0% (275) |
| State: | 16.0% (130,295) |
Number of families with income > $200k:| District 7, Milestown: | 40.9% (511) |
| State: | 28.1% (228,324) |
Median non-family income in District 7, Milestown in 2022:| District 7, Milestown: | $34,830 |
| Maryland: | $61,991 |
Change in median non-family income between 2000 and 2022:| District 7, Milestown, Maryland: | +80.8% |
| State: | +76.8% |
Median per capita income in District 7, Milestown in 2022:| District 7, Milestown: | $68,359 |
| State: | $59,750 |
Income statistics for Black or African American residents
Median household income in District 7, Milestown, MD in 2022:| District 7, Milestown: | $88,239 |
| State: | $77,368 |
Change in median household income between 2000 and 2022:| District 7, Milestown, Maryland: | +122.1% |
| State: | +85.7% |
Number of households with income < $10k:| District 7, Milestown: | 7.0% (23,884) |
| State: | 7.0% (50,093) |
Number of households with income $10k - 20k:| District 7, Milestown: | 7.2% (24,728) |
| Maryland: | 7.2% (51,849) |
Number of households with income $20k - 30k:| District 7, Milestown: | 5.8% (19,796) |
| State: | 5.8% (41,510) |
Number of households with income $30k - 40k:| District 7, Milestown: | 6.9% (23,585) |
| State: | 6.9% (49,466) |
Number of households with income $40k - 50k:| District 7, Milestown: | 6.6% (22,674) |
| State: | 6.6% (47,557) |
Number of households with income $50k - 60k:| District 7, Milestown: | 6.2% (21,366) |
| State: | 6.2% (44,818) |
Number of households with income $60k - 75k:| District 7, Milestown: | 8.6% (29,433) |
| Maryland: | 8.6% (61,728) |
Number of households with income $75k - 100k:| District 7, Milestown: | 13.2% (45,353) |
| State: | 13.2% (95,107) |
Number of households with income $100k - 125k:| District 7, Milestown: | 10.2% (35,085) |
| State: | 10.2% (73,579) |
Number of households with income $125k - 150k:| District 7, Milestown: | 7.2% (24,783) |
| Maryland: | 7.2% (51,970) |
Number of households with income $150k - 200k:| District 7, Milestown: | 9.4% (32,248) |
| State: | 9.4% (67,623) |
Number of households with income > $200k:| District 7, Milestown: | 11.7% (40,009) |
| Maryland: | 11.7% (83,862) |
Aggregate household income in District 7, Milestown in 2022: $32,388,592
Median family income in District 7, Milestown in 2022:| District 7, Milestown: | $121,479 |
| State: | $96,241 |
Number of families with income $10k - 20k:| District 7, Milestown: | 15.8% (14) |
| State: | 3.8% (16,604) |
Number of families with income $20k - 30k:| District 7, Milestown: | 8.1% (7) |
| Maryland: | 4.3% (18,629) |
Number of families with income $30k - 40k:| District 7, Milestown: | 3.5% (3) |
| Maryland: | 6.1% (26,770) |
Number of families with income $50k - 60k:| District 7, Milestown: | 12.7% (11) |
| State: | 5.9% (25,636) |
Number of families with income $60k - 75k:| District 7, Milestown: | 34.7% (31) |
| State: | 8.0% (35,163) |
Number of families with income $75k - 100k:| District 7, Milestown: | 25.2% (23) |
| State: | 12.8% (55,976) |
Median non-family income in District 7, Milestown in 2022:| District 7, Milestown: | $52,475 |
| Maryland: | $49,944 |
Change in median non-family income between 2000 and 2022:| District 7, Milestown, Maryland: | +67.9% |
| State: | +71.8% |
Median per capita income in District 7, Milestown in 2022:| District 7, Milestown: | $45,255 |
| State: | $40,756 |
Change in median per capita income between 2000 and 2022:| District 7, Milestown, Maryland: | +145.0% |
| State: | +113.5% |
Income statistics for Hispanic or Latino residents
Median household income in District 7, Milestown, MD in 2022:| District 7, Milestown: | $100,622 |
| Maryland: | $82,138 |
Change in median household income between 2000 and 2022:| District 7, Milestown, Maryland: | +33.3% |
| State: | +70.2% |
Number of households with income < $10k:| District 7, Milestown: | 3.7% (5,296) |
| State: | 3.7% (6,871) |
Number of households with income $10k - 20k:| District 7, Milestown: | 3.0% (4,298) |
| Maryland: | 2.9% (5,465) |
Number of households with income $20k - 30k:| District 7, Milestown: | 6.0% (8,628) |
| State: | 5.9% (11,012) |
Number of households with income $30k - 40k:| District 7, Milestown: | 7.9% (11,462) |
| State: | 7.9% (14,668) |
Number of households with income $40k - 50k:| District 7, Milestown: | 7.6% (11,030) |
| State: | 7.6% (14,074) |
Number of households with income $50k - 60k:| District 7, Milestown: | 7.7% (11,079) |
| State: | 7.6% (14,166) |
Number of households with income $60k - 75k:| District 7, Milestown: | 10.0% (14,419) |
| Maryland: | 9.9% (18,486) |
Number of households with income $75k - 100k:| District 7, Milestown: | 16.2% (23,391) |
| State: | 16.1% (30,032) |
Number of households with income $100k - 125k:| District 7, Milestown: | 9.4% (13,562) |
| Maryland: | 9.4% (17,432) |
Number of households with income $125k - 150k:| District 7, Milestown: | 7.5% (10,812) |
| State: | 7.5% (13,963) |
Number of households with income $150k - 200k:| District 7, Milestown: | 10.0% (14,521) |
| State: | 10.1% (18,750) |
Number of households with income > $200k:| District 7, Milestown: | 11.3% (16,293) |
| Maryland: | 11.4% (21,133) |
Aggregate household income in District 7, Milestown in 2022: $9,604,099
Median family income in District 7, Milestown in 2022:| District 7, Milestown: | $95,861 |
| State: | $80,127 |
Number of families with income < $10k:| District 7, Milestown: | 6.9% (6) |
| Maryland: | 3.1% (4,499) |
Number of families with income $10k - 20k:| District 7, Milestown: | 2.9% (3) |
| State: | 2.2% (3,250) |
Number of families with income $20k - 30k:| District 7, Milestown: | 5.7% (5) |
| Maryland: | 6.8% (10,000) |
Number of families with income $30k - 40k:| District 7, Milestown: | 8.3% (8) |
| State: | 7.6% (11,123) |
Number of families with income $40k - 50k:| District 7, Milestown: | 9.4% (9) |
| Maryland: | 8.1% (11,900) |
Number of families with income $50k - 60k:| District 7, Milestown: | 8.0% (7) |
| State: | 8.5% (12,561) |
Number of families with income $60k - 75k:| District 7, Milestown: | 13.9% (13) |
| State: | 10.2% (15,051) |
Number of families with income $75k - 100k:| District 7, Milestown: | 13.0% (12) |
| State: | 14.6% (21,440) |
Number of families with income $100k - 125k:| District 7, Milestown: | 10.2% (9) |
| State: | 9.6% (14,146) |
Number of families with income $125k - 150k:| District 7, Milestown: | 4.2% (4) |
| Maryland: | 6.9% (10,202) |
Number of families with income $150k - 200k:| District 7, Milestown: | 10.1% (9) |
| State: | 10.7% (15,752) |
Number of families with income > $200k:| District 7, Milestown: | 7.5% (7) |
| Maryland: | 11.6% (17,028) |
Median per capita income in District 7, Milestown in 2022:| District 7, Milestown: | $89,580 |
| State: | $29,024 |
Change in median per capita income between 2000 and 2022:| District 7, Milestown, Maryland: | +127.6% |
| Maryland: | +79.2% |
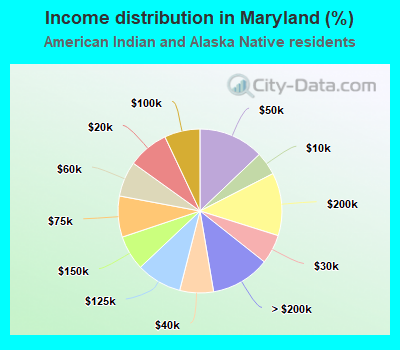
Income statistics for American Indian and Alaska Native residents
Number of households with income < $10k:| District 7, Milestown: | 6.7% (1) |
| State: | 4.6% (360) |
Number of households with income $10k - 20k:| District 7, Milestown: | 6.7% (1) |
| State: | 8.1% (632) |
Number of households with income $20k - 30k:| District 7, Milestown: | 6.7% (1) |
| State: | 5.8% (454) |
Number of households with income $30k - 40k:| District 7, Milestown: | 6.7% (1) |
| State: | 6.7% (522) |
Number of households with income $40k - 50k:| District 7, Milestown: | 13.3% (2) |
| State: | 12.9% (1,010) |
Number of households with income $50k - 60k:| District 7, Milestown: | 6.7% (1) |
| State: | 7.0% (546) |
Number of households with income $60k - 75k:| District 7, Milestown: | 6.7% (1) |
| State: | 8.1% (635) |
Number of households with income $75k - 100k:| District 7, Milestown: | 6.7% (1) |
| Maryland: | 7.0% (551) |
Number of households with income $100k - 125k:| District 7, Milestown: | 6.7% (1) |
| State: | 9.0% (702) |
Number of households with income $125k - 150k:| District 7, Milestown: | 6.7% (1) |
| State: | 6.9% (541) |
Number of households with income $150k - 200k:| District 7, Milestown: | 13.3% (2) |
| State: | 12.4% (972) |
Number of households with income > $200k:| District 7, Milestown: | 13.3% (2) |
| State: | 11.7% (916) |
Aggregate household income in District 7, Milestown in 2022: $1,173,264
Median per capita income in District 7, Milestown in 2022:| District 7, Milestown: | $75,892 |
| State: | $35,089 |
Change in median per capita income between 2000 and 2022:| District 7, Milestown, Maryland: | +45.6% |
| Maryland: | +56.2% |
Income statistics for Multirace residents
Median household income in District 7, Milestown, MD in 2022:| District 7, Milestown: | $19,137 |
| State: | $99,027 |
Number of households with income < $10k:| District 7, Milestown: | 4.8% (433) |
| State: | 4.8% (6,469) |
Number of households with income $10k - 20k:| District 7, Milestown: | 3.3% (299) |
| State: | 3.3% (4,464) |
Number of households with income $20k - 30k:| District 7, Milestown: | 5.8% (523) |
| Maryland: | 5.8% (7,826) |
Number of households with income $30k - 40k:| District 7, Milestown: | 8.1% (736) |
| Maryland: | 8.1% (11,077) |
Number of households with income $40k - 50k:| District 7, Milestown: | 4.4% (396) |
| State: | 4.3% (5,895) |
Number of households with income $50k - 60k:| District 7, Milestown: | 4.0% (358) |
| State: | 3.9% (5,346) |
Number of households with income $60k - 75k:| District 7, Milestown: | 6.8% (612) |
| Maryland: | 6.7% (9,159) |
Number of households with income $75k - 100k:| District 7, Milestown: | 13.6% (1,227) |
| Maryland: | 13.6% (18,420) |
Number of households with income $100k - 125k:| District 7, Milestown: | 12.9% (1,169) |
| Maryland: | 12.9% (17,488) |
Number of households with income $125k - 150k:| District 7, Milestown: | 8.1% (733) |
| State: | 8.1% (11,039) |
Number of households with income $150k - 200k:| District 7, Milestown: | 11.5% (1,044) |
| Maryland: | 11.5% (15,675) |
Number of households with income > $200k:| District 7, Milestown: | 16.8% (1,523) |
| State: | 17.0% (23,059) |
Aggregate household income in District 7, Milestown in 2022: $1,197,741
Median non-family income in District 7, Milestown in 2022:| District 7, Milestown: | $17,890 |
| State: | $60,702 |
Median per capita income in District 7, Milestown in 2022:| District 7, Milestown: | $7,553 |
| State: | $35,630 |
Income statistics for other residents
Number of households with income < $10k:| District 7, Milestown: | 3.4% (1,332) |
| State: | 3.4% (3,746) |
Number of households with income $10k - 20k:| District 7, Milestown: | 3.5% (1,366) |
| Maryland: | 3.5% (3,842) |
Number of households with income $20k - 30k:| District 7, Milestown: | 7.6% (2,966) |
| State: | 7.6% (8,343) |
Number of households with income $30k - 40k:| District 7, Milestown: | 7.5% (2,934) |
| State: | 7.5% (8,251) |
Number of households with income $40k - 50k:| District 7, Milestown: | 8.6% (3,347) |
| Maryland: | 8.6% (9,414) |
Number of households with income $50k - 60k:| District 7, Milestown: | 10.0% (3,928) |
| State: | 10.0% (11,048) |
Number of households with income $60k - 75k:| District 7, Milestown: | 11.2% (4,387) |
| Maryland: | 11.2% (12,339) |
Number of households with income $75k - 100k:| District 7, Milestown: | 17.5% (6,854) |
| State: | 17.5% (19,277) |
Number of households with income $100k - 125k:| District 7, Milestown: | 8.9% (3,489) |
| Maryland: | 8.9% (9,813) |
Number of households with income $125k - 150k:| District 7, Milestown: | 6.3% (2,456) |
| Maryland: | 6.3% (6,907) |
Number of households with income $150k - 200k:| District 7, Milestown: | 8.2% (3,208) |
| State: | 8.2% (9,023) |
Number of households with income > $200k:| District 7, Milestown: | 7.3% (2,857) |
| Maryland: | 7.3% (8,036) |
Median per capita income in District 7, Milestown in 2022:| District 7, Milestown: | $9,898 |
| State: | $24,415 |
Change in median per capita income between 2000 and 2022:| District 7, Milestown, Maryland: | +98.0% |
| State: | +73.6% |