District 4, Creagerstown, MD (Maryland) Houses and Residents
| District 4, Creagerstown: | $478,464 |
| Maryland: | $398,100 |
Total population: 1,440 (Urban population: 0, Rural population: 1,227 (119 farm, 1,108 nonfarm))
Houses: 488 (472 occupied: 393 owner occupied, 79 renter occupied)
| % of renters here: | 17% |
| State: | 32% |
Housing density: 25 houses/condos per square mile
Median price asked for vacant for-sale houses and condos in 2022 in this county: $402,870.
Median contract rent in 2022: $1,122 (lower quartile is $909, upper quartile is $1,806)
Median rent asked for vacant for-rent units in 2022: $2,312
Median gross rent in District 4, Creagerstown, MD in 2022: $1,334
Housing units in District 4, Creagerstown with a mortgage: 168 (44 second mortgage, 16 home equity loan, 0 both second mortgage and home equity loan)
Houses without a mortgage: 89
Compare current foreclosures near District 4, Creagerstown, MD:


Household type by relationship:
Households: 229,203- In family households: 199,111 (45,130 male householders, 16,068 female householders)
49,048 spouses, 71,169 children (66,662 natural, 1,549 adopted, 2,958 stepchildren), 3,868 grandchildren, 1,839 brothers or sisters, 2,153 parents, foster children, 2,881 other relatives, 5,194 non-relatives
- In nonfamily households: 30,092 (10,870 male householders (8,043 living alone)), 12,732 female householders (10,582 living alone)), 6,490 nonrelatives
- In group quarters: 4,182 (1,640 institutionalized population)
41,250 married couples with children.
8,777 single-parent households (2,130 men, 6,647 women).
99.6% of residents of District 4, Creagerstown speak English at home.
0.4% of residents speak Spanish at home (100% speak English very well).
Foreign born population: 140 (7.8%)
(108.6% of them are naturalized citizens)
| Here: | 6.5 |
| State: | 7.3 |
| Here: | 5.9 |
| State: | 4.2 |

- Bedrooms in owner-occupied houses and condos in District 4, Creagerstown, Maryland
- 0no bedroom
- 91 bedroom
- 332 bedrooms
- 2373 bedrooms
- 1044 bedrooms
- 105+ bedrooms

- Bedrooms in renter-occupied apartments in District 4, Creagerstown, Maryland
- 5no bedroom
- 01 bedroom
- 282 bedrooms
- 353 bedrooms
- 114 bedrooms
- 05+ bedrooms

- Cars and other vehicles available in District 4, Creagerstown in owner-occupied houses/condos
- 8no vehicle
- 771 vehicle
- 1372 vehicles
- 1273 vehicles
- 304 vehicles
- 145+ vehicles

- Cars and other vehicles available in District 4, Creagerstown in renter-occupied apartments
- 0no vehicle
- 441 vehicle
- 212 vehicles
- 03 vehicles
- 74 vehicles
- 75+ vehicles

- Rooms in owner-occupied houses in District 4, Creagerstown, Maryland
- 01 room
- 02 rooms
- 03 rooms
- 224 rooms
- 445 rooms
- 1206 rooms
- 837 rooms
- 508 rooms
- 749+ rooms

- Rooms in renter-occupied apartments in District 4, Creagerstown, Maryland
- 51 room
- 02 rooms
- 03 rooms
- 74 rooms
- 145 rooms
- 356 rooms
- 137 rooms
- 58 rooms
- 09+ rooms


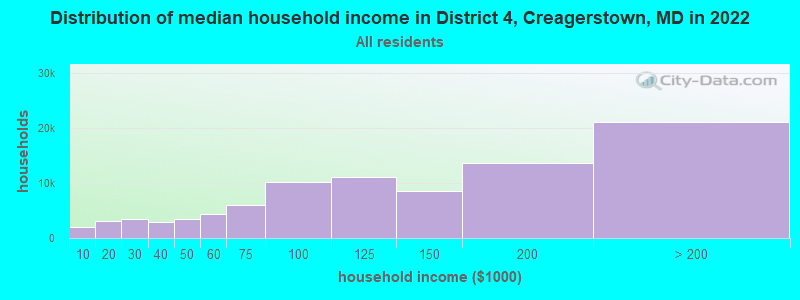
District 4, Creagerstown, MD household income distribution

- 2,046Less than $10,000
- 3,137$10,000 to $19,999
- 3,437$20,000 to $29,999
- 2,929$30,000 to $39,999
- 3,445$40,000 to $49,999
- 4,303$50,000 to $59,999
- 5,968$60,000 to $74,999
- 10,256$75,000 to $99,999
- 11,088$100,000 to $124,999
- 8,533$125,000 to $149,999
- 13,583$150,000 to $199,999
- 21,098$200,000 or more
Percentage of workers working in this county: 93.6%
Number of people working at home: 211 (21.8% of all workers)
Travel time to work (commute)
- Less than 5 minutes: 31
- 5 to 9 minutes: 43
- 10 to 14 minutes: 52
- 15 to 19 minutes: 76
- 20 to 24 minutes: 55
- 25 to 29 minutes: 88
- 30 to 34 minutes: 92
- 35 to 39 minutes: 0
- 40 to 44 minutes: 23
- 45 to 59 minutes: 58
- 60 to 89 minutes: 61
- 90 or more minutes: 31
Means of transportation to work:
- Drove a car alone: 536 (83.1%)
- Carpooled: 52 (8.1%)
- Walked: 22 (3.4%)
- Worked at home: 35 (5.4%)


- Year of entry for the foreign-born population in District 4, Creagerstown, Maryland
- 01995 to March 2000
- 01990 to 1994
- 01985 to 1989
- 01980 to 1984
- 01975 to 1979
- 01970 to 1974
- 01965 to 1969
- 27Before 1965
Most common places of birth for foreign-born residents (%):
| District 4, Creagerstown: | 59.3% (16) |
| Maryland: | 0.2% (1,259) |
| District 4, Creagerstown: | 40.7% (11) |
| Maryland: | 0.8% (4,318) |
Place of birth for U.S.-born residents:
- This state: 737
- Other state: 463
- Northeast: 229
- Midwest: 72
- South: 157
- West: 5
75% of District 4, Creagerstown residents lived in the same house 5 years ago.
Out of people who lived in different houses, 63% lived in this county.
Out of people who lived in different counties, 19% lived in Maryland.
Education attainment for males 25 years and older:
- No schooling: 0
- Nursery to 4th grade: 0
- 5th and 6th grade: 0
- 7th and 8th grade: 29
- 9th grade: 7
- 10th grade: 19
- 11th grade: 0
- 12th grade, no diploma: 6
- High school graduate (or equivalency): 204
- Less than 1 year of college: 15
- Some college more than 1 year, no degree: 24
- Associate degree: 34
- Bachelor's degree: 41
- Master's degree: 12
- Professional school degree: 6
- Doctorate degree: 6

Education attainment for females 25 years and older:
- No schooling: 0
- Nursery to 4th grade: 0
- 5th and 6th grade: 0
- 7th and 8th grade: 22
- 9th grade: 5
- 10th grade: 28
- 11th grade: 7
- 12th grade, no diploma: 0
- High school graduate (or equivalency): 218
- Less than 1 year of college: 44
- Some college more than 1 year, no degree: 78
- Associate degree: 24
- Bachelor's degree: 62
- Master's degree: 11
- Professional school degree: 0
- Doctorate degree: 0


Housing units in structures:
- One, detached: 433
- Two: 6
- 3 or 4: 7
- 5 to 9: 7
- Mobile homes: 35
Median worth of mobile homes: $71,268
Housing units lacking complete kitchen facilities: 1.0%

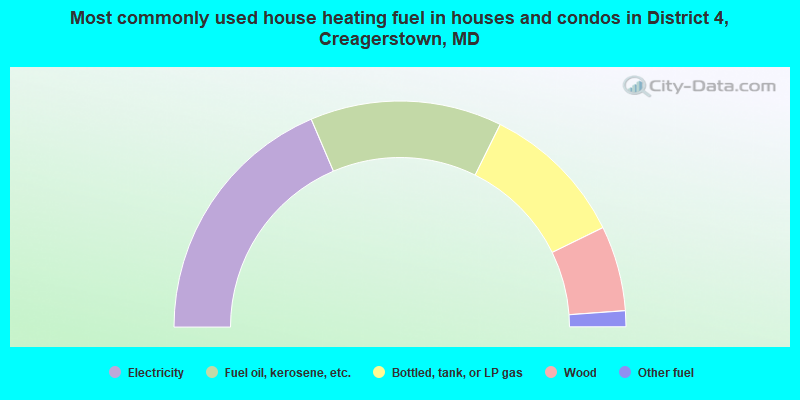
- 37.2%Electricity
- 27.5%Fuel oil, kerosene, etc.
- 20.9%Bottled, tank, or LP gas
- 12.2%Wood
- 2.3%Other fuel
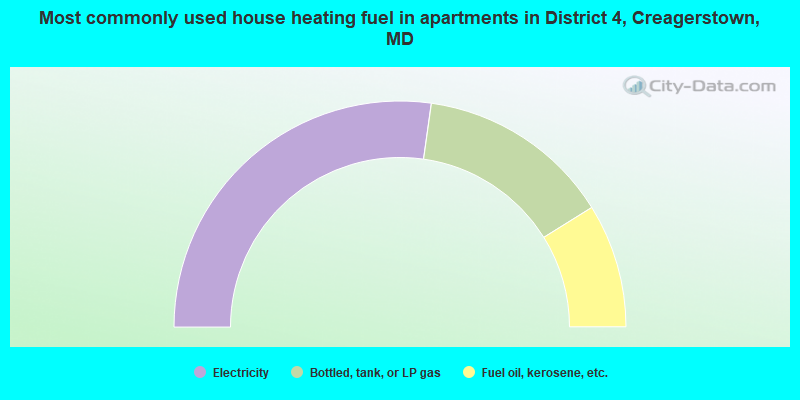
- 54.4%Electricity
- 27.8%Bottled, tank, or LP gas
- 17.7%Fuel oil, kerosene, etc.
Private vs. public school enrollment:
| Here: | 18.5% |
| Maryland: | 14.8% |
| Here: | 0.0% |
| Maryland: | 13.3% |
| Here: | 0.0% |
| Maryland: | 21.7% |


