Denton, TX (Texas) Houses and Residents
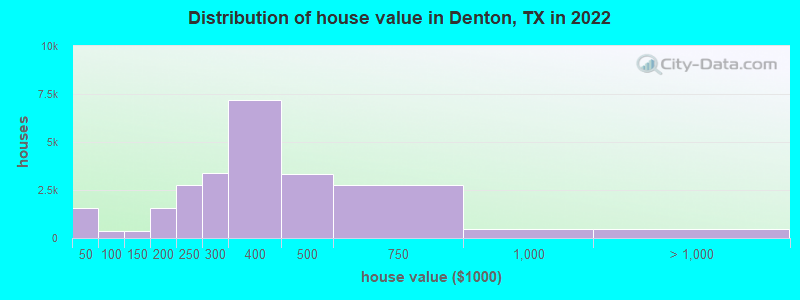
Estimated median house or condo value in 2022: $332,200 (it was $98,600 in 2000 )
Denton:
$332,200Texas:
$275,400
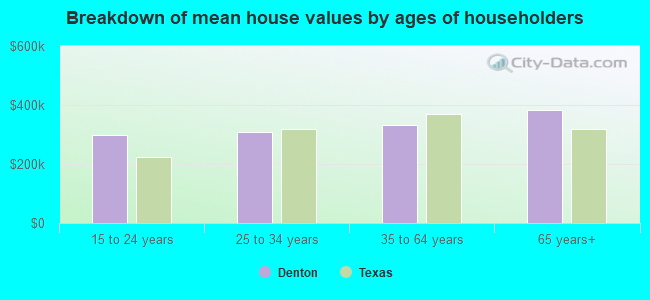
Lower value quartile - upper value quartile: $248,200 - $424,600Mean price in 2022: Detached houses: $304,338 Here:
$304,338State:
$369,058
Townhouses or other attached units: $232,188 Here:
$232,188State:
$327,631
In 2-unit structures: $372,107 Here:
$372,107State:
$374,947
In 5-or-more-unit structures: $170,509 Here:
$170,509State:
$413,944
Mobile homes: $25,674 Here:
$25,674State:
$124,413
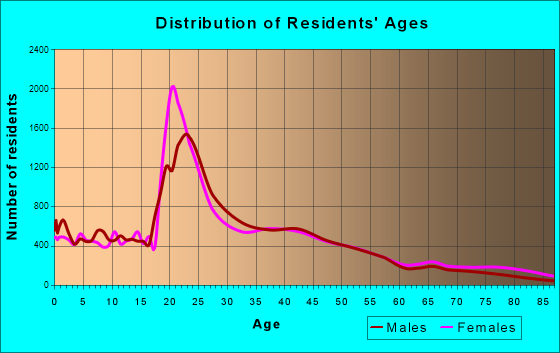
Total population: 128,205 (Urban population: 79,502, Rural population: 1,076 (86 farm, 990 nonfarm ))
Houses: 59,244 (56,771 occupied: 29,514 owner occupied, 27,257 renter occupied )
% of renters here:
48%State:
38%
Housing density: 963 houses/condos per square mile
Median price asked for vacant for-sale houses and condos in 2022: $191,537.
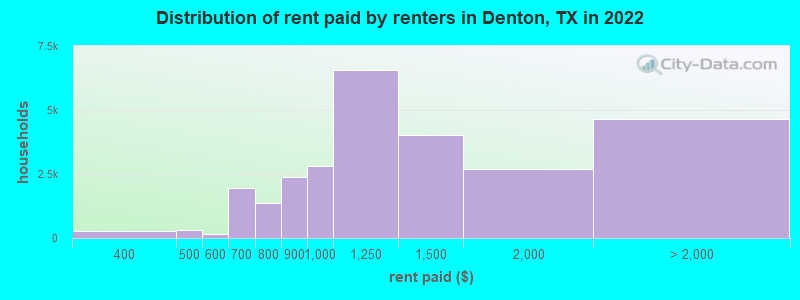
Median contract rent in 2022: $1,136 (lower quartile is $897, upper quartile is $1,464)
Median rent asked for vacant for-rent units in 2022: $981
Median gross rent in Denton, TX in 2022: $1,271
Housing units in Denton with a mortgage: 19,340 (798 second mortgage, 0 home equity loan, 580 both second mortgage and home equity loan )Houses without a mortgage: 166
Median household income for houses/condos with a mortgage: $113,481
Median household income for apartments without a mortgage: $81,207
Median monthly housing costs: $1,404
Data:
Median house or condo value ($)
Median house or condo value ($ change since 2000)
Median house or condo value ($) - White
Median house or condo value ($) - Black or African American
Median house or condo value ($) - Asian
Median house or condo value ($) - Hispanic or Latino
Median house or condo value ($) - American Indian and Alaska Native
Median house or condo value ($) - Multirace
Median house or condo value ($) - Other Race
Median price asked for mobile homes ($)
Household density (households per square mile)
Mean house or condo value by units in structure - 1, detached ($)
Mean house or condo value by units in structure - 1, attached ($)
Mean house or condo value by units in structure - 2 ($)
Mean house or condo value by units in structure by units in structure - 3 or 4 ($)
Mean house or condo value by units in structure - 5 or more ($)
Mean house or condo value by units in structure - Boat, RV, van, etc. ($)
Mean house or condo value by units in structure - Mobile home ($)
Median contract rent ($)
Median contract rent - Lower quartile ($)
Median contract rent - Upper quartile ($)
Median gross rent ($)
Urban houses (%)
Rural houses (%)
Houses occupied (%)
Houses occupied (% change since 2000)
Houses owner occupied (%)
Houses owner occupied (% change since 2000)
Houses renter occupied (%)
Houses renter occupied (% change since 2000)
Vacant housing units - For rent (%)
Vacant housing units - For rent (% change since 2000)
Vacant housing units - For sale only (%)
Vacant housing units - For sale only (% change since 2000)
Vacant housing units - Rented or sold, not occupied (%)
Vacant housing units - Rented or sold, not occupied (% change since 2000)
Vacant housing units - For seasonal, recreational, or occasional use (%)
Vacant housing units - For seasonal, recreational, or occasional use (% change since 2000)
Vacant housing units - For migrant workers (%)
Vacant housing units - For migrant workers (% change since 2000)
Vacant housing units - Other vacant (%)
Vacant housing units - Other vacant (% change since 2000)
Median monthly housing costs ($)
Median household income for houses/condos with a mortgage ($)
Median household income for houses/condos without a mortgage ($)
Median household income ($)
Median household income ($) - White
Median household income ($) - Black or African American
Median household income ($) - Asian
Median household income ($) - Hispanic or Latino
Median household income ($) - American Indian and Alaska Native
Median household income ($) - Multirace
Median household income ($) - Other Race
Mortgage status - with mortgage (%)
Mortgage status - with second mortgage (%)
Mortgage status - with home equity loan (%)
Mortgage status - with both second mortgage and home equity loan (%)
Mortgage status - without a mortgage (%)
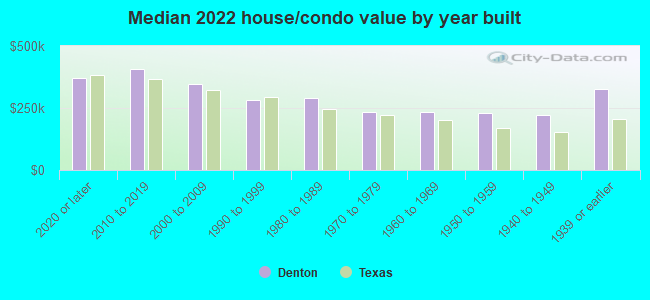
Median year house/condo built
Median year apartment built
Household type by relationship - Male householder living alone (%)
Household type by relationship - Male householder not living alone (%)
Household type by relationship - Female householder living alone (%)
Household type by relationship - Female householder not living alone (%)
Household type by relationship - Opposite-Sex spouse (%)
Household type by relationship - Same-Sex spouse (%)
Household type by relationship - Opposite-Sex unmarried partner (%)
Household type by relationship - Same-Sex unmarried partner (%)
Household type by relationship - In group quarters (%)
Size of family households - 2-person household (%)
Size of family households - 3-person household (%)
Size of family households - 4-person household (%)
Size of family households - 5-person household (%)
Size of family households - 6-person household (%)
Size of family households - 7-or-more-person household (%)
Size of nonfamily households - 1-person household (%)
Size of nonfamily households - 2-person household (%)
Size of nonfamily households - 3-person household (%)
Size of nonfamily households - 4-person household (%)
Size of nonfamily households - 5-person household (%)
Size of nonfamily households - 6-person household (%)
Size of nonfamily households - 7-or-moreperson household (%)
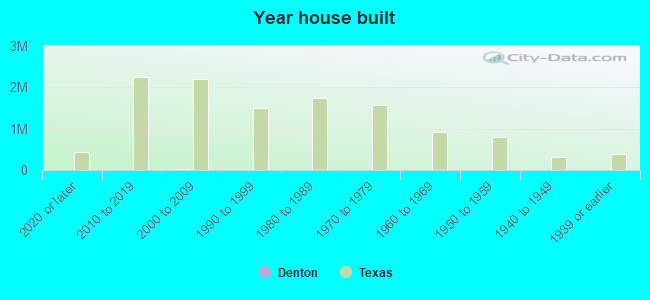
Year house built - Built 2010 or later (%)
Year house built - Built 2000 to 2009 (%)
Year house built - Built 1990 to 1999 (%)
Year house built - Built 1980 to 1989 (%)
Year house built - Built 1970 to 1979 (%)
Year house built - Built 1960 to 1969 (%)
Year house built - Built 1950 to 1959 (%)
Year house built - Built 1940 to 1949 (%)
Year house built - Built 1939 or earlier (%)
Median number of rooms in houses and condos
Median number of rooms in apartments
Median number of bedrooms in owner occupied houses
Mean number of bedrooms in owner occupied houses
Median number of bedrooms in renter occupied houses
Mean number of bedrooms in renter occupied houses
Median number of vehichles in owner occupied houses
Mean number of vehichles in owner occupied houses
Median number of vehichles in renter occupied houses
Mean number of vehichles in renter occupied houses
Rooms in owner-occupied houses - 1 room (%)
Rooms in owner-occupied houses - 2 rooms (%)
Rooms in owner-occupied houses - 3 rooms (%)
Rooms in owner-occupied houses - 4 rooms (%)
Rooms in owner-occupied houses - 5 rooms (%)
Rooms in owner-occupied houses - 6 rooms (%)
Rooms in owner-occupied houses - 7 rooms (%)
Rooms in owner-occupied houses - 8 rooms (%)
Rooms in owner-occupied houses - 9+ rooms (%)
Rooms in renter-occupied houses - 1 room (%)
Rooms in renter-occupied houses - 2 rooms (%)
Rooms in renter-occupied houses - 3 rooms (%)
Rooms in renter-occupied houses - 4 rooms (%)
Rooms in renter-occupied houses - 5 rooms (%)
Rooms in renter-occupied houses - 6 rooms (%)
Rooms in renter-occupied houses - 7 rooms (%)
Rooms in renter-occupied houses - 8 rooms (%)
Rooms in renter-occupied houses - 9+ rooms (%)
Bedrooms in owner-occupied houses - no bedrooms (%)
Bedrooms in owner-occupied houses - 1 bedroom (%)
Bedrooms in owner-occupied houses - 2 bedrooms (%)
Bedrooms in owner-occupied houses - 3 bedrooms (%)
Bedrooms in owner-occupied houses - 4 bedrooms (%)
Bedrooms in owner-occupied houses - 5+ bedrooms (%)
Bedrooms in renter-occupied houses - no bedrooms (%)
Bedrooms in renter-occupied houses - 1 bedroom (%)
Bedrooms in renter-occupied houses - 2 bedrooms (%)
Bedrooms in renter-occupied houses - 3 bedrooms (%)
Bedrooms in renter-occupied houses - 4 bedrooms (%)
Bedrooms in renter-occupied houses - 5+ bedrooms (%)
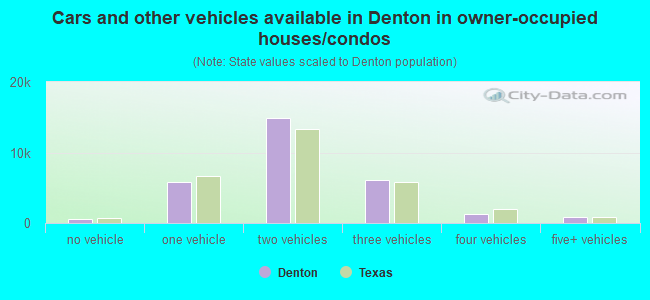
Vehicles available in owner-occupied houses - no vehicle available (%)
Vehicles available in owner-occupied houses - 1 vehicle available(%)
Vehicles available in owner-occupied houses - 2 Vehicles available (%)
Vehicles available in owner-occupied houses - 3 Vehicles available (%)
Vehicles available in owner-occupied houses - 4 Vehicles available (%)
Vehicles available in owner-occupied houses - 5+ Vehicles available (%)
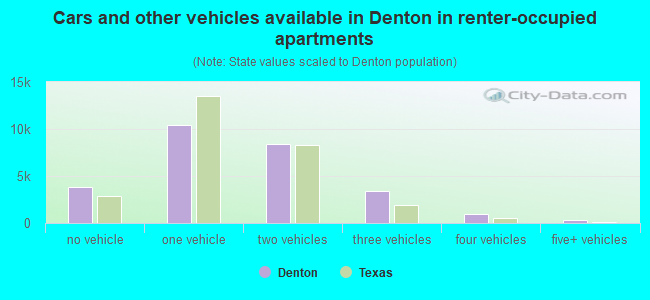
Vehicles available in renter-occupied houses - no vehicle available (%)
Vehicles available in renter-occupied houses - 1 vehicle available (%)
Vehicles available in renter-occupied houses - 2 Vehicles available (%)
Vehicles available in renter-occupied houses - 3 Vehicles available (%)
Vehicles available in renter-occupied houses - 4 Vehicles available (%)
Vehicles available in renter-occupied houses - 5+ Vehicles available (%)
Housing units in structures - 1, detached (%)
Housing units in structures - 1, attached (%)
Housing units in structures - 2 (%)
Housing units in structures - 3 or 4 (%)
Housing units in structures - 5 to 9 (%)
Housing units in structures - 10 to 19 (%)
Housing units in structures - 20 to 49 (%)
Housing units in structures - 50 or more (%)
Housing units in structures - Mobile home (%)
Housing units in structures - Boat, RV, van, etc. (%)
Housing units in structures - Owners - 1, detached (%)
Housing units in structures - Owners - 1, attached (%)
Housing units in structures - Owners - 2 (%)
Housing units in structures - Owners - 3 or 4 (%)
Housing units in structures - Owners - 5 to 9 (%)
Housing units in structures - Owners - 10 to 19 (%)
Housing units in structures - Owners - 20 to 49 (%)
Housing units in structures - Owners - 50 or more (%)
Housing units in structures - Owners - Mobile home (%)
Housing units in structures - Owners - Boat, RV, van, etc. (%)
Housing units in structures - Renters - 1, detached (%)
Housing units in structures - Renters - 1, attached (%)
Housing units in structures - Renters - 2 (%)
Housing units in structures - Renters - 3 or 4 (%)
Housing units in structures - Renters - 5 to 9 (%)
Housing units in structures - Renters - 10 to 19 (%)
Housing units in structures - Renters - 20 to 49 (%)
Housing units in structures - Renters - 50 or more (%)
Housing units in structures - Renters - Mobile home (%)
Housing units in structures - Renters - Boat, RV, van, etc. (%)
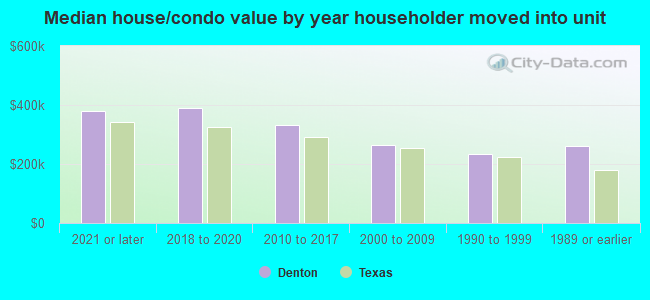
House/condo owner moved in on average (years ago)
Renter moved in on average (years ago)
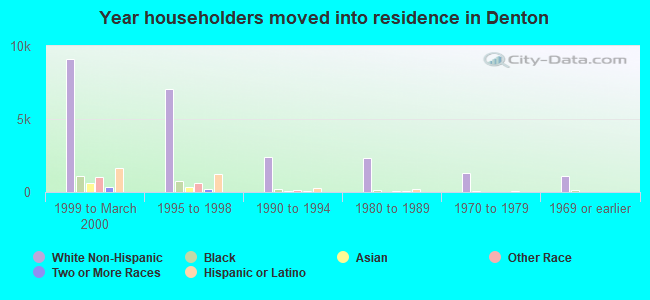
Year householder moved into unit - Moved in 1999 to March 2000 (%)
Year householder moved into unit - Moved in 1999 to March 2000 (%) - White
Year householder moved into unit - Moved in 1999 to March 2000 (%) - Black or African American
Year householder moved into unit - Moved in 1999 to March 2000 (%) - Asian
Year householder moved into unit - Moved in 1999 to March 2000 (%) - Hispanic or Latino
Year householder moved into unit - Moved in 1999 to March 2000 (%) - American Indian and Alaska Native
Year householder moved into unit - Moved in 1999 to March 2000 (%) - Multirace
Year householder moved into unit - Moved in 1999 to March 2000 (%) - Other Race
Year householder moved into unit - Moved in 1995 to 1998 (%)
Year householder moved into unit - Moved in 1995 to 1998 (%) - White
Year householder moved into unit - Moved in 1995 to 1998 (%) - Black or African American
Year householder moved into unit - Moved in 1995 to 1998 (%) - Asian
Year householder moved into unit - Moved in 1995 to 1998 (%) - Hispanic or Latino
Year householder moved into unit - Moved in 1995 to 1998 (%) - American Indian and Alaska Native
Year householder moved into unit - Moved in 1995 to 1998 (%) - Multirace
Year householder moved into unit - Moved in 1995 to 1998 (%) - Other Race
Year householder moved into unit - Moved in 1990 to 1994 (%)
Year householder moved into unit - Moved in 1990 to 1994 (%) - White
Year householder moved into unit - Moved in 1990 to 1994 (%) - Black or African American
Year householder moved into unit - Moved in 1990 to 1994 (%) - Asian
Year householder moved into unit - Moved in 1990 to 1994 (%) - Hispanic or Latino
Year householder moved into unit - Moved in 1990 to 1994 (%) - American Indian and Alaska Native
Year householder moved into unit - Moved in 1990 to 1994 (%) - Multirace
Year householder moved into unit - Moved in 1990 to 1994 (%) - Other Race
Year householder moved into unit - Moved in 1980 to 1989 (%)
Year householder moved into unit - Moved in 1980 to 1989 (%) - White
Year householder moved into unit - Moved in 1980 to 1989 (%) - Black or African American
Year householder moved into unit - Moved in 1980 to 1989 (%) - Asian
Year householder moved into unit - Moved in 1980 to 1989 (%) - Hispanic or Latino
Year householder moved into unit - Moved in 1980 to 1989 (%) - American Indian and Alaska Native
Year householder moved into unit - Moved in 1980 to 1989 (%) - Multirace
Year householder moved into unit - Moved in 1980 to 1989 (%) - Other Race
Year householder moved into unit - Moved in 1970 to 1979 (%)
Year householder moved into unit - Moved in 1970 to 1979 (%) - White
Year householder moved into unit - Moved in 1970 to 1979 (%) - Black or African American
Year householder moved into unit - Moved in 1970 to 1979 (%) - Asian
Year householder moved into unit - Moved in 1970 to 1979 (%) - Hispanic or Latino
Year householder moved into unit - Moved in 1970 to 1979 (%) - American Indian and Alaska Native
Year householder moved into unit - Moved in 1970 to 1979 (%) - Multirace
Year householder moved into unit - Moved in 1970 to 1979 (%) - Other Race
Year householder moved into unit - Moved in 1969 or earlier (%)
Year householder moved into unit - Moved in 1969 or earlier (%) - White
Year householder moved into unit - Moved in 1969 or earlier (%) - Black or African American
Year householder moved into unit - Moved in 1969 or earlier (%) - Asian
Year householder moved into unit - Moved in 1969 or earlier (%) - Hispanic or Latino
Year householder moved into unit - Moved in 1969 or earlier (%) - American Indian and Alaska Native
Year householder moved into unit - Moved in 1969 or earlier (%) - Multirace
Year householder moved into unit - Moved in 1969 or earlier (%) - Other Race
Housing units lacking complete plumbing facilities (%)
Housing units lacking complete kitchen facilities (%)
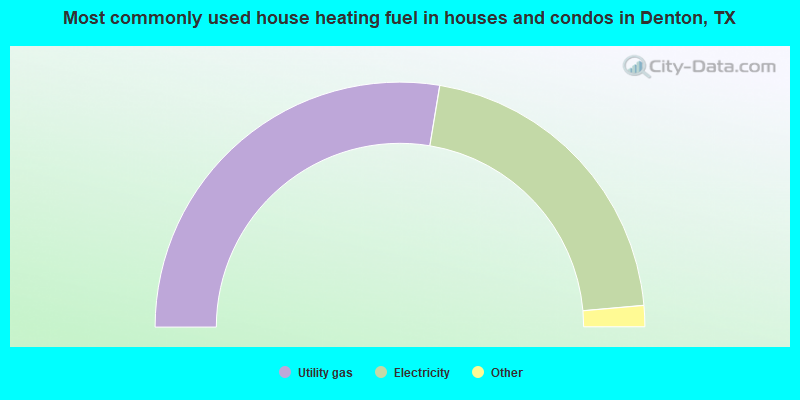
House heating fuel used in houses and condos - Utility gas (%)
House heating fuel used in houses and condos - Bottled, tank, or LP gas (%)
House heating fuel used in houses and condos - Electricity (%)
House heating fuel used in houses and condos - Fuel oil, kerosene, etc. (%)
House heating fuel used in houses and condos - Coal or coke (%)
House heating fuel used in houses and condos - Wood (%)
House heating fuel used in houses and condos - Solar energy (%)
House heating fuel used in houses and condos - Other fuel (%)
House heating fuel used in houses and condos - No fuel used (%)
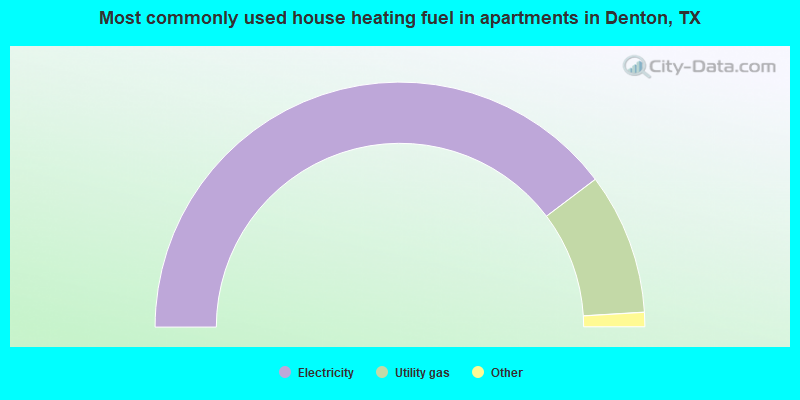
House heating fuel used in apartments - Utility gas (%)
House heating fuel used in apartments - Bottled, tank, or LP gas (%)
House heating fuel used in apartments - Electricity (%)
House heating fuel used in apartments - Fuel oil, kerosene, etc. (%)
House heating fuel used in apartments - Coal or coke (%)
House heating fuel used in apartments - Wood (%)
House heating fuel used in apartments - Solar energy (%)
House heating fuel used in apartments - Other fuel (%)
House heating fuel used in apartments - No fuel used (%)
Latest news about housing in Denton, TX collected exclusively by city-data.com from local newspapers, TV, and radio stations
Median year house/condo built: 2003Median year apartment built: 1990Household type by relationship:
Households: 150,357
Male householders: 28,704 (7,803 living alone ), Female householders: 28,067 (7,981 living alone )22,964 spouses (22,818 opposite-sex spouses ), 5,376 unmarried partners , (4,883 opposite-sex unmarried partners ), 35,681 children (33,427 natural , 726 adopted , 1,528 stepchildren ), 2,279 grandchildren , 2,760 brothers or sisters , 3,168 parents , 0 foster children , 1,270 other relatives , 11,345 non-relatives In group quarters: 8,743
Size of family households: 14,829 2-persons , 7,542 3-persons , 5,983 4-persons , 2,929 5-persons , 1,312 6-persons , 587 7-or-more-persons .
Size of nonfamily households: 15,784 1-person , 5,371 2-persons , 1,137 3-persons , 1,297 4-persons .
16,200 married couples with children. single-parent households (2,954 men , 3,182 women ).
77.9% of residents of Denton speak English at home. of residents speak Spanish at home (67% speak English very well , 18% speak English well , 10% speak English not well , 5% don't speak English at all ).of residents speak other Indo-European language at home (68% speak English very well , 28% speak English well , 3% speak English not well ).of residents speak Asian or Pacific Island language at home (58% speak English very well , 35% speak English well , 5% speak English not well , 1% don't speak English at all ).of residents speak other language at home (91% speak English very well , 7% speak English well , 3% speak English not well ).
Foreign born population: 19,729 (13.1%)of them are naturalized citizens )
Median number of rooms in houses and condos:
Median number of rooms in apartments
Owner-occupied Renter-occupied
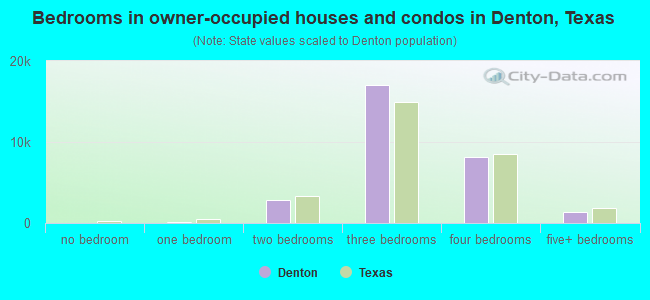
Bedrooms in owner-occupied houses and condos in Denton, Texas
0 no bedroom 152 1 bedroom 2,889 2 bedrooms 16,988 3 bedrooms 8,088 4 bedrooms 1,397 5+ bedrooms
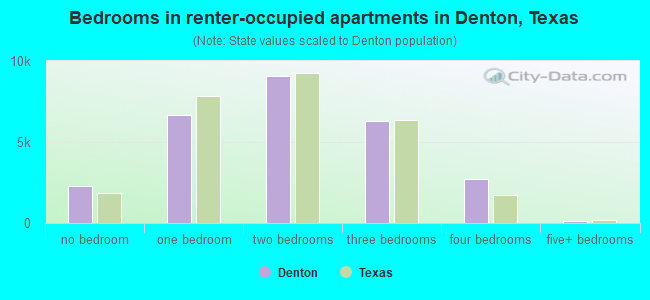
Bedrooms in renter-occupied apartments in Denton, Texas
2,306 no bedroom 6,690 1 bedroom 9,093 2 bedrooms 6,327 3 bedrooms 2,693 4 bedrooms 148 5+ bedrooms
Owner-occupied Renter-occupied
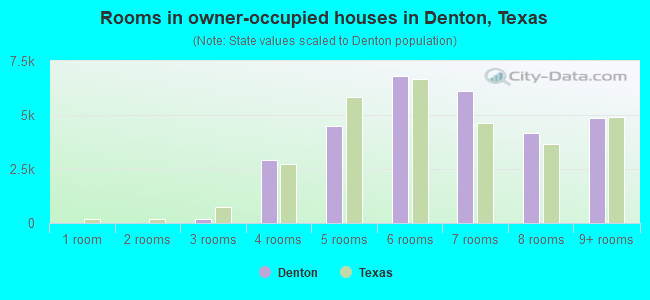
Rooms in owner-occupied houses in Denton, Texas
0 1 room 0 2 rooms 163 3 rooms 2,921 4 rooms 4,470 5 rooms 6,796 6 rooms 6,125 7 rooms 4,173 8 rooms 4,866 9+ rooms
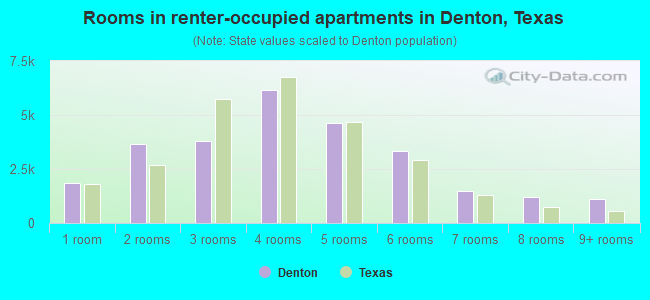
Rooms in renter-occupied apartments in Denton, Texas
1,865 1 room 3,676 2 rooms 3,785 3 rooms 6,168 4 rooms 4,642 5 rooms 3,349 6 rooms 1,491 7 rooms 1,189 8 rooms 1,092 9+ rooms
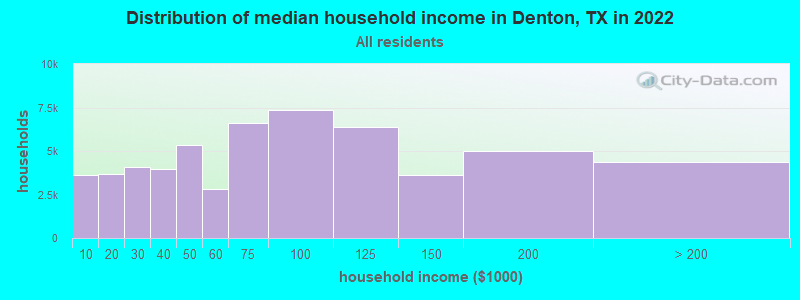
Denton, TX household income distribution 3,605 Less than $10,0003,697 $10,000 to $19,9994,065 $20,000 to $29,9993,951 $30,000 to $39,9995,364 $40,000 to $49,9992,838 $50,000 to $59,9996,588 $60,000 to $74,9997,341 $75,000 to $99,9996,363 $100,000 to $124,9993,605 $125,000 to $149,9994,996 $150,000 to $199,9994,358 $200,000 or more
Home value of owner - occupied houses in 2022 in Denton, TX 328 Less than $10,000357 $10,000 to $14,99947 $15,000 to $19,999150 $20,000 to $24,999121 $25,000 to $29,999249 $30,000 to $34,999205 $35,000 to $39,99977 $40,000 to $49,99966 $50,000 to $59,99998 $60,000 to $69,99968 $70,000 to $79,99920 $80,000 to $89,99947 $90,000 to $99,999221 $100,000 to $124,999165 $125,000 to $149,999351 $150,000 to $174,9991,213 $175,000 to $199,9992,754 $200,000 to $249,9993,376 $250,000 to $299,9997,190 $300,000 to $399,9993,308 $400,000 to $499,9992,757 $500,000 to $749,999474 $750,000 to $999,999367 $1,000,000 to $1,499,99923 $1,500,000 to $1,999,99966 $2,000,000 or moreRent paid by renters in 2022 in Denton, TX 47 $250 to $299269 $350 to $39934 $400 to $449286 $450 to $49940 $500 to $549105 $550 to $5991,179 $600 to $649784 $650 to $699640 $700 to $749731 $750 to $7992,398 $800 to $8992,826 $900 to $9996,545 $1,000 to $1,2494,042 $1,250 to $1,4992,702 $1,500 to $1,9992,264 $2,000 to $2,499672 $2,500 to $2,999182 $3,000 to $3,49946 $3,500 or more1,465 No cash rent
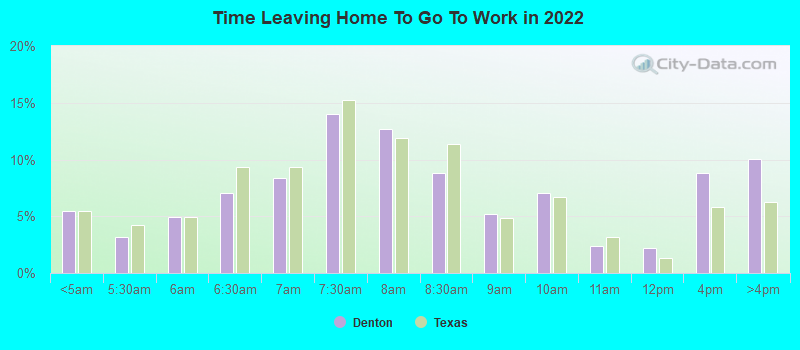
Percentage of workers working in this county: 75.6%Number of people working at home: 10,866 (13.4% of all workers )
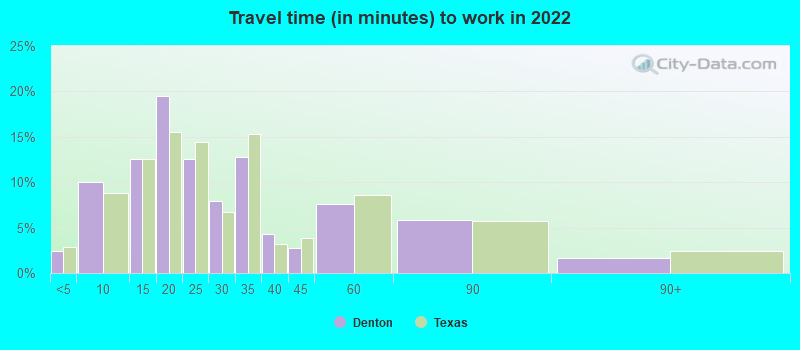
Travel time to work (commute)
Less than 5 minutes: 1,4625 to 9 minutes: 8,12110 to 14 minutes: 9,91915 to 19 minutes: 13,68720 to 24 minutes: 5,68625 to 29 minutes: 4,30230 to 34 minutes: 7,95935 to 39 minutes: 3,21840 to 44 minutes: 2,98545 to 59 minutes: 8,85760 to 89 minutes: 2,86890 or more minutes: 1,140
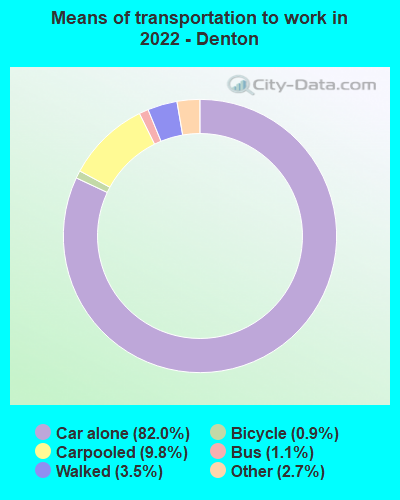
Means of transportation to work:
Drove a car alone: 60,129 (71.4%)Carpooled: 7,180 (8.5%)Bus : 801 (1.0%)Taxi: 1,950 (2.3%)Bicycle: 691 (0.8%)Walked: 2,589 (3.1%)Worked at home: 10,866 (12.9%)
Unemployment by race in 2022
Unemployment rate for White non-Hispanic residents 3.0% Males3.0% FemalesUnemployment rate for Black residents 7.3% Males5.9% FemalesUnemployment rate for American Indian and Alaska Native residents 6.2% Males1.7% FemalesUnemployment rate for Asian residents 5.7% Males2.7% FemalesUnemployment rate for other race residents 1.6% Males0.5% FemalesUnemployment rate for two or more race residents 4.0% Males12.7% FemalesUnemployment rate for Hispanic or Latino residents 5.2% Males5.4% Females
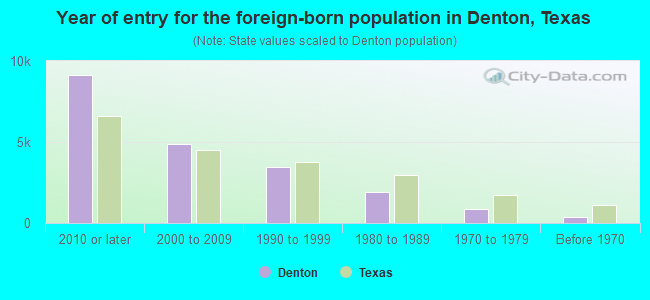
Year of entry for the foreign-born population in Denton, Texas
9,160 2010 or later 4,873 2000 to 2009 3,482 1990 to 1999 1,896 1980 to 1989 864 1970 to 1979 348 Before 1970
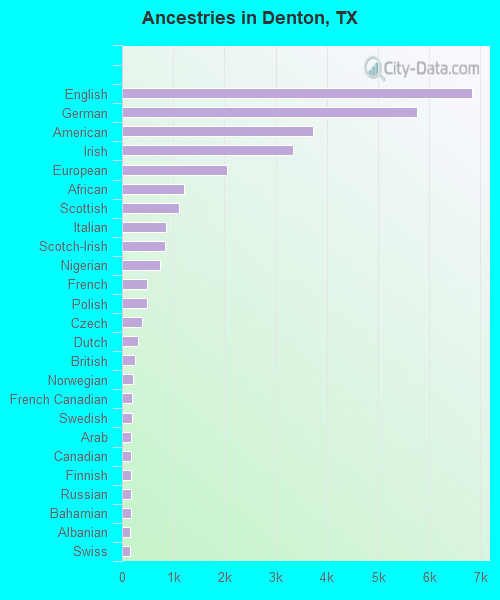
First ancestries reported:
English: 6,825 (9.7%)
German: 5,764 (8.2%)
American: 3,732 (5.3%)
Irish: 3,342 (4.7%)
European: 2,054 (2.9%)
African: 1,206 (1.7%)
Scottish: 1,122 (1.6%)
Italian: 852 (1.2%)
Scotch-Irish: 833 (1.2%)
Nigerian: 740 (1.1%)
French: 494 (0.7%)
Polish: 485 (0.7%)
Czech: 389 (0.6%)
Dutch: 321 (0.5%)
British: 254 (0.4%)
Norwegian: 212 (0.3%)
French Canadian: 193 (0.3%)
Swedish: 191 (0.3%)
Arab: 181 (0.3%)
Canadian: 181 (0.3%)
Finnish: 175 (0.2%)
Russian: 174 (0.2%)
Bahamian: 168 (0.2%)
Albanian: 165 (0.2%)
Swiss: 162 (0.2%)
Ghanaian: 149 (0.2%)
Romanian: 148 (0.2%)
Hungarian: 142 (0.2%)
Welsh: 132 (0.2%)
Iranian: 129 (0.2%)
Czechoslovakian: 113 (0.2%)
Lebanese: 113 (0.2%)
Belizean: 106 (0.2%)
Portuguese: 101 (0.1%)
Northern European: 86 (0.1%)
Slovak: 80 (0.1%)
Scandinavian: 78 (0.1%)
Turkish: 75 (0.1%)
Kenyan: 74 (0.1%)
Eastern European: 72 (0.1%)
Belgian: 64 (0.09%)
Danish: 60 (0.09%)
Ukrainian: 56 (0.08%)
Greek: 43 (0.06%)
Cypriot: 43 (0.06%)
Austrian: 43 (0.06%)
Somali: 37 (0.05%)
Lithuanian: 34 (0.05%)
Bermudan: 33 (0.05%)
Ethiopian: 32 (0.05%)
Trinidadian and Tobagonian: 26 (0.04%)
Macedonian: 25 (0.04%)
Liberian: 25 (0.04%)
Croatian: 25 (0.04%)
West Indian: 25 (0.04%)
Haitian: 23 (0.03%)
Jordanian: 21 (0.03%)
Iraqi: 20 (0.03%)
Jamaican: 20 (0.03%)
Serbian: 19 (0.03%)
Cajun: 17 (0.02%)
Sudanese: 16 (0.02%)
Zimbabwean: 15 (0.02%)
Australian: 13 (0.02%)
Alsatian: 11 (0.02%)
Most common places of birth for foreign-born residents (%): Mexico Denton:
39.2% (7,410)Texas:
48.4% (2,411,723)
Nigeria Denton:
3.9% (746)Texas:
1.9% (96,110)
China, excluding Hong Kong and Taiwan Denton:
3.8% (728)Texas:
2.3% (115,558)
Philippines Denton:
3.7% (708)Texas:
2.1% (103,148)
India Denton:
3.4% (648)Texas:
6.1% (306,347)
El Salvador Denton:
3.2% (601)Texas:
4.5% (224,455)
Saudi Arabia Denton:
2.7% (505)Texas:
0.2% (9,294)
Venezuela Denton:
2.5% (472)Texas:
1.5% (72,413)
Guatemala Denton:
2.4% (452)Texas:
1.8% (87,382)
Canada Denton:
2.2% (407)Texas:
1.1% (55,371)
Korea Denton:
2.1% (395)Texas:
1.2% (60,172)
Bangladesh Denton:
2.0% (382)Texas:
0.3% (16,549)
Nepal Denton:
1.9% (364)Texas:
0.6% (27,480)
Honduras Denton:
1.5% (286)Texas:
3.0% (147,182)
Place of birth for U.S.-born residents:
This state: 81,576Other state: 46,172Northeast: 6,917Midwest: 13,830South: 14,898West: 10,527 73.5% of Denton residents lived in the same house 1 years ago.
Out of people who lived in different houses, 37.0% lived in this county.
Out of people who lived in different counties, 79.3% lived in Texas.
Denton:
73.5%State average:
85.7%
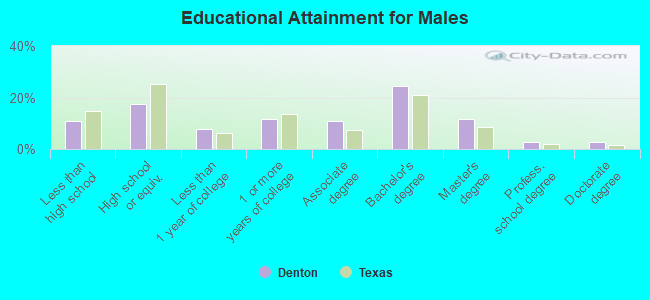
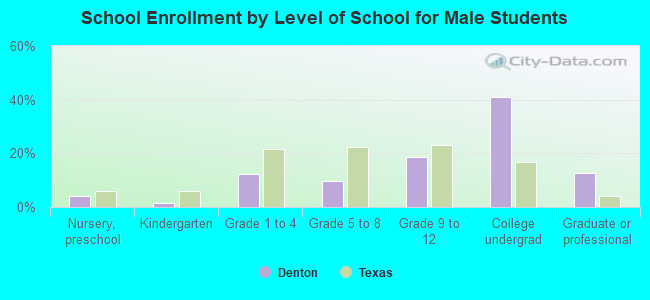
Education attainment for males 25 years and older:
No schooling: 1,526Nursery to 4th grade: 5405th and 6th grade: 2137th and 8th grade: 9279th grade: 34610th grade: 46111th grade: 40012th grade, no diploma: 830High school graduate (or equivalency): 8,533Less than 1 year of college: 3,719Some college more than 1 year, no degree: 5,785Associate degree: 5,263Bachelor's degree: 12,009Master's degree: 5,797Professional school degree: 1,276Doctorate degree: 1,335
Education attainment for females 25 years and older:
No schooling: 1,220Nursery to 4th grade: 2075th and 6th grade: 1917th and 8th grade: 3779th grade: 21910th grade: 15811th grade: 8912th grade, no diploma: 586High school graduate (or equivalency): 9,610Less than 1 year of college: 4,316Some college more than 1 year, no degree: 6,307Associate degree: 4,054Bachelor's degree: 11,112Master's degree: 6,268Professional school degree: 574Doctorate degree: 936
Housing units in structures:
One, detached: 36,342One, attached: 1,737Two: 8473 or 4: 2,0705 to 9: 3,53310 to 19: 5,25320 to 49: 3,49350 or more: 4,265Mobile homes: 1,704Median worth of mobile homes: $31,500
Housing units lacking complete plumbing facilities in 2022: 0.6%Housing units lacking complete kitchen facilities in 2022: 1.5%House/condo owner moved in on average 8 years ago
Renter moved in on average 1 years ago
Private vs. public school enrollment:
Students in private schools in grades 1 to 8 (elementary and middle school): 987 Students in private schools in grades 9 to 12 (high school): 599 Students in private undergraduate colleges: 1,274