Races in Denton, Texas (TX) Detailed Stats
Data:
Races - White alone (%)
Races - White alone (% change since 2000)
Races - Black alone (%)
Races - Black alone (% change since 2000)
Races - American Indian alone (%)
Races - American Indian alone (% change since 2000)
Races - Asian alone (%)
Races - Asian alone (% change since 2000)
Races - Hispanic (%)
Races - Hispanic (% change since 2000)
Races - Native Hawaiian and Other Pacific Islander alone (%)
Races - Native Hawaiian and Other Pacific Islander alone (% change since 2000)
Races - Two or more races(%)
Races - Two or more races(% change since 2000)
Races - Other race alone (%)
Races - Other race alone (% change since 2000)
Racial diversity
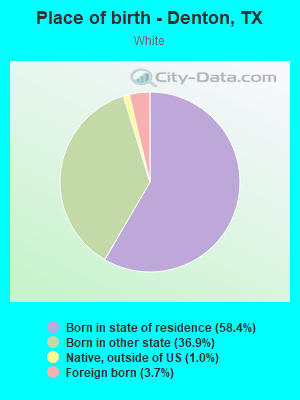
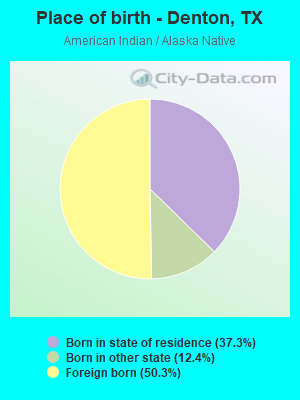
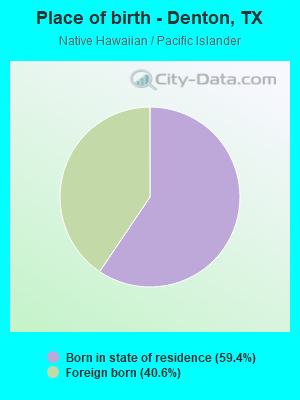
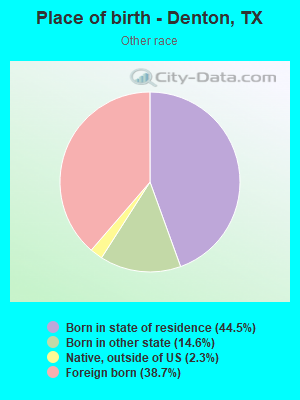
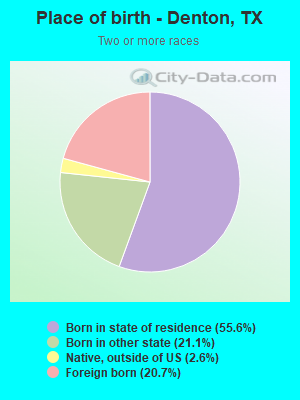
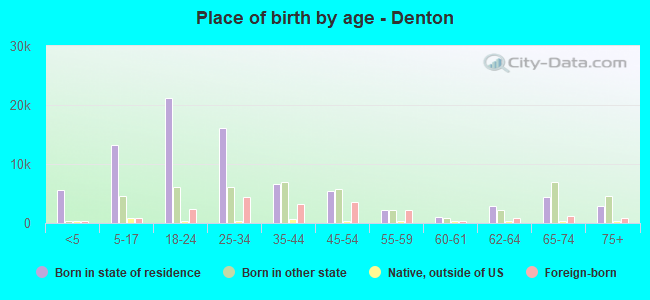
Place of birth - Born in state of residence (%)
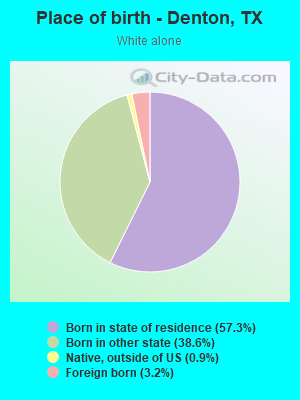
Place of birth - Born in state of residence (%) - White
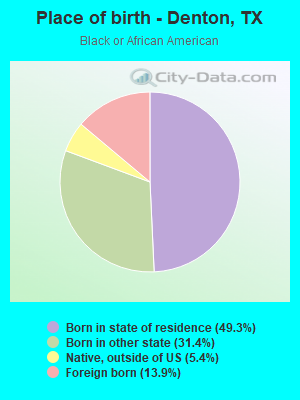
Place of birth - Born in state of residence (%) - Black or African American
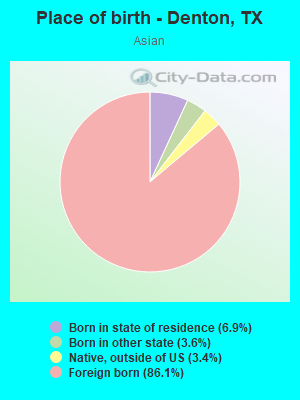
Place of birth - Born in state of residence (%) - Asian
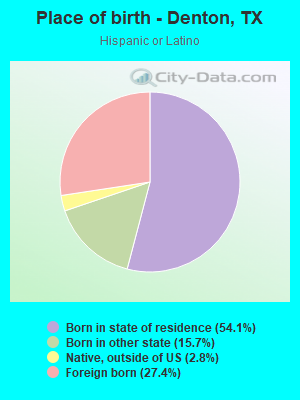
Place of birth - Born in state of residence (%) - Hispanic or Latino
Place of birth - Born in state of residence (%) - American Indian and Alaska Native
Place of birth - Born in state of residence (%) - Multirace
Place of birth - Born in state of residence (%) - Other Race
Place of birth - Born in other state (%)
Place of birth - Born in other state (%) - White
Place of birth - Born in other state (%) - Black or African American
Place of birth - Born in other state (%) - Asian
Place of birth - Born in other state (%) - Hispanic or Latino
Place of birth - Born in other state (%) - American Indian and Alaska Native
Place of birth - Born in other state (%) - Multirace
Place of birth - Born in other state (%) - Other Race
Place of birth - Native, outside of US (%)
Place of birth - Native, outside of US (%) - White
Place of birth - Native, outside of US (%) - Black or African American
Place of birth - Native, outside of US (%) - Asian
Place of birth - Native, outside of US (%) - Hispanic or Latino
Place of birth - Native, outside of US (%) - American Indian and Alaska Native
Place of birth - Native, outside of US (%) - Multirace
Place of birth - Native, outside of US (%) - Other Race
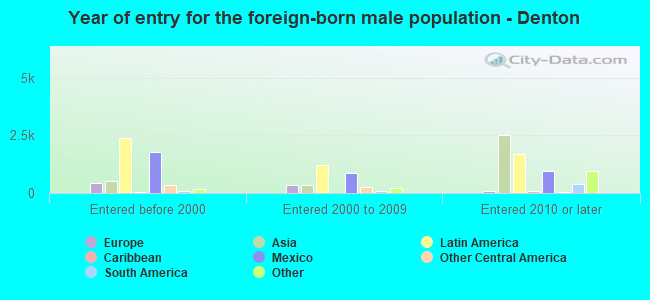
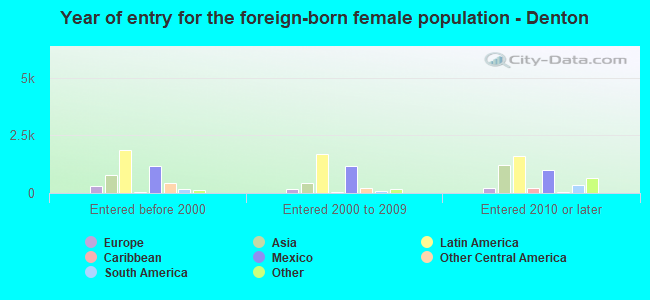
Place of birth - Foreign born (%)
Place of birth - Foreign born (%) - White
Place of birth - Foreign born (%) - Black or African American
Place of birth - Foreign born (%) - Asian
Place of birth - Foreign born (%) - Hispanic or Latino
Place of birth - Foreign born (%) - American Indian and Alaska Native
Place of birth - Foreign born (%) - Multirace
Place of birth - Foreign born (%) - Other Race
Residents speaking English at home (%)
Residents speaking English at home - Born in the United States (%)
Residents speaking English at home - Native, born elsewhere (%)
Residents speaking English at home - Foreign born (%)
Residents speaking Spanish at home (%)
Residents speaking Spanish at home - Born in the United States (%)
Residents speaking Spanish at home - Native, born elsewhere (%)
Residents speaking Spanish at home - Foreign born (%)
Residents speaking other language at home (%)
Residents speaking other language at home - Born in the United States (%)
Residents speaking other language at home - Native, born elsewhere (%)
Residents speaking other language at home - Foreign born (%)
Marital status - Never married (%)
Marital status - Now married (%)
Marital status - Separated (%)
Marital status - Widowed (%)
Marital status - Divorced (%)
Ancestries Reported - Arab (%)
Ancestries Reported - Czech (%)
Ancestries Reported - Danish (%)
Ancestries Reported - Dutch (%)
Ancestries Reported - English (%)
Ancestries Reported - French (%)
Ancestries Reported - French Canadian (%)
Ancestries Reported - German (%)
Ancestries Reported - Greek (%)
Ancestries Reported - Hungarian (%)
Ancestries Reported - Irish (%)
Ancestries Reported - Italian (%)
Ancestries Reported - Lithuanian (%)
Ancestries Reported - Norwegian (%)
Ancestries Reported - Polish (%)
Ancestries Reported - Portuguese (%)
Ancestries Reported - Russian (%)
Ancestries Reported - Scotch-Irish (%)
Ancestries Reported - Scottish (%)
Ancestries Reported - Slovak (%)
Ancestries Reported - Subsaharan African (%)
Ancestries Reported - Swedish (%)
Ancestries Reported - Swiss (%)
Ancestries Reported - Ukrainian (%)
Ancestries Reported - United States (%)
Ancestries Reported - Welsh (%)
Ancestries Reported - West Indian (%)
Ancestries Reported - Other (%)
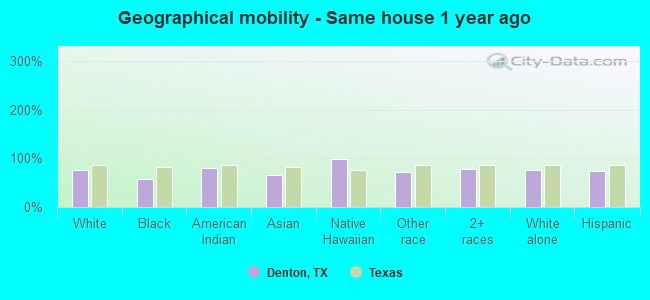
Geographical mobility - Same house 1 year ago (%)
Geographical mobility - Same house 1 year ago (%) - White
Geographical mobility - Same house 1 year ago (%) - Black or African American
Geographical mobility - Same house 1 year ago (%) - Asian
Geographical mobility - Same house 1 year ago (%) - Hispanic or Latino
Geographical mobility - Same house 1 year ago (%) - American Indian and Alaska Native
Geographical mobility - Same house 1 year ago (%) - Multirace
Geographical mobility - Same house 1 year ago (%) - Other Race
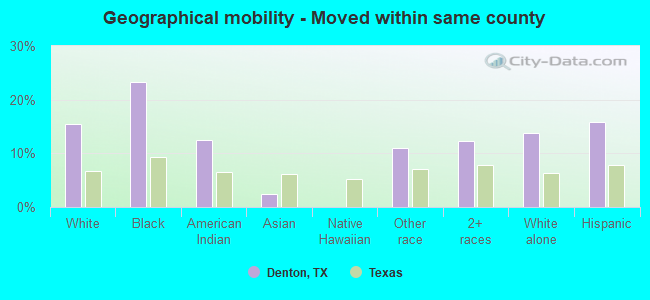
Geographical mobility - Moved within same county (%)
Geographical mobility - Moved within same county (%) - White
Geographical mobility - Moved within same county (%) - Black or African American
Geographical mobility - Moved within same county (%) - Asian
Geographical mobility - Moved within same county (%) - Hispanic or Latino
Geographical mobility - Moved within same county (%) - American Indian and Alaska Native
Geographical mobility - Moved within same county (%) - Multirace
Geographical mobility - Moved within same county (%) - Other Race
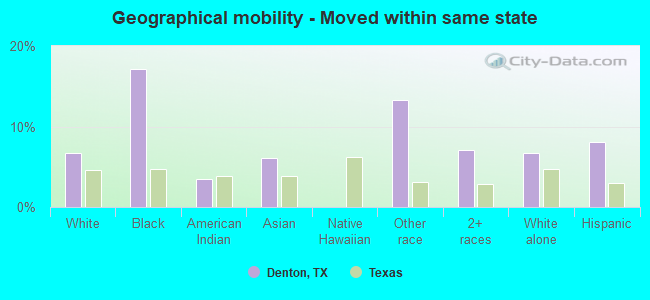
Geographical mobility - Moved from different county within same state (%)
Geographical mobility - Moved from different county within same state (%) - White
Geographical mobility - Moved from different county within same state (%) - Black or African American
Geographical mobility - Moved from different county within same state (%) - Asian
Geographical mobility - Moved from different county within same state (%) - Hispanic or Latino
Geographical mobility - Moved from different county within same state (%) - American Indian and Alaska Native
Geographical mobility - Moved from different county within same state (%) - Multirace
Geographical mobility - Moved from different county within same state (%) - Other Race
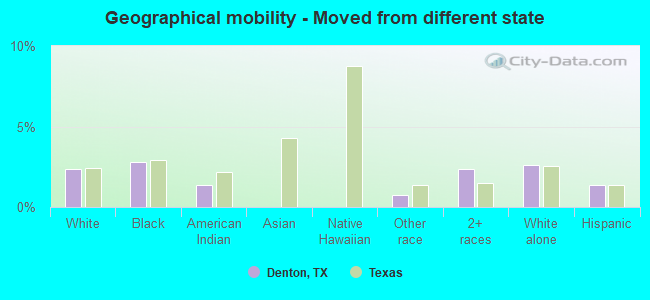
Geographical mobility - Moved from different state (%)
Geographical mobility - Moved from different state (%) - White
Geographical mobility - Moved from different state (%) - Black or African American
Geographical mobility - Moved from different state (%) - Asian
Geographical mobility - Moved from different state (%) - Hispanic or Latino
Geographical mobility - Moved from different state (%) - American Indian and Alaska Native
Geographical mobility - Moved from different state (%) - Multirace
Geographical mobility - Moved from different state (%) - Other Race
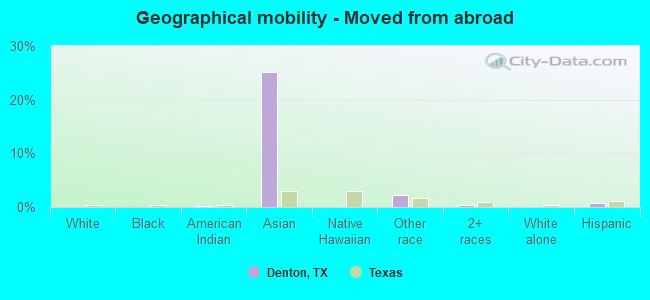
Geographical mobility - Moved from abroad (%)
Geographical mobility - Moved from abroad (%) - White
Geographical mobility - Moved from abroad (%) - Black or African American
Geographical mobility - Moved from abroad (%) - Asian
Geographical mobility - Moved from abroad (%) - Hispanic or Latino
Geographical mobility - Moved from abroad (%) - American Indian and Alaska Native
Geographical mobility - Moved from abroad (%) - Multirace
Geographical mobility - Moved from abroad (%) - Other Race
Place of birth for the foreign-born population - Ireland (%)
Place of birth for the foreign-born population - Denmark (%)
Place of birth for the foreign-born population - Norway (%)
Place of birth for the foreign-born population - Sweden (%)
Place of birth for the foreign-born population - United Kingdom (%)
Place of birth for the foreign-born population - England (%)
Place of birth for the foreign-born population - Scotland (%)
Place of birth for the foreign-born population - Other Northern Europe (%)
Place of birth for the foreign-born population - Austria (%)
Place of birth for the foreign-born population - Belgium (%)
Place of birth for the foreign-born population - France (%)
Place of birth for the foreign-born population - Germany (%)
Place of birth for the foreign-born population - Netherlands (%)
Place of birth for the foreign-born population - Switzerland (%)
Place of birth for the foreign-born population - Other Western Europe (%)
Place of birth for the foreign-born population - Greece (%)
Place of birth for the foreign-born population - Italy (%)
Place of birth for the foreign-born population - Portugal (%)
Place of birth for the foreign-born population - Spain (%)
Place of birth for the foreign-born population - Other Southern Europe (%)
Place of birth for the foreign-born population - Albania (%)
Place of birth for the foreign-born population - Belarus (%)
Place of birth for the foreign-born population - Bosnia and Herzegovina (%)
Place of birth for the foreign-born population - Bulgaria (%)
Place of birth for the foreign-born population - Croatia (%)
Place of birth for the foreign-born population - Czechoslovakia (%)
Place of birth for the foreign-born population - Hungary (%)
Place of birth for the foreign-born population - Latvia (%)
Place of birth for the foreign-born population - Lithuania (%)
Place of birth for the foreign-born population - North Macedonia (Macedonia) (%)
Place of birth for the foreign-born population - Moldova (%)
Place of birth for the foreign-born population - Poland (%)
Place of birth for the foreign-born population - Romania (%)
Place of birth for the foreign-born population - Russia (%)
Place of birth for the foreign-born population - Serbia (%)
Place of birth for the foreign-born population - Ukraine (%)
Place of birth for the foreign-born population - Other Eastern Europe (%)
Place of birth for the foreign-born population - China (%)
Place of birth for the foreign-born population - Hong Kong (%)
Place of birth for the foreign-born population - Taiwan (%)
Place of birth for the foreign-born population - Japan (%)
Place of birth for the foreign-born population - Korea (%)
Place of birth for the foreign-born population - Other Eastern Asia (%)
Place of birth for the foreign-born population - Afghanistan (%)
Place of birth for the foreign-born population - Bangladesh (%)
Place of birth for the foreign-born population - India (%)
Place of birth for the foreign-born population - Iran (%)
Place of birth for the foreign-born population - Kazakhstan (%)
Place of birth for the foreign-born population - Nepal (%)
Place of birth for the foreign-born population - Pakistan (%)
Place of birth for the foreign-born population - Sri Lanka (%)
Place of birth for the foreign-born population - Uzbekistan (%)
Place of birth for the foreign-born population - Other South Central Asia (%)
Place of birth for the foreign-born population - Burma (%)
Place of birth for the foreign-born population - Cambodia (%)
Place of birth for the foreign-born population - Indonesia (%)
Place of birth for the foreign-born population - Laos (%)
Place of birth for the foreign-born population - Malaysia (%)
Place of birth for the foreign-born population - Philippines (%)
Place of birth for the foreign-born population - Singapore (%)
Place of birth for the foreign-born population - Thailand (%)
Place of birth for the foreign-born population - Vietnam (%)
Place of birth for the foreign-born population - Other South Eastern Asia (%)
Place of birth for the foreign-born population - Armenia (%)
Place of birth for the foreign-born population - Iraq (%)
Place of birth for the foreign-born population - Israel (%)
Place of birth for the foreign-born population - Jordan (%)
Place of birth for the foreign-born population - Kuwait (%)
Place of birth for the foreign-born population - Lebanon (%)
Place of birth for the foreign-born population - Saudi Arabia (%)
Place of birth for the foreign-born population - Syria (%)
Place of birth for the foreign-born population - Turkey (%)
Place of birth for the foreign-born population - Yemen (%)
Place of birth for the foreign-born population - Other Western Asia (%)
Place of birth for the foreign-born population - Eritrea (%)
Place of birth for the foreign-born population - Ethiopia (%)
Place of birth for the foreign-born population - Kenya (%)
Place of birth for the foreign-born population - Somalia (%)
Place of birth for the foreign-born population - Uganda (%)
Place of birth for the foreign-born population - Zimbabwe (%)
Place of birth for the foreign-born population - Other Eastern Africa (%)
Place of birth for the foreign-born population - Cameroon (%)
Place of birth for the foreign-born population - Congo (%)
Place of birth for the foreign-born population - Democratic Republic of Congo (Zaire) (%)
Place of birth for the foreign-born population - Other Middle Africa (%)
Place of birth for the foreign-born population - Egypt (%)
Place of birth for the foreign-born population - Morocco (%)
Place of birth for the foreign-born population - Sudan (%)
Place of birth for the foreign-born population - Other Northern Africa (%)
Place of birth for the foreign-born population - South Africa (%)
Place of birth for the foreign-born population - Other Southern Africa (%)
Place of birth for the foreign-born population - Cabo Verde (%)
Place of birth for the foreign-born population - Ghana (%)
Place of birth for the foreign-born population - Liberia (%)
Place of birth for the foreign-born population - Nigeria (%)
Place of birth for the foreign-born population - Senegal (%)
Place of birth for the foreign-born population - Sierra Leone (%)
Place of birth for the foreign-born population - Other Western Africa (%)
Place of birth for the foreign-born population - Australia (%)
Place of birth for the foreign-born population - New Zealand (%)
Place of birth for the foreign-born population - Fiji (%)
Place of birth for the foreign-born population - Micronesia (%)
Place of birth for the foreign-born population - Bahamas (%)
Place of birth for the foreign-born population - Barbados (%)
Place of birth for the foreign-born population - Cuba (%)
Place of birth for the foreign-born population - Dominica (%)
Place of birth for the foreign-born population - Dominican Republic (%)
Place of birth for the foreign-born population - Grenada (%)
Place of birth for the foreign-born population - Haiti (%)
Place of birth for the foreign-born population - Jamaica (%)
Place of birth for the foreign-born population - St. Vincent and the Grenadines (%)
Place of birth for the foreign-born population - Trinidad and Tobago (%)
Place of birth for the foreign-born population - West Indies (%)
Place of birth for the foreign-born population - Other Caribbean (%)
Place of birth for the foreign-born population - Belize (%)
Place of birth for the foreign-born population - Costa Rica (%)
Place of birth for the foreign-born population - El Salvador (%)
Place of birth for the foreign-born population - Guatemala (%)
Place of birth for the foreign-born population - Honduras (%)
Place of birth for the foreign-born population - Mexico (%)
Place of birth for the foreign-born population - Nicaragua (%)
Place of birth for the foreign-born population - Panama (%)
Place of birth for the foreign-born population - Other Central America (%)
Place of birth for the foreign-born population - Argentina (%)
Place of birth for the foreign-born population - Bolivia (%)
Place of birth for the foreign-born population - Brazil (%)
Place of birth for the foreign-born population - Chile (%)
Place of birth for the foreign-born population - Colombia (%)
Place of birth for the foreign-born population - Ecuador (%)
Place of birth for the foreign-born population - Guyana (%)
Place of birth for the foreign-born population - Peru (%)
Place of birth for the foreign-born population - Uruguay (%)
Place of birth for the foreign-born population - Venezuela (%)
Place of birth for the foreign-born population - Other South America (%)
Place of birth for the foreign-born population - Canada (%)
Place of birth for the foreign-born population - Other Northern America (%)
Place of birth for the foreign-born population - Other (%)
Latest news about races in Denton, TX collected exclusively by city-data.com from local newspapers, TV, and radio stations
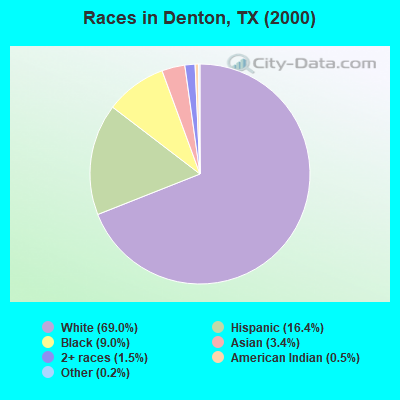
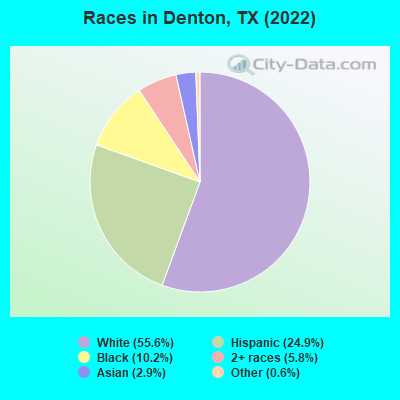
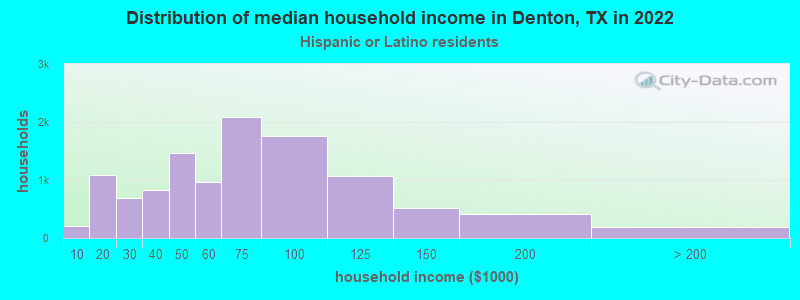
According to 2022 data, the most numerous races in Denton, TX are Hispanic (37,421 residents), White alone (83,524 residents), and Black alone (15,382 residents). 78.6% of Denton residents speak English at home. 12.4% of Denton, TX residents are foreign-born (7.0% born in Latin America, 3.6% born in Asia), which is 36.6% less than the foreign-born rate of 17.0% across the entire state of Texas.
Race distribution in Denton
2000 2022
55,585 69.0% White alone 13,188 16.4% Hispanic 7,255 9.0% Black alone 2,725 3.4% Asian alone 1,234 1.5% Two or more races 380 0.5% American Indian alone 128 0.2% Other race alone 42 0.05% Native Hawaiian and Other
83,524 55.6% White alone 37,421 24.9% Hispanic 15,382 10.2% Black alone 8,787 5.8% Two or more races 4,369 2.9% Asian alone 866 0.6% Other race alone 8 0.01% American Indian alone
2000 2022
10,933,313 52.4% White alone 6,669,666 32.0% Hispanic 2,364,255 11.3% Black alone 554,445 2.7% Asian alone 230,567 1.1% Two or more races 68,859 0.3% American Indian alone 19,958 0.10% Other race alone 10,757 0.05% Native Hawaiian and Other
12,070,642 40.2% Hispanic 11,683,430 38.9% White alone 3,508,706 11.7% Black alone 1,608,173 5.4% Asian alone 956,560 3.2% Two or more races 125,763 0.4% Other race alone 47,023 0.2% American Indian alone 29,275 0.10% Native Hawaiian and Other
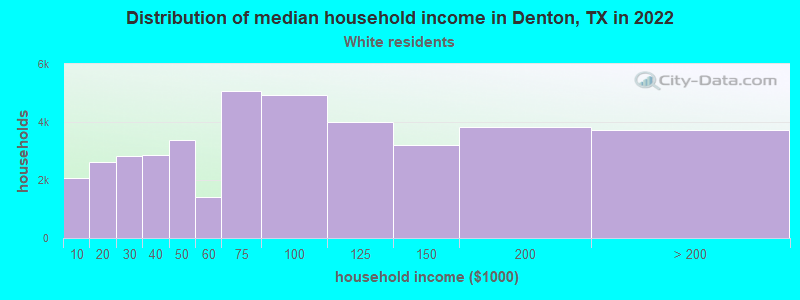
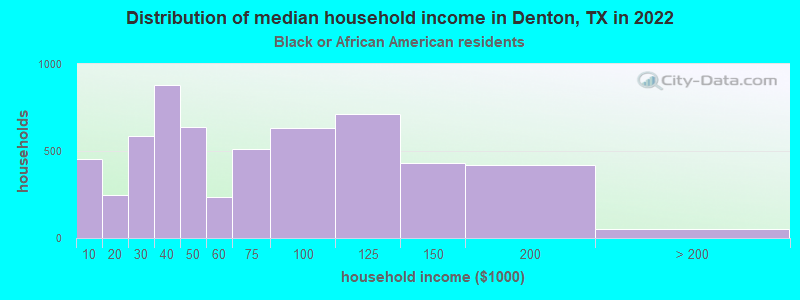
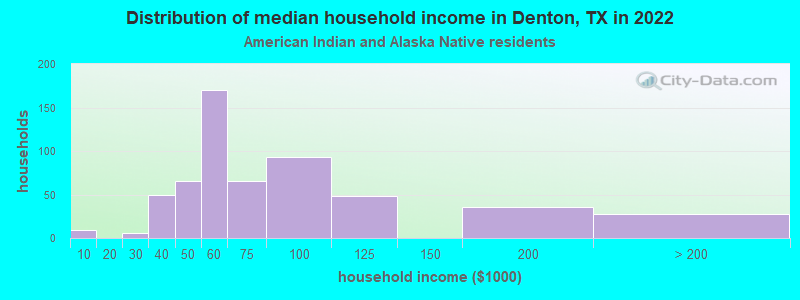
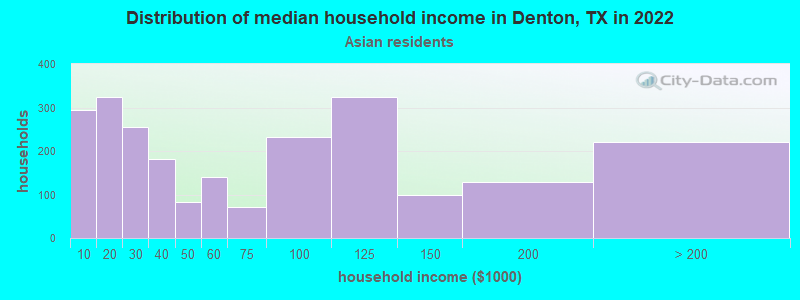
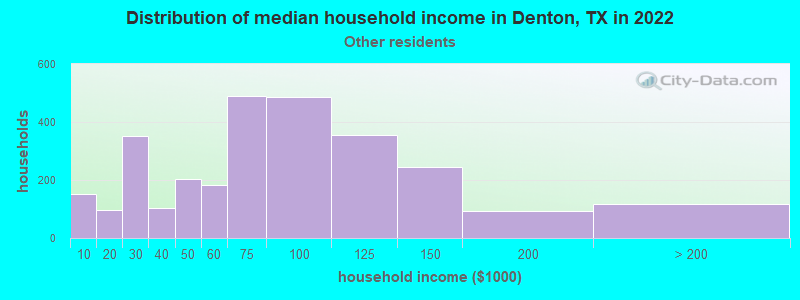
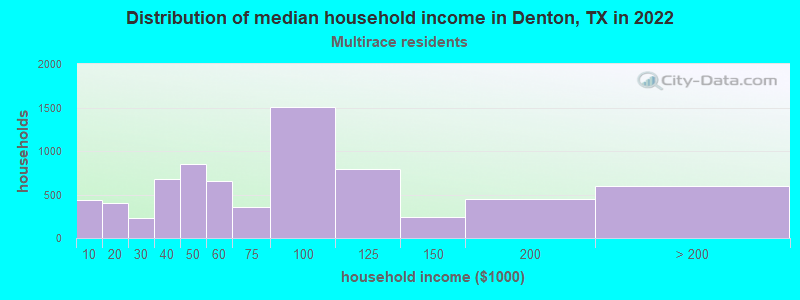
Income and house value in Denton Median household income in 2022 $80,042 White non-Hispanic householders$57,477 Black householders$57,305 American Indian and Alaska Native householders$47,339 Asian householders$64,164 Some other race householders$74,793 Two or more races householders$62,870 Hispanic or Latino race householdersMedian 2022 house value $360,837 White Non-Hispanic householders$238,537 Black or African American householders$575,453 American Indian or Alaska Native householders $355,784 Asian householders$240,895 Some other race householders$355,784 Two or more races householders$265,490 Hispanic or Latino householders
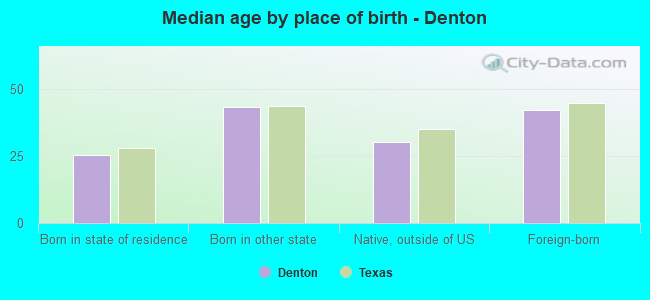
Median age by race in Denton
35.3 Median age for White residents35.8 34.8 27.3 Median age for Black or African American residents32.0 20.7 52.0 Median age for American Indian / Alaska Native residents29.4 52.3 27.5 Median age for Asian residents26.8 39.3 -666,666,666.0 Median age for Native Hawaiian / Pacific Islander residents-666,666,666.0 -666,666,666.0 30.4 Median age for Other race residents30.8 29.0 28.4 Median age for Two or more races residents27.9 28.8 37.9 Median age for White alone residents37.7 38.2 28.6 Median age for Hispanic or Latino residents29.0 27.0
Owner/renter occupied households by race in Denton
House owners and renters - White residents 21,856 54.8% Owner occupied18,046 45.2% Renter occupiedHouse owners and renters - Black or African American residents 1,553 33.1% Owner occupied3,140 66.9% Renter occupiedHouse owners and renters - American Indian / Alaska Native residents 329 63.2% Owner occupied192 36.8% Renter occupiedHouse owners and renters - Asian residents 633 36.5% Owner occupied1,099 63.5% Renter occupiedHouse owners and renters - Native Hawaiian / Pacific Islander residents 18 100.0% Renter occupiedHouse owners and renters - Other race residents 1,385 45.6% Owner occupied1,652 54.4% Renter occupiedHouse owners and renters - Two or more races residents 3,874 53.9% Owner occupied3,320 46.1% Renter occupiedHouse owners and renters - White alone residents 20,668 57.2% Owner occupied15,434 42.8% Renter occupiedHouse owners and renters - Hispanic or Latino residents 5,508 48.9% Owner occupied5,751 51.1% Renter occupied
Language usage in Denton
English speakers - Total 78.6% of residents of Denton speak English at home.
15.9% of residents speak Spanish at home 15,636 67.9% Speak English very well7,385 32.1% Speak English less than very well5.5% of residents speak other language at home 5,597 70.2% Speak English very well2,371 29.8% Speak English less than very well
English speakers - Born in the United States 93.6% of residents of Denton speak English at home.
6.1% of residents speak Spanish at home 2,676 95.5% Speak English very well125 4.5% Speak English less than very well0.3% of residents speak other language at home 144 100.0% Speak English very well
English speakers - Native, born elsewhere 71.0% of residents of Denton speak English at home.
26.2% of residents speak Spanish at home 633 83.7% Speak English very well123 16.3% Speak English less than very well2.7% of residents speak other language at home 79 100.0% Speak English very well
English speakers - Foreign-born 12.5% of residents of Denton speak English at home.
51.2% of residents speak Spanish at home 3,608 35.7% Speak English very well6,500 64.3% Speak English less than very well36.2% of residents speak other language at home 4,930 69.0% Speak English very well2,217 31.0% Speak English less than very well
White (Caucasian) - Speak only English Native:
95.7% (81,789)Foreign-born:
35.6% (1,215)
White (Caucasian) - Speak another language Native:
4.3% (3,674)Foreign-born:
64.4% (2,194)
Black or African American - Speak only English Native:
98.6% (15,508)Foreign-born:
32.1% (626)
Black or African American - Speak another language Native:
1.7% (260)Foreign-born:
59.4% (1,157)
American Indian / Alaska Native - Speak only English Native:
36.0% (373)Foreign-born:
2.4% (17)
American Indian / Alaska Native - Speak another language Native:
68.8% (714)Foreign-born:
96.9% (692)
Asian - Speak only English Native:
53.7% (329)Foreign-born:
16.4% (624)
Asian - Speak another language Native:
46.3% (284)Foreign-born:
83.6% (3,178)
Native Hawaiian / Pacific Islander - Speak only English Native:
98.9% (29)Foreign-born:
43.4% (10)
Other race - Speak another language Native:
58.5% (4,271)Foreign-born:
100.0% (4,757)
Two or more races - Speak only English Native:
72.9% (13,404)Foreign-born:
8.5% (441)
Two or more races - Speak another language Native:
27.1% (4,972)Foreign-born:
91.5% (4,771)
White alone - Speak only English Native:
98.5% (77,131)Foreign-born:
45.2% (1,215)
White alone - Speak another language Native:
1.5% (1,189)Foreign-born:
54.8% (1,473)
Hispanic or Latino - Speak only English Native:
54.0% (13,540)Foreign-born:
2.3% (232)
Hispanic or Latino - Speak another language Native:
46.0% (11,532)Foreign-born:
97.7% (10,018)
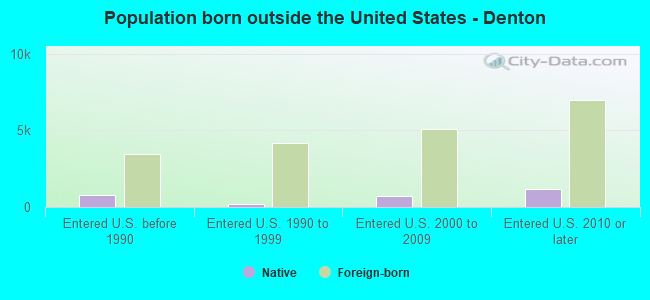
Foreign-born residents in Denton 18,915 residents are foreign born (7.0% Latin America , 3.6% Asia ).
This city:
12.4%Texas:
17.1%
Marital status for residents in Denton Marital status - White (Caucasian) population 15 years and over
Males 42.3% Never married45.1% Now married0.5% Separated1.5% Widowed10.7% DivorcedFemales 37.8% Never married40.5% Now married1.1% Separated8.5% Widowed12.2% DivorcedWomen who gave birth in the past 12 months Now married:
100.0% (868)Unmarried:
0.0% (0)
Women who did not give birth in the past 12 months Now married:
31.4% (7,395)Unmarried:
68.6% (16,154)
Marital status - Black or African American population 15 years and over
Males 55.6% Never married28.2% Now married0.0% Separated5.0% Widowed11.2% DivorcedFemales 64.5% Never married15.6% Now married1.1% Separated4.5% Widowed14.3% DivorcedWomen who gave birth in the past 12 months Now married:
0.0% (0)Unmarried:
100.0% (38)
Women who did not give birth in the past 12 months Now married:
19.1% (1,255)Unmarried:
80.9% (5,309)
Marital status - American Indian / Alaska Native population 15 years and over
Males 74.9% Never married21.2% Now married0.0% Separated0.0% Widowed3.9% DivorcedFemales 54.8% Never married20.7% Now married13.9% Separated3.2% Widowed7.3% DivorcedWomen who did not give birth in the past 12 months Now married:
13.9% (77)Unmarried:
86.1% (480)
Marital status - Asian population 15 years and over
Males 59.7% Never married39.2% Now married0.0% Separated0.8% Widowed0.4% DivorcedFemales 54.7% Never married40.3% Now married0.0% Separated3.3% Widowed1.6% DivorcedWomen who gave birth in the past 12 months Now married:
100.0% (57)Unmarried:
0.0% (0)
Women who did not give birth in the past 12 months Now married:
32.7% (655)Unmarried:
67.3% (1,349)
Marital status - Native Hawaiian / Pacific Islander population 15 years and over
Males 64.0% Never married36.0% Now married0.0% Separated0.0% Widowed0.0% DivorcedFemales 82.4% Never married0.0% Now married0.0% Separated0.0% Widowed17.6% DivorcedWomen who did not give birth in the past 12 months Now married:
0.0% (0)Unmarried:
100.0% (21)
Marital status - Other race population 15 years and over
Males 47.0% Never married36.7% Now married5.1% Separated6.7% Widowed4.5% DivorcedFemales 52.3% Never married33.4% Now married0.2% Separated0.6% Widowed13.4% DivorcedWomen who gave birth in the past 12 months Now married:
60.9% (182)Unmarried:
39.1% (117)
Women who did not give birth in the past 12 months Now married:
23.2% (896)Unmarried:
76.8% (2,969)
Marital status - Two or more races population 15 years and over
Males 55.3% Never married28.3% Now married0.0% Separated2.3% Widowed14.1% DivorcedFemales 32.1% Never married53.0% Now married0.8% Separated3.0% Widowed11.1% DivorcedWomen who gave birth in the past 12 months Now married:
100.0% (418)Unmarried:
0.0% (0)
Women who did not give birth in the past 12 months Now married:
52.5% (3,386)Unmarried:
47.5% (3,069)
Marital status - White alone, not Hispanic / Latino population 15 years and over
Males 41.4% Never married46.5% Now married0.5% Separated1.4% Widowed10.1% DivorcedFemales 35.7% Never married41.7% Now married1.1% Separated9.1% Widowed12.3% DivorcedWomen who gave birth in the past 12 months Now married:
100.0% (685)Unmarried:
0.0% (0)
Women who did not give birth in the past 12 months Now married:
33.2% (7,009)Unmarried:
66.8% (14,131)
Marital status - Hispanic or Latino population 15 years and over
Males 53.0% Never married32.5% Now married1.7% Separated2.0% Widowed10.8% DivorcedFemales 42.3% Never married42.4% Now married1.2% Separated2.2% Widowed12.0% DivorcedWomen who gave birth in the past 12 months Now married:
87.0% (783)Unmarried:
13.0% (117)
Women who did not give birth in the past 12 months Now married:
36.3% (3,640)Unmarried:
63.7% (6,394)
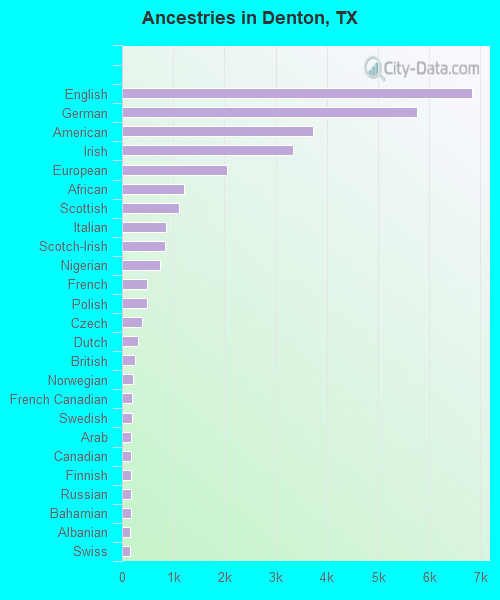
Ancestries in Denton
6,825 9.7% English5,764 8.2% German3,732 5.3% American3,342 4.7% Irish2,054 2.9% European1,206 1.7% African1,122 1.6% Scottish852 1.2% Italian833 1.2% Scotch-Irish740 1.1% Nigerian494 0.7% French485 0.7% Polish389 0.6% Czech321 0.5% Dutch254 0.4% British212 0.3% Norwegian193 0.3% French Canadian191 0.3% Swedish181 0.3% Arab181 0.3% Canadian175 0.2% Finnish174 0.2% Russian168 0.2% Bahamian165 0.2% Albanian162 0.2% Swiss149 0.2% Ghanaian148 0.2% Romanian142 0.2% Hungarian132 0.2% Welsh129 0.2% Iranian113 0.2% Czechoslovakian113 0.2% Lebanese106 0.2% Belizean101 0.1% Portuguese86 0.1% Northern European80 0.1% Slovak78 0.1% Scandinavian75 0.1% Turkish74 0.1% Kenyan72 0.1% Eastern European64 0.09% Belgian60 0.09% Danish56 0.08% Ukrainian43 0.06% Greek43 0.06% Cypriot43 0.06% Austrian37 0.05% Somali34 0.05% Lithuanian33 0.05% Bermudan32 0.05% Ethiopian26 0.04% Trinidadian and Tobagonian25 0.04% Macedonian25 0.04% Liberian25 0.04% Croatian25 0.04% West Indian23 0.03% Haitian21 0.03% Jordanian20 0.03% Iraqi20 0.03% Jamaican19 0.03% Serbian17 0.02% Cajun16 0.02% Sudanese15 0.02% Zimbabwean13 0.02% Australian11 0.02% Alsatian
Geographical mobility in Denton Same house 1 year ago 69,183 75.4% White (Caucasian)8,736 56.8% Black or African American1,404 81.1% American Indian / Alaska Native2,930 66.4% Asian53 98.2% Native Hawaiian / Pacific Islander8,838 72.9% Other race19,183 78.0% Two or more races64,091 77.0% White alone, not Hispanic / Latino27,071 73.9% Hispanic or LatinoMoved within same county 14,219 15.5% White / Caucasian3,578 23.3% Black or African American216 12.4% American Indian / Alaska Native103 2.3% Asian1,322 10.9% Other race3,016 12.3% Two or more races11,442 13.7% White alone, not Hispanic / Latino5,825 15.9% Hispanic or LatinoMoved within same state 6,192 6.7% White / Caucasian2,639 17.2% Black or African American61 3.5% American Indian / Alaska Native268 6.1% Asian1,606 13.2% Other race1,729 7.0% Two or more races5,595 6.7% White alone, not Hispanic / Latino2,946 8.0% Hispanic or LatinoMoved from different state 2,153 2.3% White / Caucasian429 2.8% Black or African American24 1.4% American Indian / Alaska Native93 0.8% Other race580 2.4% Two or more races2,153 2.6% White alone, not Hispanic / Latino491 1.3% Hispanic or LatinoMoved from abroad 4 0.2% American Indian / Alaska Native1,114 25.2% Asian262 2.2% Other race81 0.3% Two or more races284 0.8% Hispanic or Latino
Children Nativity (place of birth) in Denton
Children under 6 years - Living with two parents Both parents native 3,725 99.8% Native7 0.2% Foreign-bornBoth parents foreign-born 837 95.1% Native43 4.9% Foreign-bornOne native, one foreign-born parent 576 100.0% NativeChildren under 6 years - Living with one parent Native parent 3,097 100.0% NativeForeign-born parent 300 97.4% Native8 2.6% Foreign-bornChildren 6 to 17 years - Living with two parents Both parents native 7,934 98.7% Native103 1.3% Foreign-bornBoth parents foreign-born 1,601 73.1% Native590 26.9% Foreign-bornOne native, one foreign-born parent 1,655 97.9% Native36 2.1% Foreign-bornChildren 6 to 17 years - Living with one parent Native parent 4,708 100.0% NativeForeign-born parent 692 55.9% Native545 44.1% Foreign-born
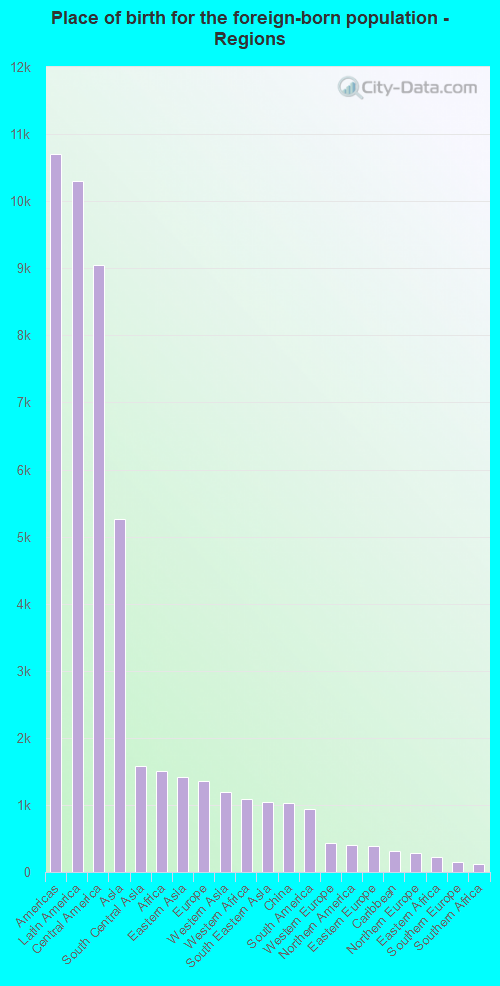
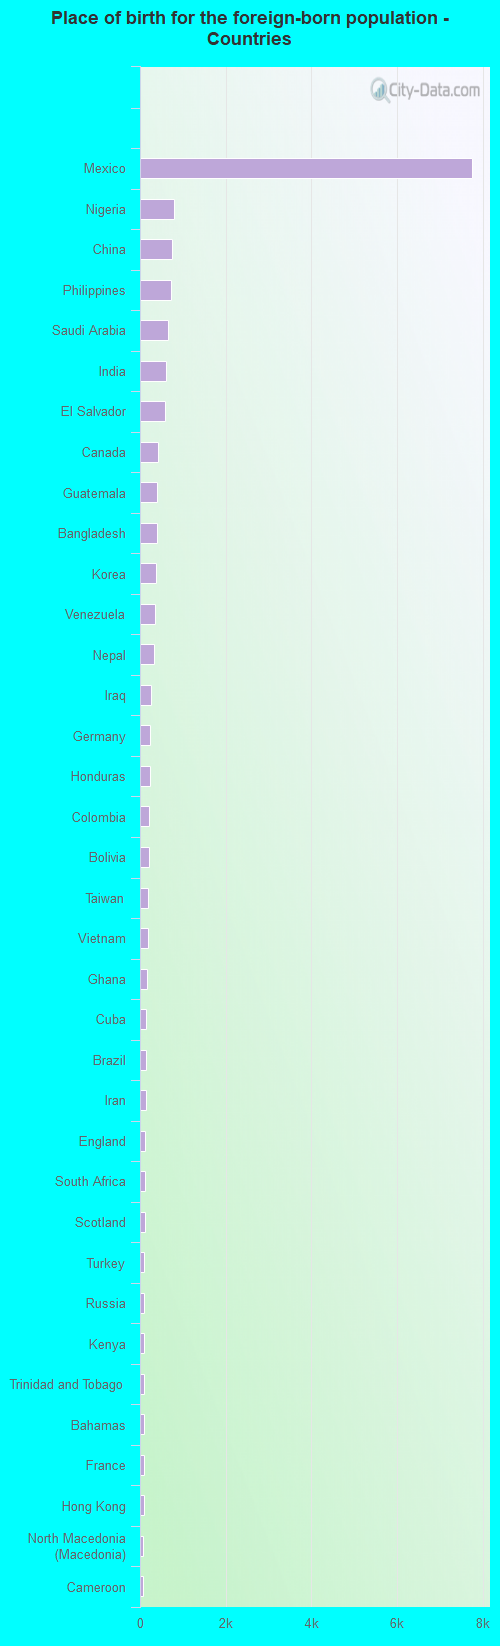
Place of birth for residents in Denton 10,705 Americas10,296 Latin America9,042 Central America5,259 Asia1,587 South Central Asia1,508 Africa1,422 Eastern Asia1,350 Europe1,193 Western Asia1,095 Western Africa1,039 South Eastern Asia1,029 China933 South America432 Western Europe409 Northern America395 Eastern Europe320 Caribbean286 Northern Europe226 Eastern Africa148 Southern Europe112 Southern Africa91 Oceania73 Middle Africa71 Australia and New Zealand Subregion7,760 Mexico787 Nigeria750 China719 Philippines657 Saudi Arabia600 India579 El Salvador409 Canada401 Guatemala389 Bangladesh377 Korea355 Venezuela332 Nepal264 Iraq245 Germany236 Honduras218 Colombia203 Bolivia193 Taiwan178 Vietnam167 Ghana143 Cuba140 Brazil138 Iran124 England112 South Africa109 Scotland102 Turkey94 Russia94 Kenya87 Trinidad and Tobago87 Bahamas86 France84 Hong Kong73 North Macedonia (Macedonia)73 Cameroon69 Portugal69 Ukraine68 Sri Lanka63 Malaysia60 Netherlands54 Liberia50 Spain48 Jordan45 Pakistan44 Belize43 Burma (Myanmar)43 Hungary39 Australia38 Bosnia and Herzegovina38 Ethiopia36 Belgium32 New Zealand32 United Kingdom27 Greece24 Thailand23 Serbia22 Ivory Coast22 Czechoslovakia20 Nicaragua16 Japan16 Marshall Islands15 Ireland15 Peru12 Kazakhstan12 Lithuania11 Zimbabwe10 United Arab Emirates10 Indonesia9 Sierra Leone9 Azerbaijan7 Uganda7 Kuwait4 Denmark4 Austria3 Micronesia3 Dominican Republic2 Bulgaria
Grandparents responsible for own grandchildren in Denton
Grandparents (30 to 59 years) White / Caucasian 142 27.5% Responsible for grandchildren373 72.5% Not responsible for grandchildrenBlack or African American 42 54.2% Responsible for grandchildren35 45.8% Not responsible for grandchildrenAmerican Indian / Alaska Native 110 100.0% Not responsible for grandchildrenOther race 50 100.0% Not responsible for grandchildrenTwo or more races 293 36.3% Responsible for grandchildren514 63.7% Not responsible for grandchildrenWhite alone, not Hispanic / Latino 152 49.2% Responsible for grandchildren157 50.8% Not responsible for grandchildrenHispanic or Latino 298 35.1% Responsible for grandchildren550 64.9% Not responsible for grandchildrenGrandparents (60 years and over) White / Caucasian 108 19.0% Responsible for grandchildren461 81.0% Not responsible for grandchildrenBlack or African American 64 89.7% Responsible for grandchildren7 10.3% Not responsible for grandchildrenAmerican Indian / Alaska Native 30 100.0% Not responsible for grandchildrenOther race 259 100.0% Not responsible for grandchildrenTwo or more races 54 71.6% Responsible for grandchildren21 28.4% Not responsible for grandchildrenWhite alone, not Hispanic / Latino 112 24.4% Responsible for grandchildren348 75.6% Not responsible for grandchildrenHispanic or Latino 36 5.7% Responsible for grandchildren589 94.3% Not responsible for grandchildren