Covington, KY (Kentucky) Houses and Residents
Estimated median house or condo value in 2022: $164,989 (it was $72,300 in 2000 )
Covington:
$164,989Kentucky:
$196,300
Lower value quartile - upper value quartile: $104,321 - $257,255Mean price in 2022: Detached houses: $202,486 Here:
$202,486State:
$256,452
Townhouses or other attached units: $448,387 Here:
$448,387State:
$264,090
In 2-unit structures: $133,374 Here:
$133,374State:
$211,203
In 3-to-4-unit structures: $292,298 Here:
$292,298State:
$169,074
In 5-or-more-unit structures: $459,974 Here:
$459,974State:
$245,174
Mobile homes: $18,769 Here:
$18,769State:
$84,635
Total population: 40,944 (All urban)
Houses: 21,266 (18,416 occupied: 9,304 owner occupied, 8,786 renter occupied )
% of renters here:
49%State:
31%
Housing density: 1,619 houses/condos per square mile
Median price asked for vacant for-sale houses and condos in 2022: $426,373.
Median contract rent in 2022: $738 (lower quartile is $570, upper quartile is $1,020)
Median rent asked for vacant for-rent units in 2022: $3,089
Median gross rent in Covington, KY in 2022: $939
Housing units in Covington with a mortgage: 6,495 (761 second mortgage, 6 home equity loan, 610 both second mortgage and home equity loan )Houses without a mortgage: 228
Median household income for houses/condos with a mortgage: $97,270
Median household income for apartments without a mortgage: $45,772
Median monthly housing costs: $941
Data:
Median house or condo value ($)
Median house or condo value ($ change since 2000)
Median house or condo value ($) - White
Median house or condo value ($) - Black or African American
Median house or condo value ($) - Asian
Median house or condo value ($) - Hispanic or Latino
Median house or condo value ($) - American Indian and Alaska Native
Median house or condo value ($) - Multirace
Median house or condo value ($) - Other Race
Median price asked for mobile homes ($)
Household density (households per square mile)
Mean house or condo value by units in structure - 1, detached ($)
Mean house or condo value by units in structure - 1, attached ($)
Mean house or condo value by units in structure - 2 ($)
Mean house or condo value by units in structure by units in structure - 3 or 4 ($)
Mean house or condo value by units in structure - 5 or more ($)
Mean house or condo value by units in structure - Boat, RV, van, etc. ($)
Mean house or condo value by units in structure - Mobile home ($)
Median contract rent ($)
Median contract rent - Lower quartile ($)
Median contract rent - Upper quartile ($)
Median gross rent ($)
Urban houses (%)
Rural houses (%)
Houses occupied (%)
Houses occupied (% change since 2000)
Houses owner occupied (%)
Houses owner occupied (% change since 2000)
Houses renter occupied (%)
Houses renter occupied (% change since 2000)
Vacant housing units - For rent (%)
Vacant housing units - For rent (% change since 2000)
Vacant housing units - For sale only (%)
Vacant housing units - For sale only (% change since 2000)
Vacant housing units - Rented or sold, not occupied (%)
Vacant housing units - Rented or sold, not occupied (% change since 2000)
Vacant housing units - For seasonal, recreational, or occasional use (%)
Vacant housing units - For seasonal, recreational, or occasional use (% change since 2000)
Vacant housing units - For migrant workers (%)
Vacant housing units - For migrant workers (% change since 2000)
Vacant housing units - Other vacant (%)
Vacant housing units - Other vacant (% change since 2000)
Median monthly housing costs ($)
Median household income for houses/condos with a mortgage ($)
Median household income for houses/condos without a mortgage ($)
Median household income ($)
Median household income ($) - White
Median household income ($) - Black or African American
Median household income ($) - Asian
Median household income ($) - Hispanic or Latino
Median household income ($) - American Indian and Alaska Native
Median household income ($) - Multirace
Median household income ($) - Other Race
Mortgage status - with mortgage (%)
Mortgage status - with second mortgage (%)
Mortgage status - with home equity loan (%)
Mortgage status - with both second mortgage and home equity loan (%)
Mortgage status - without a mortgage (%)
Median year house/condo built
Median year apartment built
Household type by relationship - Male householder living alone (%)
Household type by relationship - Male householder not living alone (%)
Household type by relationship - Female householder living alone (%)
Household type by relationship - Female householder not living alone (%)
Household type by relationship - Opposite-Sex spouse (%)
Household type by relationship - Same-Sex spouse (%)
Household type by relationship - Opposite-Sex unmarried partner (%)
Household type by relationship - Same-Sex unmarried partner (%)
Household type by relationship - In group quarters (%)
Size of family households - 2-person household (%)
Size of family households - 3-person household (%)
Size of family households - 4-person household (%)
Size of family households - 5-person household (%)
Size of family households - 6-person household (%)
Size of family households - 7-or-more-person household (%)
Size of nonfamily households - 1-person household (%)
Size of nonfamily households - 2-person household (%)
Size of nonfamily households - 3-person household (%)
Size of nonfamily households - 4-person household (%)
Size of nonfamily households - 5-person household (%)
Size of nonfamily households - 6-person household (%)
Size of nonfamily households - 7-or-moreperson household (%)
Year house built - Built 2010 or later (%)
Year house built - Built 2000 to 2009 (%)
Year house built - Built 1990 to 1999 (%)
Year house built - Built 1980 to 1989 (%)
Year house built - Built 1970 to 1979 (%)
Year house built - Built 1960 to 1969 (%)
Year house built - Built 1950 to 1959 (%)
Year house built - Built 1940 to 1949 (%)
Year house built - Built 1939 or earlier (%)
Median number of rooms in houses and condos
Median number of rooms in apartments
Median number of bedrooms in owner occupied houses
Mean number of bedrooms in owner occupied houses
Median number of bedrooms in renter occupied houses
Mean number of bedrooms in renter occupied houses
Median number of vehichles in owner occupied houses
Mean number of vehichles in owner occupied houses
Median number of vehichles in renter occupied houses
Mean number of vehichles in renter occupied houses
Rooms in owner-occupied houses - 1 room (%)
Rooms in owner-occupied houses - 2 rooms (%)
Rooms in owner-occupied houses - 3 rooms (%)
Rooms in owner-occupied houses - 4 rooms (%)
Rooms in owner-occupied houses - 5 rooms (%)
Rooms in owner-occupied houses - 6 rooms (%)
Rooms in owner-occupied houses - 7 rooms (%)
Rooms in owner-occupied houses - 8 rooms (%)
Rooms in owner-occupied houses - 9+ rooms (%)
Rooms in renter-occupied houses - 1 room (%)
Rooms in renter-occupied houses - 2 rooms (%)
Rooms in renter-occupied houses - 3 rooms (%)
Rooms in renter-occupied houses - 4 rooms (%)
Rooms in renter-occupied houses - 5 rooms (%)
Rooms in renter-occupied houses - 6 rooms (%)
Rooms in renter-occupied houses - 7 rooms (%)
Rooms in renter-occupied houses - 8 rooms (%)
Rooms in renter-occupied houses - 9+ rooms (%)
Bedrooms in owner-occupied houses - no bedrooms (%)
Bedrooms in owner-occupied houses - 1 bedroom (%)
Bedrooms in owner-occupied houses - 2 bedrooms (%)
Bedrooms in owner-occupied houses - 3 bedrooms (%)
Bedrooms in owner-occupied houses - 4 bedrooms (%)
Bedrooms in owner-occupied houses - 5+ bedrooms (%)
Bedrooms in renter-occupied houses - no bedrooms (%)
Bedrooms in renter-occupied houses - 1 bedroom (%)
Bedrooms in renter-occupied houses - 2 bedrooms (%)
Bedrooms in renter-occupied houses - 3 bedrooms (%)
Bedrooms in renter-occupied houses - 4 bedrooms (%)
Bedrooms in renter-occupied houses - 5+ bedrooms (%)
Vehicles available in owner-occupied houses - no vehicle available (%)
Vehicles available in owner-occupied houses - 1 vehicle available(%)
Vehicles available in owner-occupied houses - 2 Vehicles available (%)
Vehicles available in owner-occupied houses - 3 Vehicles available (%)
Vehicles available in owner-occupied houses - 4 Vehicles available (%)
Vehicles available in owner-occupied houses - 5+ Vehicles available (%)
Vehicles available in renter-occupied houses - no vehicle available (%)
Vehicles available in renter-occupied houses - 1 vehicle available (%)
Vehicles available in renter-occupied houses - 2 Vehicles available (%)
Vehicles available in renter-occupied houses - 3 Vehicles available (%)
Vehicles available in renter-occupied houses - 4 Vehicles available (%)
Vehicles available in renter-occupied houses - 5+ Vehicles available (%)
Housing units in structures - 1, detached (%)
Housing units in structures - 1, attached (%)
Housing units in structures - 2 (%)
Housing units in structures - 3 or 4 (%)
Housing units in structures - 5 to 9 (%)
Housing units in structures - 10 to 19 (%)
Housing units in structures - 20 to 49 (%)
Housing units in structures - 50 or more (%)
Housing units in structures - Mobile home (%)
Housing units in structures - Boat, RV, van, etc. (%)
Housing units in structures - Owners - 1, detached (%)
Housing units in structures - Owners - 1, attached (%)
Housing units in structures - Owners - 2 (%)
Housing units in structures - Owners - 3 or 4 (%)
Housing units in structures - Owners - 5 to 9 (%)
Housing units in structures - Owners - 10 to 19 (%)
Housing units in structures - Owners - 20 to 49 (%)
Housing units in structures - Owners - 50 or more (%)
Housing units in structures - Owners - Mobile home (%)
Housing units in structures - Owners - Boat, RV, van, etc. (%)
Housing units in structures - Renters - 1, detached (%)
Housing units in structures - Renters - 1, attached (%)
Housing units in structures - Renters - 2 (%)
Housing units in structures - Renters - 3 or 4 (%)
Housing units in structures - Renters - 5 to 9 (%)
Housing units in structures - Renters - 10 to 19 (%)
Housing units in structures - Renters - 20 to 49 (%)
Housing units in structures - Renters - 50 or more (%)
Housing units in structures - Renters - Mobile home (%)
Housing units in structures - Renters - Boat, RV, van, etc. (%)
House/condo owner moved in on average (years ago)
Renter moved in on average (years ago)
Year householder moved into unit - Moved in 1999 to March 2000 (%)
Year householder moved into unit - Moved in 1999 to March 2000 (%) - White
Year householder moved into unit - Moved in 1999 to March 2000 (%) - Black or African American
Year householder moved into unit - Moved in 1999 to March 2000 (%) - Asian
Year householder moved into unit - Moved in 1999 to March 2000 (%) - Hispanic or Latino
Year householder moved into unit - Moved in 1999 to March 2000 (%) - American Indian and Alaska Native
Year householder moved into unit - Moved in 1999 to March 2000 (%) - Multirace
Year householder moved into unit - Moved in 1999 to March 2000 (%) - Other Race
Year householder moved into unit - Moved in 1995 to 1998 (%)
Year householder moved into unit - Moved in 1995 to 1998 (%) - White
Year householder moved into unit - Moved in 1995 to 1998 (%) - Black or African American
Year householder moved into unit - Moved in 1995 to 1998 (%) - Asian
Year householder moved into unit - Moved in 1995 to 1998 (%) - Hispanic or Latino
Year householder moved into unit - Moved in 1995 to 1998 (%) - American Indian and Alaska Native
Year householder moved into unit - Moved in 1995 to 1998 (%) - Multirace
Year householder moved into unit - Moved in 1995 to 1998 (%) - Other Race
Year householder moved into unit - Moved in 1990 to 1994 (%)
Year householder moved into unit - Moved in 1990 to 1994 (%) - White
Year householder moved into unit - Moved in 1990 to 1994 (%) - Black or African American
Year householder moved into unit - Moved in 1990 to 1994 (%) - Asian
Year householder moved into unit - Moved in 1990 to 1994 (%) - Hispanic or Latino
Year householder moved into unit - Moved in 1990 to 1994 (%) - American Indian and Alaska Native
Year householder moved into unit - Moved in 1990 to 1994 (%) - Multirace
Year householder moved into unit - Moved in 1990 to 1994 (%) - Other Race
Year householder moved into unit - Moved in 1980 to 1989 (%)
Year householder moved into unit - Moved in 1980 to 1989 (%) - White
Year householder moved into unit - Moved in 1980 to 1989 (%) - Black or African American
Year householder moved into unit - Moved in 1980 to 1989 (%) - Asian
Year householder moved into unit - Moved in 1980 to 1989 (%) - Hispanic or Latino
Year householder moved into unit - Moved in 1980 to 1989 (%) - American Indian and Alaska Native
Year householder moved into unit - Moved in 1980 to 1989 (%) - Multirace
Year householder moved into unit - Moved in 1980 to 1989 (%) - Other Race
Year householder moved into unit - Moved in 1970 to 1979 (%)
Year householder moved into unit - Moved in 1970 to 1979 (%) - White
Year householder moved into unit - Moved in 1970 to 1979 (%) - Black or African American
Year householder moved into unit - Moved in 1970 to 1979 (%) - Asian
Year householder moved into unit - Moved in 1970 to 1979 (%) - Hispanic or Latino
Year householder moved into unit - Moved in 1970 to 1979 (%) - American Indian and Alaska Native
Year householder moved into unit - Moved in 1970 to 1979 (%) - Multirace
Year householder moved into unit - Moved in 1970 to 1979 (%) - Other Race
Year householder moved into unit - Moved in 1969 or earlier (%)
Year householder moved into unit - Moved in 1969 or earlier (%) - White
Year householder moved into unit - Moved in 1969 or earlier (%) - Black or African American
Year householder moved into unit - Moved in 1969 or earlier (%) - Asian
Year householder moved into unit - Moved in 1969 or earlier (%) - Hispanic or Latino
Year householder moved into unit - Moved in 1969 or earlier (%) - American Indian and Alaska Native
Year householder moved into unit - Moved in 1969 or earlier (%) - Multirace
Year householder moved into unit - Moved in 1969 or earlier (%) - Other Race
Housing units lacking complete plumbing facilities (%)
Housing units lacking complete kitchen facilities (%)
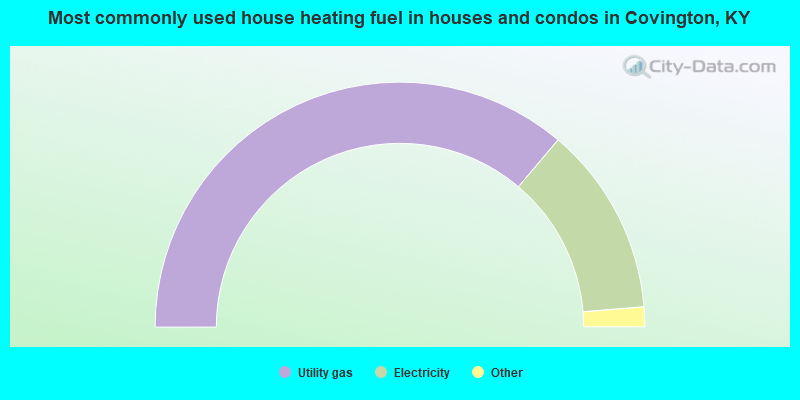
House heating fuel used in houses and condos - Utility gas (%)
House heating fuel used in houses and condos - Bottled, tank, or LP gas (%)
House heating fuel used in houses and condos - Electricity (%)
House heating fuel used in houses and condos - Fuel oil, kerosene, etc. (%)
House heating fuel used in houses and condos - Coal or coke (%)
House heating fuel used in houses and condos - Wood (%)
House heating fuel used in houses and condos - Solar energy (%)
House heating fuel used in houses and condos - Other fuel (%)
House heating fuel used in houses and condos - No fuel used (%)
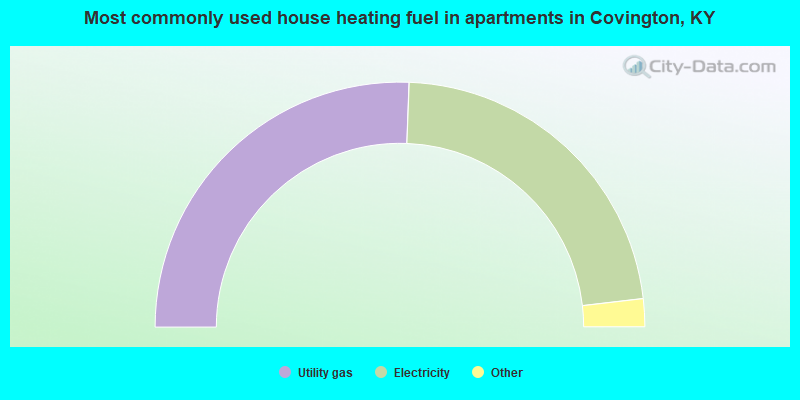
House heating fuel used in apartments - Utility gas (%)
House heating fuel used in apartments - Bottled, tank, or LP gas (%)
House heating fuel used in apartments - Electricity (%)
House heating fuel used in apartments - Fuel oil, kerosene, etc. (%)
House heating fuel used in apartments - Coal or coke (%)
House heating fuel used in apartments - Wood (%)
House heating fuel used in apartments - Solar energy (%)
House heating fuel used in apartments - Other fuel (%)
House heating fuel used in apartments - No fuel used (%)
Latest news about housing in Covington, KY collected exclusively by city-data.com from local newspapers, TV, and radio stations
Median year house/condo built: 1942Median year apartment built: 1954Household type by relationship:
Households: 41,224
Male householders: 9,033 (3,684 living alone ), Female householders: 9,344 (3,441 living alone )5,419 spouses (5,296 opposite-sex spouses ), 1,772 unmarried partners , (1,497 opposite-sex unmarried partners ), 10,163 children (9,344 natural , 292 adopted , 526 stepchildren ), 1,145 grandchildren , 575 brothers or sisters , 381 parents , 0 foster children , 495 other relatives , 1,946 non-relatives In group quarters: 946
Size of family households: 4,279 2-persons , 2,221 3-persons , 1,749 4-persons , 509 5-persons , 192 6-persons , 287 7-or-more-persons .
Size of nonfamily households: 7,262 1-person , 1,460 2-persons , 188 3-persons , 9 4-persons , 16 5-persons , 15 7-or-more-persons .
3,672 married couples with children. single-parent households (927 men , 2,638 women ).
91.5% of residents of Covington speak English at home. of residents speak Spanish at home (43% speak English very well , 28% speak English well , 23% speak English not well , 6% don't speak English at all ).of residents speak other Indo-European language at home (75% speak English very well , 18% speak English well , 7% speak English not well ).of residents speak Asian or Pacific Island language at home (48% speak English very well , 10% speak English well , 41% speak English not well ).of residents speak other language at home (20% speak English very well , 39% speak English well , 23% speak English not well , 18% don't speak English at all ).
Foreign born population: 2,130 (5.2%)of them are naturalized citizens )
Median number of rooms in houses and condos:
Median number of rooms in apartments
Owner-occupied Renter-occupied
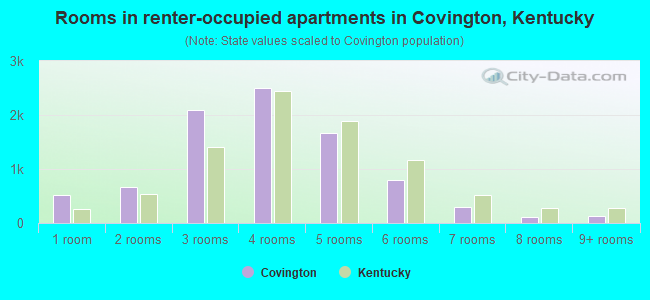
Rooms in owner-occupied houses in Covington, Kentucky
33 1 room 67 2 rooms 243 3 rooms 1,059 4 rooms 2,012 5 rooms 1,793 6 rooms 1,826 7 rooms 1,001 8 rooms 1,271 9+ rooms
Rooms in renter-occupied apartments in Covington, Kentucky
519 1 room 669 2 rooms 2,098 3 rooms 2,493 4 rooms 1,674 5 rooms 795 6 rooms 301 7 rooms 112 8 rooms 124 9+ rooms
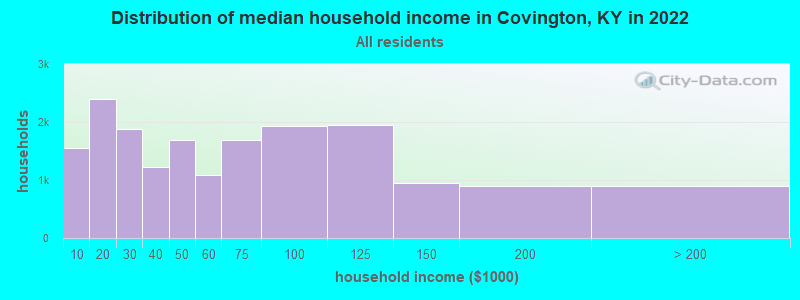
Covington, KY household income distribution 1,553 Less than $10,0002,390 $10,000 to $19,9991,878 $20,000 to $29,9991,223 $30,000 to $39,9991,696 $40,000 to $49,9991,088 $50,000 to $59,9991,693 $60,000 to $74,9991,928 $75,000 to $99,9991,951 $100,000 to $124,999948 $125,000 to $149,999890 $150,000 to $199,999901 $200,000 or more
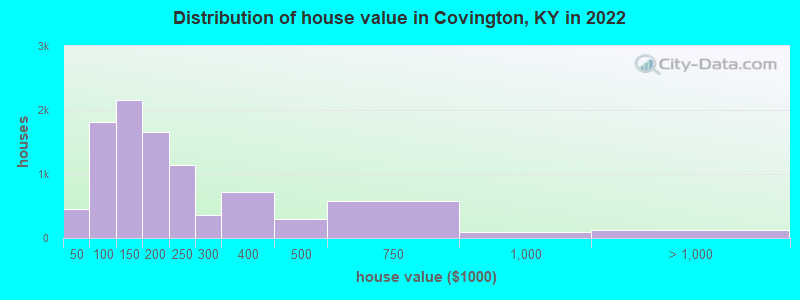
Home value of owner - occupied houses in 2022 in Covington, KY 36 Less than $10,00065 $10,000 to $14,99962 $15,000 to $19,99999 $20,000 to $24,99958 $25,000 to $29,99986 $30,000 to $34,99914 $35,000 to $39,99935 $40,000 to $49,999342 $50,000 to $59,999402 $60,000 to $69,999315 $70,000 to $79,999318 $80,000 to $89,999401 $90,000 to $99,9991,158 $100,000 to $124,999991 $125,000 to $149,9991,167 $150,000 to $174,999484 $175,000 to $199,9991,142 $200,000 to $249,999366 $250,000 to $299,999723 $300,000 to $399,999289 $400,000 to $499,999581 $500,000 to $749,99987 $750,000 to $999,99952 $1,000,000 to $1,499,99953 $1,500,000 to $1,999,99917 $2,000,000 or moreRent paid by renters in 2022 in Covington, KY 149 Less than $10032 $100 to $149111 $150 to $199382 $200 to $249305 $250 to $299204 $300 to $349114 $350 to $399239 $400 to $449354 $450 to $499447 $500 to $549359 $550 to $599610 $600 to $649474 $650 to $699926 $700 to $749380 $750 to $799609 $800 to $899499 $900 to $9991,008 $1,000 to $1,249559 $1,250 to $1,499221 $1,500 to $1,99997 $2,000 to $2,4998 $2,500 to $2,9996 $3,000 to $3,49995 $3,500 or more459 No cash rent
Percentage of workers working in this county: 52.4%Number of people working at home: 3,743 (17.7% of all workers )
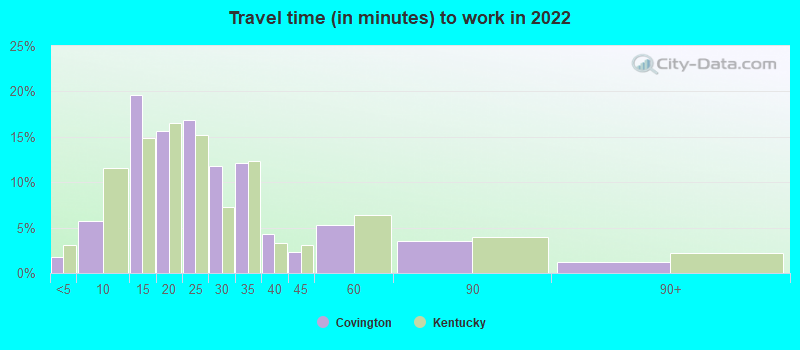
Travel time to work (commute)
Less than 5 minutes: 4205 to 9 minutes: 97410 to 14 minutes: 3,01815 to 19 minutes: 3,54920 to 24 minutes: 3,60025 to 29 minutes: 1,37530 to 34 minutes: 2,38035 to 39 minutes: 43440 to 44 minutes: 32745 to 59 minutes: 69760 to 89 minutes: 44290 or more minutes: 273
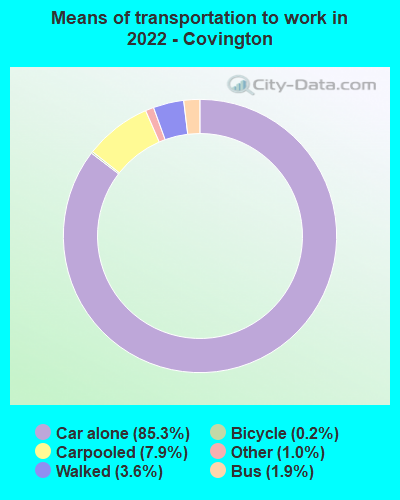
Means of transportation to work:
Drove a car alone: 15,478 (73.0%)Carpooled: 1,586 (7.5%)Bus : 225 (1.1%)Taxi: 213 (1.0%)Bicycle: 24 (0.1%)Walked: 661 (3.1%)Worked at home: 3,146 (14.8%)
Unemployment by race in 2022
Unemployment rate for White non-Hispanic residents 7.1% Males4.1% FemalesUnemployment rate for Black residents 4.0% Males15.6% FemalesUnemployment rate for American Indian and Alaska Native residents 65.6% FemalesUnemployment rate for other race residents 4.4% Males11.6% FemalesUnemployment rate for two or more race residents 11.4% Males2.6% FemalesUnemployment rate for Hispanic or Latino residents 2.1% Males15.2% Females
Year of entry for the foreign-born population in Covington, Kentucky
1,028 2010 or later 709 2000 to 2009 261 1990 to 1999 90 1980 to 1989 77 1970 to 1979 160 Before 1970
First ancestries reported:
German: 3,301 (18.6%)
American: 1,872 (10.6%)
English: 1,838 (10.4%)
Irish: 1,423 (8.0%)
Italian: 630 (3.6%)
European: 309 (1.7%)
Scottish: 271 (1.5%)
French: 149 (0.8%)
Polish: 142 (0.8%)
Moroccan: 139 (0.8%)
Scotch-Irish: 108 (0.6%)
British: 61 (0.3%)
Norwegian: 54 (0.3%)
Swiss: 51 (0.3%)
Hungarian: 48 (0.3%)
Welsh: 44 (0.2%)
Jamaican: 35 (0.2%)
Dutch: 34 (0.2%)
Iranian: 28 (0.2%)
African: 27 (0.2%)
Portuguese: 20 (0.1%)
Greek: 20 (0.1%)
Slavic: 19 (0.1%)
Finnish: 18 (0.1%)
Russian: 15 (0.08%)
Czechoslovakian: 12 (0.07%)
Latvian: 10 (0.06%)
Celtic: 10 (0.06%)
Bulgarian: 7 (0.04%)
Egyptian: 6 (0.03%)
Armenian: 6 (0.03%)
Lebanese: 6 (0.03%)
Canadian: 5 (0.03%)
Slovene: 5 (0.03%)
Eastern European: 3 (0.02%) Most common places of birth for foreign-born residents (%): Guatemala Covington:
48.1% (1,100)Kentucky:
3.7% (6,894)
Morocco Covington:
9.7% (222)Kentucky:
0.6% (1,089)
Honduras Covington:
7.0% (160)Kentucky:
2.5% (4,639)
Mexico Covington:
6.7% (153)Kentucky:
15.8% (29,070)
Vietnam Covington:
3.1% (71)Kentucky:
2.0% (3,654)
India Covington:
3.0% (69)Kentucky:
7.3% (13,454)
Germany Covington:
2.9% (66)Kentucky:
2.9% (5,302)
Philippines Covington:
2.8% (64)Kentucky:
3.3% (6,109)
Hungary Covington:
2.1% (49)Kentucky:
0.1% (202)
France Covington:
1.6% (37)Kentucky:
0.4% (704)
Korea Covington:
1.6% (36)Kentucky:
1.9% (3,585)
Place of birth for U.S.-born residents:
This state: 23,040Other state: 15,553Northeast: 990Midwest: 10,991South: 2,327West: 1,291 85.5% of Covington residents lived in the same house 1 years ago.
Out of people who lived in different houses, 37.9% lived in this county.
Out of people who lived in different counties, 57.6% lived in Kentucky.
Covington:
85.5%State average:
87.2%
Education attainment for males 25 years and older:
No schooling: 212Nursery to 4th grade: 845th and 6th grade: 707th and 8th grade: 1559th grade: 13810th grade: 53311th grade: 43412th grade, no diploma: 203High school graduate (or equivalency): 4,365Less than 1 year of college: 1,027Some college more than 1 year, no degree: 1,956Associate degree: 646Bachelor's degree: 3,577Master's degree: 1,009Professional school degree: 294Doctorate degree: 206
Education attainment for females 25 years and older:
No schooling: 160Nursery to 4th grade: 865th and 6th grade: 1567th and 8th grade: 3659th grade: 17610th grade: 28511th grade: 49312th grade, no diploma: 225High school graduate (or equivalency): 4,422Less than 1 year of college: 1,126Some college more than 1 year, no degree: 1,967Associate degree: 868Bachelor's degree: 2,925Master's degree: 1,223Professional school degree: 326Doctorate degree: 61
Housing units in structures:
One, detached: 11,774One, attached: 927Two: 2,5703 or 4: 1,3405 to 9: 1,56410 to 19: 1,08720 to 49: 56450 or more: 1,244Mobile homes: 165Boats, RVs, vans, etc.: 27Median worth of mobile homes: $11,172
Housing units lacking complete plumbing facilities in 2022: 3.1%Housing units lacking complete kitchen facilities in 2022: 3.6%House/condo owner moved in on average 11 years ago
Renter moved in on average 2 years ago
Private vs. public school enrollment:
Students in private schools in grades 1 to 8 (elementary and middle school): 672 Students in private schools in grades 9 to 12 (high school): 471 Students in private undergraduate colleges: 210