Races in Covington, Kentucky (KY) Detailed Stats
Data:
Races - White alone (%)
Races - White alone (% change since 2000)
Races - Black alone (%)
Races - Black alone (% change since 2000)
Races - American Indian alone (%)
Races - American Indian alone (% change since 2000)
Races - Asian alone (%)
Races - Asian alone (% change since 2000)
Races - Hispanic (%)
Races - Hispanic (% change since 2000)
Races - Native Hawaiian and Other Pacific Islander alone (%)
Races - Native Hawaiian and Other Pacific Islander alone (% change since 2000)
Races - Two or more races(%)
Races - Two or more races(% change since 2000)
Races - Other race alone (%)
Races - Other race alone (% change since 2000)
Racial diversity
Place of birth - Born in state of residence (%)
Place of birth - Born in state of residence (%) - White
Place of birth - Born in state of residence (%) - Black or African American
Place of birth - Born in state of residence (%) - Asian
Place of birth - Born in state of residence (%) - Hispanic or Latino
Place of birth - Born in state of residence (%) - American Indian and Alaska Native
Place of birth - Born in state of residence (%) - Multirace
Place of birth - Born in state of residence (%) - Other Race
Place of birth - Born in other state (%)
Place of birth - Born in other state (%) - White
Place of birth - Born in other state (%) - Black or African American
Place of birth - Born in other state (%) - Asian
Place of birth - Born in other state (%) - Hispanic or Latino
Place of birth - Born in other state (%) - American Indian and Alaska Native
Place of birth - Born in other state (%) - Multirace
Place of birth - Born in other state (%) - Other Race
Place of birth - Native, outside of US (%)
Place of birth - Native, outside of US (%) - White
Place of birth - Native, outside of US (%) - Black or African American
Place of birth - Native, outside of US (%) - Asian
Place of birth - Native, outside of US (%) - Hispanic or Latino
Place of birth - Native, outside of US (%) - American Indian and Alaska Native
Place of birth - Native, outside of US (%) - Multirace
Place of birth - Native, outside of US (%) - Other Race
Place of birth - Foreign born (%)
Place of birth - Foreign born (%) - White
Place of birth - Foreign born (%) - Black or African American
Place of birth - Foreign born (%) - Asian
Place of birth - Foreign born (%) - Hispanic or Latino
Place of birth - Foreign born (%) - American Indian and Alaska Native
Place of birth - Foreign born (%) - Multirace
Place of birth - Foreign born (%) - Other Race
Residents speaking English at home (%)
Residents speaking English at home - Born in the United States (%)
Residents speaking English at home - Native, born elsewhere (%)
Residents speaking English at home - Foreign born (%)
Residents speaking Spanish at home (%)
Residents speaking Spanish at home - Born in the United States (%)
Residents speaking Spanish at home - Native, born elsewhere (%)
Residents speaking Spanish at home - Foreign born (%)
Residents speaking other language at home (%)
Residents speaking other language at home - Born in the United States (%)
Residents speaking other language at home - Native, born elsewhere (%)
Residents speaking other language at home - Foreign born (%)
Marital status - Never married (%)
Marital status - Now married (%)
Marital status - Separated (%)
Marital status - Widowed (%)
Marital status - Divorced (%)
Ancestries Reported - Arab (%)
Ancestries Reported - Czech (%)
Ancestries Reported - Danish (%)
Ancestries Reported - Dutch (%)
Ancestries Reported - English (%)
Ancestries Reported - French (%)
Ancestries Reported - French Canadian (%)
Ancestries Reported - German (%)
Ancestries Reported - Greek (%)
Ancestries Reported - Hungarian (%)
Ancestries Reported - Irish (%)
Ancestries Reported - Italian (%)
Ancestries Reported - Lithuanian (%)
Ancestries Reported - Norwegian (%)
Ancestries Reported - Polish (%)
Ancestries Reported - Portuguese (%)
Ancestries Reported - Russian (%)
Ancestries Reported - Scotch-Irish (%)
Ancestries Reported - Scottish (%)
Ancestries Reported - Slovak (%)
Ancestries Reported - Subsaharan African (%)
Ancestries Reported - Swedish (%)
Ancestries Reported - Swiss (%)
Ancestries Reported - Ukrainian (%)
Ancestries Reported - United States (%)
Ancestries Reported - Welsh (%)
Ancestries Reported - West Indian (%)
Ancestries Reported - Other (%)
Geographical mobility - Same house 1 year ago (%)
Geographical mobility - Same house 1 year ago (%) - White
Geographical mobility - Same house 1 year ago (%) - Black or African American
Geographical mobility - Same house 1 year ago (%) - Asian
Geographical mobility - Same house 1 year ago (%) - Hispanic or Latino
Geographical mobility - Same house 1 year ago (%) - American Indian and Alaska Native
Geographical mobility - Same house 1 year ago (%) - Multirace
Geographical mobility - Same house 1 year ago (%) - Other Race
Geographical mobility - Moved within same county (%)
Geographical mobility - Moved within same county (%) - White
Geographical mobility - Moved within same county (%) - Black or African American
Geographical mobility - Moved within same county (%) - Asian
Geographical mobility - Moved within same county (%) - Hispanic or Latino
Geographical mobility - Moved within same county (%) - American Indian and Alaska Native
Geographical mobility - Moved within same county (%) - Multirace
Geographical mobility - Moved within same county (%) - Other Race
Geographical mobility - Moved from different county within same state (%)
Geographical mobility - Moved from different county within same state (%) - White
Geographical mobility - Moved from different county within same state (%) - Black or African American
Geographical mobility - Moved from different county within same state (%) - Asian
Geographical mobility - Moved from different county within same state (%) - Hispanic or Latino
Geographical mobility - Moved from different county within same state (%) - American Indian and Alaska Native
Geographical mobility - Moved from different county within same state (%) - Multirace
Geographical mobility - Moved from different county within same state (%) - Other Race
Geographical mobility - Moved from different state (%)
Geographical mobility - Moved from different state (%) - White
Geographical mobility - Moved from different state (%) - Black or African American
Geographical mobility - Moved from different state (%) - Asian
Geographical mobility - Moved from different state (%) - Hispanic or Latino
Geographical mobility - Moved from different state (%) - American Indian and Alaska Native
Geographical mobility - Moved from different state (%) - Multirace
Geographical mobility - Moved from different state (%) - Other Race
Geographical mobility - Moved from abroad (%)
Geographical mobility - Moved from abroad (%) - White
Geographical mobility - Moved from abroad (%) - Black or African American
Geographical mobility - Moved from abroad (%) - Asian
Geographical mobility - Moved from abroad (%) - Hispanic or Latino
Geographical mobility - Moved from abroad (%) - American Indian and Alaska Native
Geographical mobility - Moved from abroad (%) - Multirace
Geographical mobility - Moved from abroad (%) - Other Race
Place of birth for the foreign-born population - Ireland (%)
Place of birth for the foreign-born population - Denmark (%)
Place of birth for the foreign-born population - Norway (%)
Place of birth for the foreign-born population - Sweden (%)
Place of birth for the foreign-born population - United Kingdom (%)
Place of birth for the foreign-born population - England (%)
Place of birth for the foreign-born population - Scotland (%)
Place of birth for the foreign-born population - Other Northern Europe (%)
Place of birth for the foreign-born population - Austria (%)
Place of birth for the foreign-born population - Belgium (%)
Place of birth for the foreign-born population - France (%)
Place of birth for the foreign-born population - Germany (%)
Place of birth for the foreign-born population - Netherlands (%)
Place of birth for the foreign-born population - Switzerland (%)
Place of birth for the foreign-born population - Other Western Europe (%)
Place of birth for the foreign-born population - Greece (%)
Place of birth for the foreign-born population - Italy (%)
Place of birth for the foreign-born population - Portugal (%)
Place of birth for the foreign-born population - Spain (%)
Place of birth for the foreign-born population - Other Southern Europe (%)
Place of birth for the foreign-born population - Albania (%)
Place of birth for the foreign-born population - Belarus (%)
Place of birth for the foreign-born population - Bosnia and Herzegovina (%)
Place of birth for the foreign-born population - Bulgaria (%)
Place of birth for the foreign-born population - Croatia (%)
Place of birth for the foreign-born population - Czechoslovakia (%)
Place of birth for the foreign-born population - Hungary (%)
Place of birth for the foreign-born population - Latvia (%)
Place of birth for the foreign-born population - Lithuania (%)
Place of birth for the foreign-born population - North Macedonia (Macedonia) (%)
Place of birth for the foreign-born population - Moldova (%)
Place of birth for the foreign-born population - Poland (%)
Place of birth for the foreign-born population - Romania (%)
Place of birth for the foreign-born population - Russia (%)
Place of birth for the foreign-born population - Serbia (%)
Place of birth for the foreign-born population - Ukraine (%)
Place of birth for the foreign-born population - Other Eastern Europe (%)
Place of birth for the foreign-born population - China (%)
Place of birth for the foreign-born population - Hong Kong (%)
Place of birth for the foreign-born population - Taiwan (%)
Place of birth for the foreign-born population - Japan (%)
Place of birth for the foreign-born population - Korea (%)
Place of birth for the foreign-born population - Other Eastern Asia (%)
Place of birth for the foreign-born population - Afghanistan (%)
Place of birth for the foreign-born population - Bangladesh (%)
Place of birth for the foreign-born population - India (%)
Place of birth for the foreign-born population - Iran (%)
Place of birth for the foreign-born population - Kazakhstan (%)
Place of birth for the foreign-born population - Nepal (%)
Place of birth for the foreign-born population - Pakistan (%)
Place of birth for the foreign-born population - Sri Lanka (%)
Place of birth for the foreign-born population - Uzbekistan (%)
Place of birth for the foreign-born population - Other South Central Asia (%)
Place of birth for the foreign-born population - Burma (%)
Place of birth for the foreign-born population - Cambodia (%)
Place of birth for the foreign-born population - Indonesia (%)
Place of birth for the foreign-born population - Laos (%)
Place of birth for the foreign-born population - Malaysia (%)
Place of birth for the foreign-born population - Philippines (%)
Place of birth for the foreign-born population - Singapore (%)
Place of birth for the foreign-born population - Thailand (%)
Place of birth for the foreign-born population - Vietnam (%)
Place of birth for the foreign-born population - Other South Eastern Asia (%)
Place of birth for the foreign-born population - Armenia (%)
Place of birth for the foreign-born population - Iraq (%)
Place of birth for the foreign-born population - Israel (%)
Place of birth for the foreign-born population - Jordan (%)
Place of birth for the foreign-born population - Kuwait (%)
Place of birth for the foreign-born population - Lebanon (%)
Place of birth for the foreign-born population - Saudi Arabia (%)
Place of birth for the foreign-born population - Syria (%)
Place of birth for the foreign-born population - Turkey (%)
Place of birth for the foreign-born population - Yemen (%)
Place of birth for the foreign-born population - Other Western Asia (%)
Place of birth for the foreign-born population - Eritrea (%)
Place of birth for the foreign-born population - Ethiopia (%)
Place of birth for the foreign-born population - Kenya (%)
Place of birth for the foreign-born population - Somalia (%)
Place of birth for the foreign-born population - Uganda (%)
Place of birth for the foreign-born population - Zimbabwe (%)
Place of birth for the foreign-born population - Other Eastern Africa (%)
Place of birth for the foreign-born population - Cameroon (%)
Place of birth for the foreign-born population - Congo (%)
Place of birth for the foreign-born population - Democratic Republic of Congo (Zaire) (%)
Place of birth for the foreign-born population - Other Middle Africa (%)
Place of birth for the foreign-born population - Egypt (%)
Place of birth for the foreign-born population - Morocco (%)
Place of birth for the foreign-born population - Sudan (%)
Place of birth for the foreign-born population - Other Northern Africa (%)
Place of birth for the foreign-born population - South Africa (%)
Place of birth for the foreign-born population - Other Southern Africa (%)
Place of birth for the foreign-born population - Cabo Verde (%)
Place of birth for the foreign-born population - Ghana (%)
Place of birth for the foreign-born population - Liberia (%)
Place of birth for the foreign-born population - Nigeria (%)
Place of birth for the foreign-born population - Senegal (%)
Place of birth for the foreign-born population - Sierra Leone (%)
Place of birth for the foreign-born population - Other Western Africa (%)
Place of birth for the foreign-born population - Australia (%)
Place of birth for the foreign-born population - New Zealand (%)
Place of birth for the foreign-born population - Fiji (%)
Place of birth for the foreign-born population - Micronesia (%)
Place of birth for the foreign-born population - Bahamas (%)
Place of birth for the foreign-born population - Barbados (%)
Place of birth for the foreign-born population - Cuba (%)
Place of birth for the foreign-born population - Dominica (%)
Place of birth for the foreign-born population - Dominican Republic (%)
Place of birth for the foreign-born population - Grenada (%)
Place of birth for the foreign-born population - Haiti (%)
Place of birth for the foreign-born population - Jamaica (%)
Place of birth for the foreign-born population - St. Vincent and the Grenadines (%)
Place of birth for the foreign-born population - Trinidad and Tobago (%)
Place of birth for the foreign-born population - West Indies (%)
Place of birth for the foreign-born population - Other Caribbean (%)
Place of birth for the foreign-born population - Belize (%)
Place of birth for the foreign-born population - Costa Rica (%)
Place of birth for the foreign-born population - El Salvador (%)
Place of birth for the foreign-born population - Guatemala (%)
Place of birth for the foreign-born population - Honduras (%)
Place of birth for the foreign-born population - Mexico (%)
Place of birth for the foreign-born population - Nicaragua (%)
Place of birth for the foreign-born population - Panama (%)
Place of birth for the foreign-born population - Other Central America (%)
Place of birth for the foreign-born population - Argentina (%)
Place of birth for the foreign-born population - Bolivia (%)
Place of birth for the foreign-born population - Brazil (%)
Place of birth for the foreign-born population - Chile (%)
Place of birth for the foreign-born population - Colombia (%)
Place of birth for the foreign-born population - Ecuador (%)
Place of birth for the foreign-born population - Guyana (%)
Place of birth for the foreign-born population - Peru (%)
Place of birth for the foreign-born population - Uruguay (%)
Place of birth for the foreign-born population - Venezuela (%)
Place of birth for the foreign-born population - Other South America (%)
Place of birth for the foreign-born population - Canada (%)
Place of birth for the foreign-born population - Other Northern America (%)
Place of birth for the foreign-born population - Other (%)
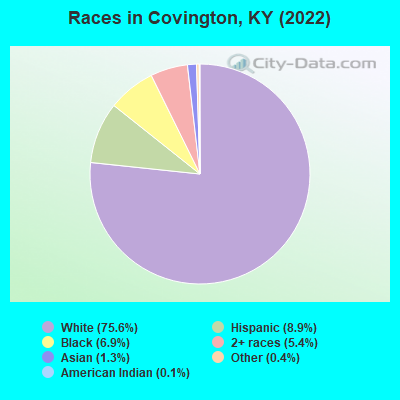
According to 2022 data, the most numerous races in Covington, KY are White alone (31,153 residents), Black alone (2,849 residents), and Hispanic (3,689 residents). 92.5% of Covington residents speak English at home. 5.5% of Covington, KY residents are foreign-born (3.4% born in Latin America, 0.9% born in Asia, 0.6% born in Africa, 0.6% born in Europe), which is 27.9% greater than the foreign-born rate of 4.0% across the entire state of Kentucky.
Race distribution in Covington
2000 2022
3,608,013 89.3% White alone 293,639 7.3% Black alone 59,939 1.5% Hispanic 37,750 0.9% Two or more races 29,368 0.7% Asian alone 7,939 0.2% American Indian alone 3,846 0.10% Other race alone 1,275 0.03% Native Hawaiian and Other
3,710,998 82.2% White alone 343,194 7.6% Black alone 187,483 4.2% Hispanic 187,394 4.2% Two or more races 62,240 1.4% Asian alone 13,529 0.3% Other race alone 4,302 0.10% American Indian alone 3,170 0.07% Native Hawaiian and Other
Income and house value in Covington Median household income in 2022 $60,227 White non-Hispanic householders$30,434 Black householders$92,230 American Indian and Alaska Native householders$123,854 Asian householders$33,115 Some other race householders$36,257 Two or more races householders$59,717 Hispanic or Latino race householdersMedian 2022 house value $164,304 White Non-Hispanic householders$136,235 Black or African American householders$39,935 American Indian or Alaska Native householders $403,457 Asian householders$294,834 Some other race householders$143,081 Two or more races householders$285,250 Hispanic or Latino householders
Median age by race in Covington
39.8 Median age for White residents38.4 42.3 32.7 Median age for Black or African American residents39.6 26.0 18.5 Median age for American Indian / Alaska Native residents25.1 21.8 35.8 Median age for Asian residents31.3 48.8 -666,666,666.0 Median age for Native Hawaiian / Pacific Islander residents-666,666,666.0 -666,666,666.0 27.4 Median age for Other race residents17.8 24.9 30.2 Median age for Two or more races residents20.1 40.9 40.5 Median age for White alone residents38.7 43.1 20.9 Median age for Hispanic or Latino residents21.0 18.9
Owner/renter occupied households by race in Covington
House owners and renters - White residents 8,714 59.6% Owner occupied5,915 40.4% Renter occupiedHouse owners and renters - Black or African American residents 334 33.8% Owner occupied654 66.2% Renter occupiedHouse owners and renters - American Indian / Alaska Native residents 12 38.6% Owner occupied19 61.4% Renter occupiedHouse owners and renters - Asian residents 162 58.9% Owner occupied113 41.1% Renter occupiedHouse owners and renters - Other race residents 168 25.1% Owner occupied500 74.9% Renter occupiedHouse owners and renters - Two or more races residents 459 44.2% Owner occupied580 55.8% Renter occupiedHouse owners and renters - White alone residents 8,691 59.7% Owner occupied5,870 40.3% Renter occupiedHouse owners and renters - Hispanic or Latino residents 112 22.1% Owner occupied392 77.9% Renter occupied
Language usage in Covington
English speakers - Total 92.5% of residents of Covington speak English at home.
6.2% of residents speak Spanish at home 1,184 49.0% Speak English very well1,231 51.0% Speak English less than very well2.4% of residents speak other language at home 381 40.6% Speak English very well557 59.4% Speak English less than very well
English speakers - Born in the United States 96.4% of residents of Covington speak English at home.
3.2% of residents speak Spanish at home 361 75.1% Speak English very well120 24.9% Speak English less than very well0.8% of residents speak other language at home 95 81.9% Speak English very well21 18.1% Speak English less than very well
English speakers - Native, born elsewhere 68.5% of residents of Covington speak English at home.
30.8% of residents speak Spanish at home 34 27.2% Speak English very well91 72.8% Speak English less than very well0.7% of residents speak other language at home 3 100.0% Speak English less than very well
English speakers - Foreign-born 24.3% of residents of Covington speak English at home.
63.4% of residents speak Spanish at home 495 37.4% Speak English very well827 62.6% Speak English less than very well31.3% of residents speak other language at home 226 34.6% Speak English very well427 65.4% Speak English less than very well
White (Caucasian) - Speak only English Native:
98.5% (29,499)Foreign-born:
31.5% (172)
White (Caucasian) - Speak another language Native:
1.4% (410)Foreign-born:
68.6% (375)
Black or African American - Speak only English Native:
100.0% (3,210)Foreign-born:
30.1% (58)
Black or African American - Speak another language Native:
0.1% (5)Foreign-born:
70.6% (135)
American Indian / Alaska Native - Speak another language Native:
31.9% (14)Foreign-born:
98.8% (31)
Asian - Speak only English Native:
99.1% (263)Foreign-born:
53.3% (192)
Asian - Speak another language Native:
7.8% (21)Foreign-born:
50.1% (181)
Other race - Speak another language Native:
58.4% (504)Foreign-born:
98.6% (1,249)
Two or more races - Speak only English Native:
84.8% (2,287)Foreign-born:
1.0% (3)
Two or more races - Speak another language Native:
15.7% (423)Foreign-born:
100.0% (327)
White alone - Speak only English Native:
99.1% (29,146)Foreign-born:
37.2% (175)
White alone - Speak another language Native:
0.9% (268)Foreign-born:
61.5% (289)
Hispanic or Latino - Speak another language Native:
40.9% (902)Foreign-born:
91.4% (745)
Foreign-born residents in Covington 2,286 residents are foreign born (3.4% Latin America , 0.9% Asia , 0.6% Africa , 0.6% Europe ).
This city:
5.5%Kentucky:
4.1%
Marital status for residents in Covington Marital status - White (Caucasian) population 15 years and over
Males 45.3% Never married36.2% Now married1.0% Separated4.7% Widowed12.8% DivorcedFemales 32.7% Never married38.4% Now married2.0% Separated10.9% Widowed16.0% DivorcedWomen who gave birth in the past 12 months Now married:
61.0% (176)Unmarried:
39.0% (113)
Women who did not give birth in the past 12 months Now married:
36.6% (2,493)Unmarried:
63.4% (4,320)
Marital status - Black or African American population 15 years and over
Males 53.4% Never married25.9% Now married0.7% Separated3.5% Widowed16.4% DivorcedFemales 47.3% Never married18.5% Now married12.3% Separated3.8% Widowed18.1% DivorcedWomen who gave birth in the past 12 months Now married:
0.0% (0)Unmarried:
100.0% (67)
Women who did not give birth in the past 12 months Now married:
32.6% (325)Unmarried:
67.4% (674)
Marital status - American Indian / Alaska Native population 15 years and over
Males 50.0% Never married42.3% Now married0.0% Separated0.0% Widowed7.7% DivorcedFemales 42.9% Never married45.7% Now married0.0% Separated0.0% Widowed11.4% DivorcedWomen who gave birth in the past 12 months Now married:
0.0% (0)Unmarried:
100.0% (9)
Women who did not give birth in the past 12 months Now married:
56.0% (17)Unmarried:
44.0% (13)
Marital status - Asian population 15 years and over
Males 68.3% Never married21.3% Now married0.0% Separated0.0% Widowed10.5% DivorcedFemales 14.2% Never married72.6% Now married0.0% Separated0.0% Widowed13.2% DivorcedWomen who did not give birth in the past 12 months Now married:
75.4% (77)Unmarried:
24.6% (25)
Marital status - Native Hawaiian / Pacific Islander population 15 years and over
Males 0.0% Never married0.0% Now married0.0% Separated0.0% Widowed100.0% DivorcedFemales 0.0% Never married0.0% Now married0.0% Separated100.0% Widowed0.0% DivorcedMarital status - Other race population 15 years and over
Males 65.5% Never married23.9% Now married9.1% Separated0.0% Widowed1.5% DivorcedFemales 65.0% Never married32.7% Now married2.0% Separated0.0% Widowed0.2% DivorcedWomen who gave birth in the past 12 months Now married:
32.9% (33)Unmarried:
67.1% (67)
Women who did not give birth in the past 12 months Now married:
33.6% (161)Unmarried:
66.4% (317)
Marital status - Two or more races population 15 years and over
Males 70.0% Never married28.0% Now married0.0% Separated0.6% Widowed1.3% DivorcedFemales 49.6% Never married26.2% Now married3.2% Separated9.3% Widowed11.7% DivorcedWomen who gave birth in the past 12 months Now married:
0.0% (0)Unmarried:
100.0% (11)
Women who did not give birth in the past 12 months Now married:
24.3% (149)Unmarried:
75.7% (465)
Marital status - White alone, not Hispanic / Latino population 15 years and over
Males 45.5% Never married35.7% Now married1.0% Separated4.8% Widowed13.0% DivorcedFemales 31.9% Never married38.7% Now married2.0% Separated11.1% Widowed16.3% DivorcedWomen who gave birth in the past 12 months Now married:
61.0% (175)Unmarried:
39.0% (112)
Women who did not give birth in the past 12 months Now married:
37.2% (2,434)Unmarried:
62.8% (4,107)
Marital status - Hispanic or Latino population 15 years and over
Males 55.9% Never married31.4% Now married5.9% Separated0.0% Widowed6.8% DivorcedFemales 64.7% Never married30.4% Now married1.1% Separated2.1% Widowed1.8% DivorcedWomen who gave birth in the past 12 months Now married:
29.8% (27)Unmarried:
70.2% (64)
Women who did not give birth in the past 12 months Now married:
26.7% (194)Unmarried:
73.3% (534)
Ancestries in Covington
3,301 18.6% German1,872 10.6% American1,838 10.4% English1,423 8.0% Irish630 3.6% Italian309 1.7% European271 1.5% Scottish149 0.8% French142 0.8% Polish139 0.8% Moroccan108 0.6% Scotch-Irish61 0.3% British54 0.3% Norwegian51 0.3% Swiss48 0.3% Hungarian44 0.2% Welsh35 0.2% Jamaican34 0.2% Dutch28 0.2% Iranian27 0.2% African20 0.1% Portuguese20 0.1% Greek19 0.1% Slavic18 0.1% Finnish15 0.08% Russian12 0.07% Czechoslovakian10 0.06% Latvian10 0.06% Celtic7 0.04% Bulgarian6 0.03% Egyptian6 0.03% Armenian6 0.03% Lebanese5 0.03% Canadian5 0.03% Slovene3 0.02% Eastern European
Geographical mobility in Covington Same house 1 year ago 27,624 86.8% White (Caucasian)3,096 81.8% Black or African American79 81.8% American Indian / Alaska Native300 65.4% Asian59 100.0% Native Hawaiian / Pacific Islander1,687 66.4% Other race2,874 84.4% Two or more races27,231 87.7% White alone, not Hispanic / Latino1,885 54.4% Hispanic or LatinoMoved within same county 1,384 4.3% White / Caucasian432 11.4% Black or African American43 9.4% Asian541 21.3% Other race324 9.5% Two or more races1,255 4.0% White alone, not Hispanic / Latino1,092 31.5% Hispanic or LatinoMoved within same state 1,379 4.3% White / Caucasian83 2.2% Black or African American9 9.6% American Indian / Alaska Native38 1.5% Other race64 1.9% Two or more races1,367 4.4% White alone, not Hispanic / Latino47 1.4% Hispanic or LatinoMoved from different state 965 3.0% White / Caucasian137 3.6% Black or African American83 18.2% Asian134 5.3% Other race49 1.4% Two or more races941 3.0% White alone, not Hispanic / Latino129 3.7% Hispanic or LatinoMoved from abroad 147 0.5% White45 9.8% Asian25 0.7% Two or more races17 0.1% White alone, not Hispanic / Latino183 5.3% Hispanic or Latino
Children Nativity (place of birth) in Covington
Children under 6 years - Living with two parents Both parents native 1,026 100.0% NativeBoth parents foreign-born 332 100.0% NativeOne native, one foreign-born parent 101 100.0% NativeChildren under 6 years - Living with one parent Native parent 1,261 100.0% NativeForeign-born parent 124 100.0% NativeChildren 6 to 17 years - Living with two parents Both parents native 1,785 99.0% Native19 1.0% Foreign-bornBoth parents foreign-born 365 97.8% Native8 2.2% Foreign-bornOne native, one foreign-born parent 106 100.0% NativeChildren 6 to 17 years - Living with one parent Native parent 1,942 100.0% NativeForeign-born parent 429 57.0% Native323 43.0% Foreign-born
Grandparents responsible for own grandchildren in Covington
Grandparents (30 to 59 years) White / Caucasian 223 56.0% Responsible for grandchildren175 44.0% Not responsible for grandchildrenBlack or African American 57 93.4% Responsible for grandchildren4 6.6% Not responsible for grandchildrenWhite alone, not Hispanic / Latino 223 56.0% Responsible for grandchildren175 44.0% Not responsible for grandchildrenGrandparents (60 years and over) White / Caucasian 74 30.8% Responsible for grandchildren166 69.2% Not responsible for grandchildrenBlack or African American 19 35.3% Responsible for grandchildren34 64.7% Not responsible for grandchildrenWhite alone, not Hispanic / Latino 74 30.8% Responsible for grandchildren166 69.2% Not responsible for grandchildren