Corpus Christi, TX (Texas) Houses and Residents
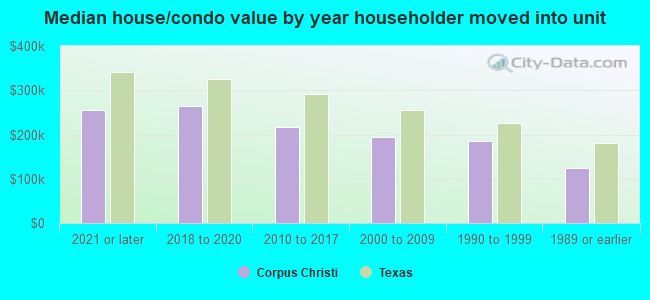
| Corpus Christi: | $206,500 |
| Texas: | $275,400 |
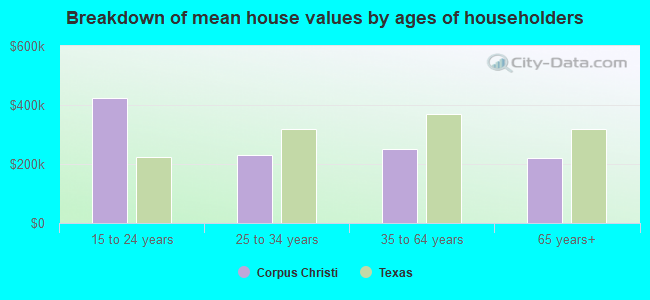
Mean price in 2022:
Detached houses: $265,919
Here: $265,919 State: $369,058 Townhouses or other attached units: $228,128
Here: $228,128 State: $327,631 In 2-unit structures: $246,319
Here: $246,319 State: $374,947 In 3-to-4-unit structures: $105,857
Here: $105,857 State: $209,652 In 5-or-more-unit structures: $263,984
Here: $263,984 State: $413,944 Mobile homes: $58,194
Here: $58,194 State: $124,413 Occupied boats, RVs, vans, etc.: $89,332
Here: $89,332 State: $73,921
Total population: 320,434 (Urban population: 273,996, Rural population: 3,573 (18 farm, 3,555 nonfarm))
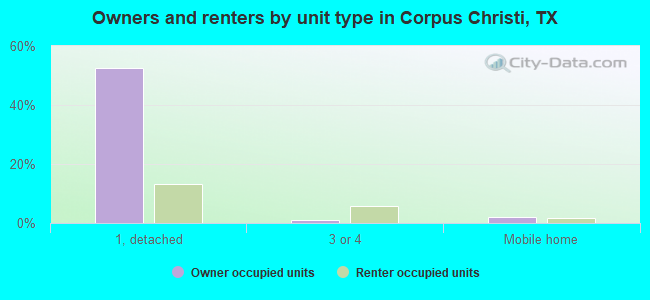
Houses: 137,142 (120,383 occupied: 70,223 owner occupied, 50,160 renter occupied)
| % of renters here: | 42% |
| State: | 38% |
Housing density: 887 houses/condos per square mile
Median price asked for vacant for-sale houses and condos in 2022: $296,661.
Median contract rent in 2022: $962 (lower quartile is $724, upper quartile is $1,235)
Median rent asked for vacant for-rent units in 2022: $2,502
Median gross rent in Corpus Christi, TX in 2022: $1,163
Housing units in Corpus Christi with a mortgage: 39,633 (821 second mortgage, 85 home equity loan, 714 both second mortgage and home equity loan)
Houses without a mortgage: 528
Median household income for houses/condos with a mortgage: $99,926
Median household income for apartments without a mortgage: $60,848
Median monthly housing costs: $1,159
Compare current foreclosures in Corpus Christi, TX:
| Photo | Address | Area | Beds / Baths | Price | Details |
|---|---|---|---|---|---|

|
#1
Maverick Drive
Corpus Christi, TX 78410
|
1,621 sq. feet
|
2 baths 3 beds |
show details | |

|
#2
Sherman St
Corpus Christi, TX 78416
|
2,031 sq. feet
|
2 baths 5 beds |
show details | |

|
#3
Revolution Dr
Corpus Christi, TX 78413
|
2,649 sq. feet
|
2 baths 4 beds |
show details | |

|
#4
Annapolis Dr
Corpus Christi, TX 78415
|
- sq. feet
|
1 baths 3 beds |
show details | |

|
#5
15th St
Corpus Christi, TX 78404
|
1,344 sq. feet
|
1 baths 2 beds |
show details | |

|
#6
Elgin St
Corpus Christi, TX 78405
|
2,557 sq. feet
|
3 baths 4 beds |
show details | |

|
#7
Merriman Ave
Corpus Christi, TX 78412
|
1,355 sq. feet
|
2 baths 3 beds |
show details | |

|
#8
Hemlock Rd
Corpus Christi, TX 78410
|
1,412 sq. feet
|
2 baths 4 beds |
show details | |

|
#9
Navarro St
Corpus Christi, TX 78415
|
1,435 sq. feet
|
2 baths 4 beds |
show details | |

|
#10
Barlow Trl
Corpus Christi, TX 78410
|
- sq. feet
|
2 baths 4 beds |
show details |
| Photo | Address | Area | Beds / Baths | Price | Details |
|---|---|---|---|---|---|

|
#11
Sir Moses
Corpus Christi, TX 78414
|
- sq. feet
|
3 baths 4 beds |
show details | |

|
#12
Red River Dr
Corpus Christi, TX 78410
|
2,586 sq. feet
|
2 baths 4 beds |
show details | |

|
#13
Evergreen Dr
Corpus Christi, TX 78412
|
2,581 sq. feet
|
2 baths 4 beds |
show details | |

|
#14
Cascade Dr
Corpus Christi, TX 78413
|
- sq. feet
|
2 baths 4 beds |
show details | |

|
#15
Green Trail Dr
Corpus Christi, TX 78405
|
990 sq. feet
|
2 baths 3 beds |
show details | |

|
#16
Randolph Cir
Corpus Christi, TX 78410
|
3,766 sq. feet
|
4 baths 3 beds |
show details | |

|
#17
Round Table St
Corpus Christi, TX 78414
|
2,210 sq. feet
|
3 baths 4 beds |
show details | |

|
#18
Spitfire Dr
Corpus Christi, TX 78412
|
1,469 sq. feet
|
2 baths 3 beds |
show details | |

|
#19
Black Oak Dr
Corpus Christi, TX 78418
|
2,402 sq. feet
|
3 baths 4 beds |
show details | |

|
#20
Whiteley Dr Apt 405
Corpus Christi, TX 78418
|
860 sq. feet
|
2 baths 1 beds |
show details |
| Photo | Address | Area | Beds / Baths | Price | Details |
|---|---|---|---|---|---|

|
#21
Falcon Dr
Corpus Christi, TX 78414
|
1,092 sq. feet
|
- baths 3 beds |
show details | |

|
#22
Brockhampton Ct
Corpus Christi, TX 78414
|
1,842 sq. feet
|
- baths 3 beds |
show details | |

|
#23
Manitoulin Island Dr
Corpus Christi, TX 78414
|
1,232 sq. feet
|
- baths 3 beds |
show details | |

|
#24
Jessica Dr
Corpus Christi, TX 78414
|
1,727 sq. feet
|
- baths 3 beds |
show details | |

|
#25
Calle San Miguel
Corpus Christi, TX 78417
|
1,354 sq. feet
|
- baths 3 beds |
show details | |

|
#26
Beal Dr
Corpus Christi, TX 78410
|
5,090 sq. feet
|
- baths 6 beds |
show details | |

|
#27
Windhollow Dr
Corpus Christi, TX 78414
|
2,147 sq. feet
|
- baths 4 beds |
show details | |

|
#28
Caravel Dr
Corpus Christi, TX 78418
|
1,746 sq. feet
|
- baths - beds |
show details | |

|
#29
Daly Dr
Corpus Christi, TX 78412
|
1,960 sq. feet
|
- baths 3 beds |
show details | |

|
#30
Olive Grove Dr
Corpus Christi, TX 78414
|
2,240 sq. feet
|
- baths 3 beds |
show details |
| Photo | Address | Area | Beds / Baths | Price | Details |
|---|---|---|---|---|---|

|
#31
Crestlea Dr
Corpus Christi, TX 78415
|
1,310 sq. feet
|
- baths 3 beds |
show details | |

|
#32
Nautical Wind Dr
Corpus Christi, TX 78414
|
1,356 sq. feet
|
- baths 3 beds |
show details | |

|
#33
Annapolis Dr
Corpus Christi, TX 78404
|
876 sq. feet
|
- baths - beds |
show details | |

|
#34
Cedar St
Corpus Christi, TX 78411
|
721 sq. feet
|
- baths - beds |
show details | |

|
#35
High Arch Ct
Corpus Christi, TX 78412
|
2,190 sq. feet
|
- baths 3 beds |
show details | |

|
#36
Timbergate Dr, Apt 13304
Corpus Christi, TX 78414
|
- sq. feet
|
- baths - beds |
show details | |

|
#37
Collingswood Dr
Corpus Christi, TX 78412
|
1,099 sq. feet
|
- baths - beds |
show details | |

|
#38
Islla Dr
Corpus Christi, TX 78416
|
876 sq. feet
|
- baths - beds |
show details | |

|
#39
Willowbrook Dr
Corpus Christi, TX 78411
|
- sq. feet
|
- baths - beds |
show details | |

|
#40
Buford St
Corpus Christi, TX 78404
|
792 sq. feet
|
- baths - beds |
show details |
| Photo | Address | Area | Beds / Baths | Price | Details |
|---|---|---|---|---|---|

|
#41
Twine Dr
Corpus Christi, TX 78414
|
2,003 sq. feet
|
- baths - beds |
show details | |

|
#42
Lynnwood Ln
Corpus Christi, TX 78415
|
1,443 sq. feet
|
- baths - beds |
show details | |

|
#43
Sandy Oaks Dr
Corpus Christi, TX 78418
|
1,064 sq. feet
|
- baths - beds |
show details | |

|
#44
Dune Dr
Corpus Christi, TX 78418
|
- sq. feet
|
- baths - beds |
show details | |

|
#45
Caravelle Pkwy Apt 2911
Corpus Christi, TX 78415
|
- sq. feet
|
- baths - beds |
show details | |

|
#46
Hannigan Dr
Corpus Christi, TX 78413
|
1,919 sq. feet
|
- baths - beds |
show details | |

|
#47
Ayers St Lot 64
Corpus Christi, TX 78415
|
2,128 sq. feet
|
- baths - beds |
show details | |

|
#48
Saint Joseph St Apt H
Corpus Christi, TX 78418
|
- sq. feet
|
- baths - beds |
show details | |

|
#49
Sunset Ave
Corpus Christi, TX 78404
|
1,364 sq. feet
|
- baths - beds |
show details | |

|
Check over 1 million property listings on Foreclosure.com!
|
browse all offers | |||


 | House Foundation - slab vs pier & beam and location (4 replies) |
| Seeking Real Estate Feedback for Home Purchase (2 replies) |
| Real Estate Investing in Corpus Christi (1 reply) |
| Homes for sale along Ocean Drive-will they ever sell? (4 replies) |
| Baypoint Resort Apartments, Corpus Christi (0 replies) |
| Moving from Vegas to Corpus Christi (1 reply) |

Median year apartment built: 1982
Household type by relationship:
Households: 316,228- Male householders: 57,224 (16,767 living alone), Female householders: 63,159 (15,029 living alone)
52,888 spouses (52,296 opposite-sex spouses), 7,899 unmarried partners, (7,217 opposite-sex unmarried partners), 92,442 children (86,585 natural, 1,762 adopted, 4,095 stepchildren), 10,914 grandchildren, 5,650 brothers or sisters, 4,954 parents, 70 foster children, 5,338 other relatives, 7,862 non-relatives
- In group quarters: 7,828
Size of family households: 36,297 2-persons, 21,961 3-persons, 14,689 4-persons, 6,026 5-persons, 1,704 6-persons, 1,924 7-or-more-persons.
Size of nonfamily households: 31,796 1-person, 5,344 2-persons, 500 3-persons, 142 4-persons.
37,129 married couples with children.
25,765 single-parent households (3,959 men, 21,806 women).
66.6% of residents of Corpus Christi speak English at home.
31.1% of residents speak Spanish at home (80% speak English very well, 13% speak English well, 5% speak English not well, 2% don't speak English at all).
0.9% of residents speak other Indo-European language at home (84% speak English very well, 13% speak English well, 3% speak English not well).
1.6% of residents speak Asian or Pacific Island language at home (70% speak English very well, 21% speak English well, 7% speak English not well, 2% don't speak English at all).
0.2% of residents speak other language at home (78% speak English very well, 21% speak English well, 1% speak English not well).
Foreign born population: 26,018 (8.2%)
(43.0% of them are naturalized citizens)
| Here: | 5.6 |
| State: | 6.3 |
| Here: | 4.0 |
| State: | 4.0 |
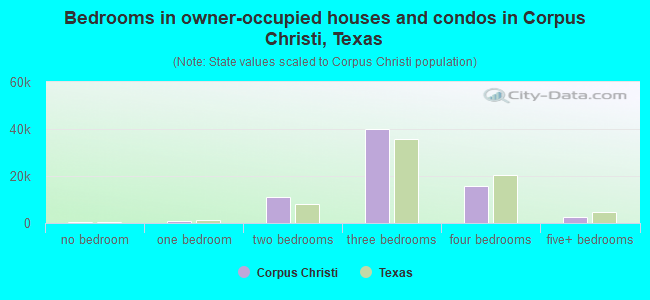
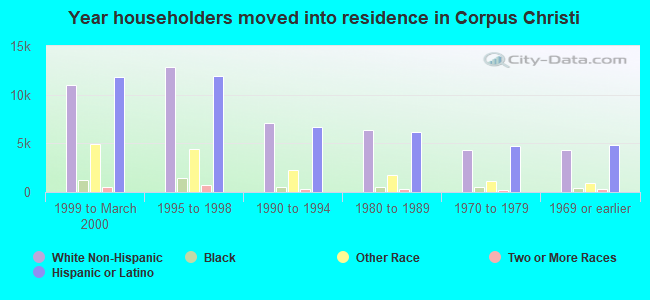
- Bedrooms in owner-occupied houses and condos in Corpus Christi, Texas
- 570no bedroom
- 6921 bedroom
- 10,9892 bedrooms
- 39,8133 bedrooms
- 15,6454 bedrooms
- 2,5145+ bedrooms
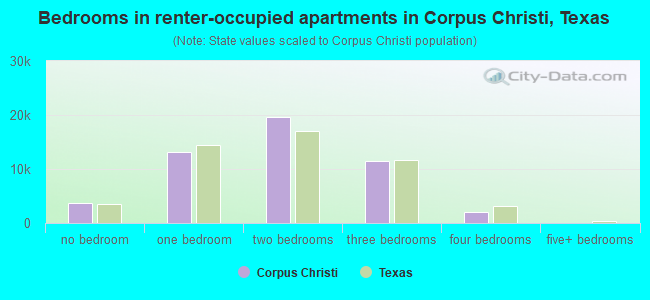
- Bedrooms in renter-occupied apartments in Corpus Christi, Texas
- 3,765no bedroom
- 13,1021 bedroom
- 19,6632 bedrooms
- 11,5663 bedrooms
- 1,9744 bedrooms
- 905+ bedrooms
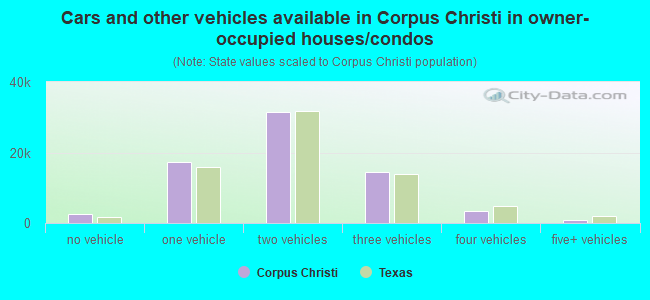
- Cars and other vehicles available in Corpus Christi in owner-occupied houses/condos
- 2,588no vehicle
- 17,3931 vehicle
- 31,5422 vehicles
- 14,5033 vehicles
- 3,3984 vehicles
- 7995+ vehicles
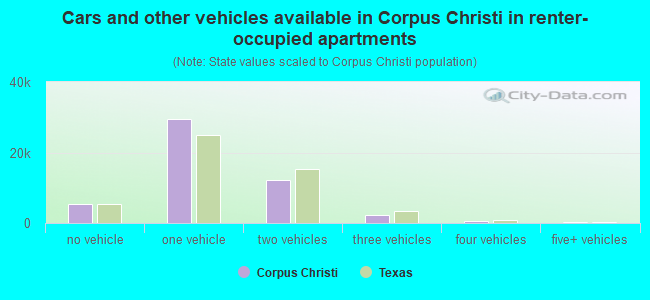
- Cars and other vehicles available in Corpus Christi in renter-occupied apartments
- 5,517no vehicle
- 29,3761 vehicle
- 12,1022 vehicles
- 2,3433 vehicles
- 4674 vehicles
- 3555+ vehicles
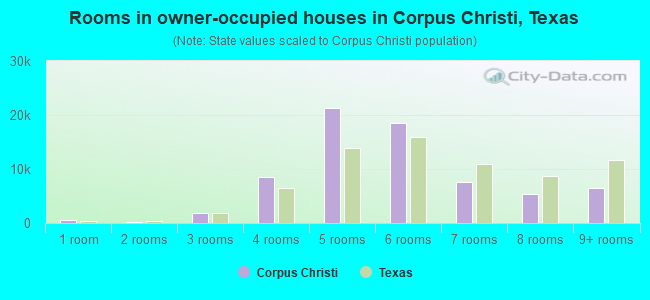
- Rooms in owner-occupied houses in Corpus Christi, Texas
- 5701 room
- 1152 rooms
- 1,7753 rooms
- 8,5904 rooms
- 21,3535 rooms
- 18,5126 rooms
- 7,5397 rooms
- 5,3348 rooms
- 6,4359+ rooms
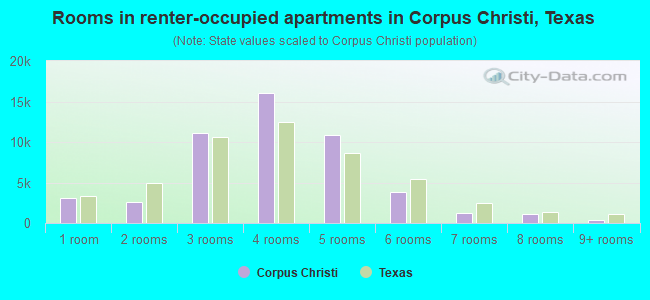
- Rooms in renter-occupied apartments in Corpus Christi, Texas
- 3,1271 room
- 2,5502 rooms
- 11,0783 rooms
- 16,0334 rooms
- 10,9055 rooms
- 3,8416 rooms
- 1,1937 rooms
- 1,0538 rooms
- 3809+ rooms
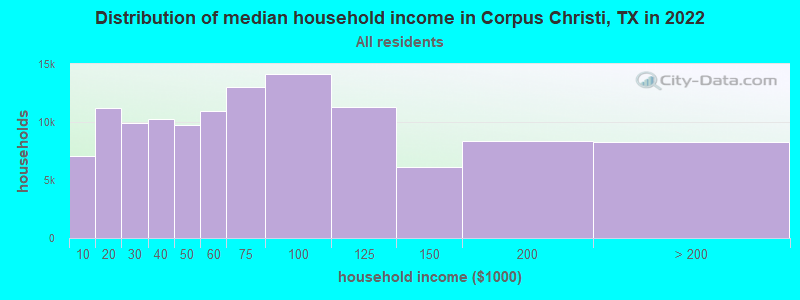
Corpus Christi, TX household income distribution

- 7,102Less than $10,000
- 11,199$10,000 to $19,999
- 9,887$20,000 to $29,999
- 10,252$30,000 to $39,999
- 9,770$40,000 to $49,999
- 10,969$50,000 to $59,999
- 13,036$60,000 to $74,999
- 14,138$75,000 to $99,999
- 11,299$100,000 to $124,999
- 6,108$125,000 to $149,999
- 8,384$150,000 to $199,999
- 8,239$200,000 or more
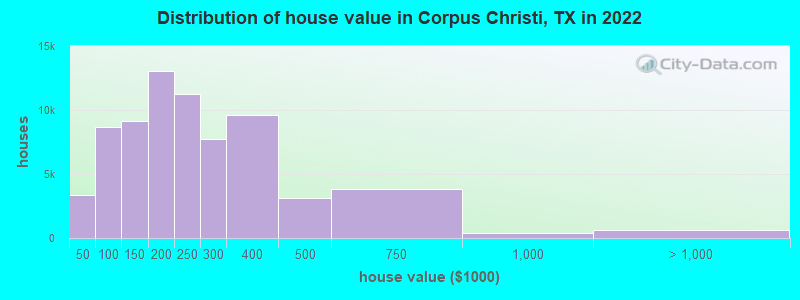
Home value of owner - occupied houses in 2022 in Corpus Christi, TX
-
- 906Less than $10,000
- 343$10,000 to $14,999
- 396$15,000 to $19,999
- 317$20,000 to $24,999
- 79$25,000 to $29,999
- 621$30,000 to $34,999
- 76$35,000 to $39,999
- 647$40,000 to $49,999
- 638$50,000 to $59,999
- 1,155$60,000 to $69,999
- 1,313$70,000 to $79,999
- 2,303$80,000 to $89,999
- 2,621$90,000 to $99,999
- 4,713$100,000 to $124,999
- 4,448$125,000 to $149,999
- 6,193$150,000 to $174,999
- 6,882$175,000 to $199,999
- 11,229$200,000 to $249,999
- 7,753$250,000 to $299,999
- 9,624$300,000 to $399,999
- 3,117$400,000 to $499,999
- 3,822$500,000 to $749,999
- 427$750,000 to $999,999
- 257$1,000,000 to $1,499,999
- 37$1,500,000 to $1,999,999
- 306$2,000,000 or more
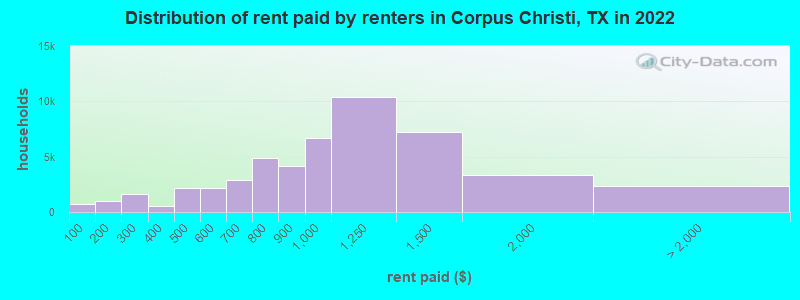
Rent paid by renters in 2022 in Corpus Christi, TX
-
- 680Less than $100
- 415$100 to $149
- 617$150 to $199
- 881$200 to $249
- 713$250 to $299
- 339$300 to $349
- 220$350 to $399
- 786$400 to $449
- 1,400$450 to $499
- 1,622$500 to $549
- 578$550 to $599
- 1,500$600 to $649
- 1,421$650 to $699
- 2,179$700 to $749
- 2,673$750 to $799
- 4,150$800 to $899
- 6,712$900 to $999
- 10,353$1,000 to $1,249
- 7,236$1,250 to $1,499
- 3,325$1,500 to $1,999
- 920$2,000 to $2,499
- 126$3,000 to $3,499
- 1,314No cash rent
Percentage of workers working in this county: 92.8%
Number of people working at home: 7,204 (4.7% of all workers)
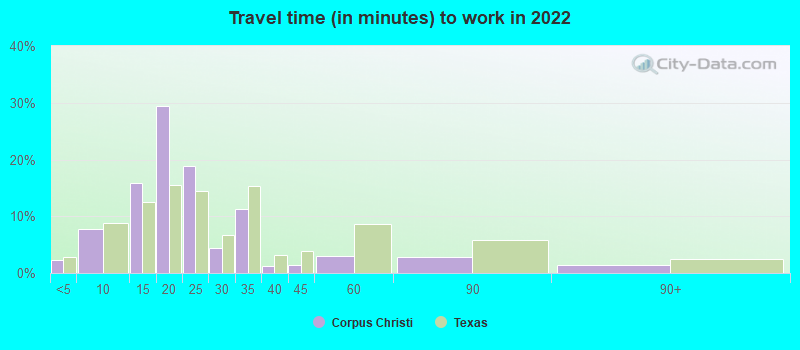
Travel time to work (commute)
- Less than 5 minutes: 3,244
- 5 to 9 minutes: 11,270
- 10 to 14 minutes: 22,828
- 15 to 19 minutes: 45,370
- 20 to 24 minutes: 28,727
- 25 to 29 minutes: 6,559
- 30 to 34 minutes: 15,839
- 35 to 39 minutes: 1,174
- 40 to 44 minutes: 1,375
- 45 to 59 minutes: 3,746
- 60 to 89 minutes: 3,228
- 90 or more minutes: 1,223
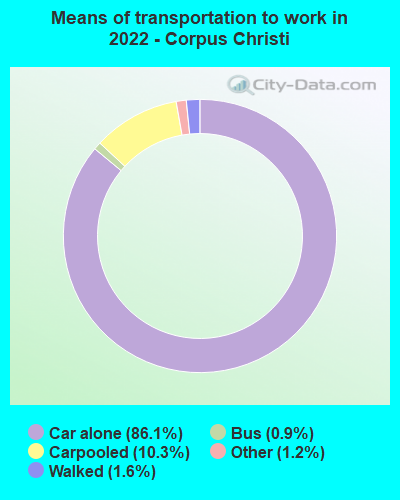
Means of transportation to work:
- Drove a car alone: 126,816 (82.1%)
- Carpooled: 15,139 (9.8%)
- Bus: 1,266 (0.8%)
- Taxi: 1,751 (1.1%)
- Walked: 2,284 (1.5%)
- Worked at home: 7,204 (4.7%)
- Unemployment by race in 2022
- Unemployment rate for White non-Hispanic residents
- 4.8%Males
- 6.1%Females
- Unemployment rate for Black residents
- 5.3%Males
- 19.8%Females
- Unemployment rate for American Indian and Alaska Native residents
- 21.6%Males
- 5.5%Females
- Unemployment rate for Asian residents
- 2.3%Males
- 2.8%Females
- Unemployment rate for other race residents
- 1.7%Males
- 3.5%Females
- Unemployment rate for two or more race residents
- 4.9%Males
- 3.6%Females
- Unemployment rate for Hispanic or Latino residents
- 4.4%Males
- 4.4%Females
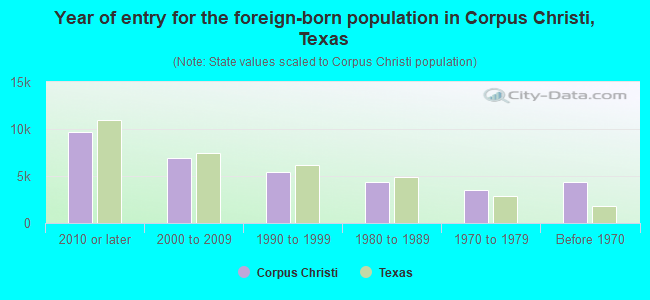
- Year of entry for the foreign-born population in Corpus Christi, Texas
- 9,6292010 or later
- 6,9272000 to 2009
- 5,3941990 to 1999
- 4,3811980 to 1989
- 3,5221970 to 1979
- 4,311Before 1970
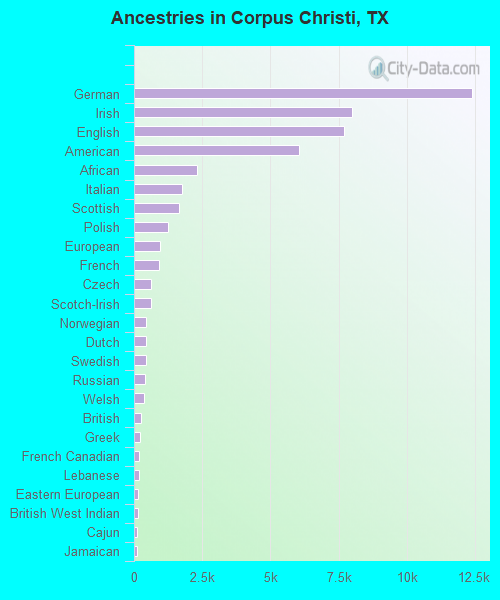
First ancestries reported:
- German: 12,386 (5.3%)
- Irish: 7,973 (3.4%)
- English: 7,686 (3.3%)
- American: 6,047 (2.6%)
- African: 2,326 (1.0%)
- Italian: 1,743 (0.7%)
- Scottish: 1,631 (0.7%)
- Polish: 1,262 (0.5%)
- European: 941 (0.4%)
- French: 927 (0.4%)
- Czech: 613 (0.3%)
- Scotch-Irish: 612 (0.3%)
- Norwegian: 451 (0.2%)
- Dutch: 446 (0.2%)
- Swedish: 439 (0.2%)
- Russian: 395 (0.2%)
- Welsh: 366 (0.2%)
- British: 245 (0.1%)
- Greek: 224 (0.10%)
- French Canadian: 179 (0.08%)
- Lebanese: 166 (0.07%)
- Eastern European: 143 (0.06%)
- British West Indian: 138 (0.06%)
- Cajun: 125 (0.05%)
- Jamaican: 115 (0.05%)
- Canadian: 114 (0.05%)
- Palestinian: 110 (0.05%)
- Iranian: 108 (0.05%)
- Czechoslovakian: 101 (0.04%)
- Turkish: 101 (0.04%)
- Hungarian: 100 (0.04%)
- Danish: 90 (0.04%)
- Nigerian: 77 (0.03%)
- Portuguese: 74 (0.03%)
- Armenian: 73 (0.03%)
- Romanian: 62 (0.03%)
- Barbadian: 59 (0.03%)
- Austrian: 58 (0.02%)
- Scandinavian: 54 (0.02%)
- Slovak: 54 (0.02%)
- Finnish: 51 (0.02%)
- Brazilian: 46 (0.02%)
- Swiss: 40 (0.02%)
- Ukrainian: 36 (0.02%)
- Lithuanian: 31 (0.01%)
- Syrian: 23 (0.01%)
- Serbian: 22 (0.01%)
- Slavic: 21 (0.01%)
- Haitian: 21 (0.01%)
- Pennsylvania German: 19 (0.01%)
- Bulgarian: 17 (0.01%)
- Ugandan: 17 (0.01%)
- Northern European: 14 (0.01%)
- Croatian: 14 (0.01%)
- Latvian: 12 (0.01%)
- Egyptian: 12 (0.01%)
- Zimbabwean: 12 (0.01%)
- Yugoslavian: 12 (0.01%)
Most common places of birth for foreign-born residents (%):
| Corpus Christi: | 53.2% (16,133) |
| Texas: | 48.4% (2,411,723) |
| Corpus Christi: | 7.2% (2,191) |
| Texas: | 2.1% (103,148) |
| Corpus Christi: | 3.9% (1,173) |
| Texas: | 1.5% (72,413) |
| Corpus Christi: | 3.5% (1,076) |
| Texas: | 3.0% (147,182) |
| Corpus Christi: | 3.0% (909) |
| Texas: | 6.1% (306,347) |
| Corpus Christi: | 2.8% (847) |
| Texas: | 1.8% (87,382) |
| Corpus Christi: | 2.2% (679) |
| Texas: | 2.3% (115,558) |
| Corpus Christi: | 1.8% (540) |
| Texas: | 1.3% (62,978) |
| Corpus Christi: | 1.6% (494) |
| Texas: | 3.7% (184,770) |
| Corpus Christi: | 1.5% (469) |
| Texas: | 4.5% (224,455) |
| Corpus Christi: | 1.5% (456) |
| Texas: | 1.1% (55,371) |
Place of birth for U.S.-born residents:
- This state: 235,112
- Other state: 50,855
- Northeast: 6,823
- Midwest: 12,758
- South: 16,302
- West: 14,972
86.1% of Corpus Christi residents lived in the same house 1 years ago.
Out of people who lived in different houses, 43.0% lived in this county.
Out of people who lived in different counties, 64.0% lived in Texas.
| Corpus Christi: | 86.1% |
| State average: | 85.7% |
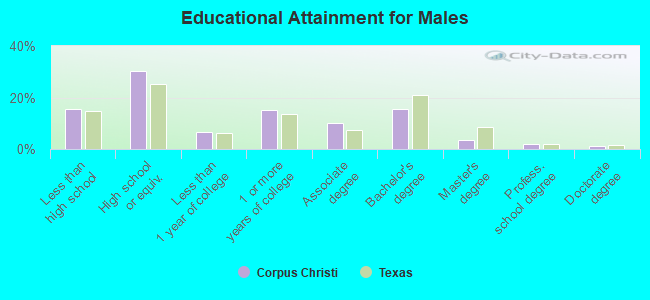
Education attainment for males 25 years and older:
- No schooling: 4,191
- Nursery to 4th grade: 1,382
- 5th and 6th grade: 574
- 7th and 8th grade: 1,335
- 9th grade: 1,693
- 10th grade: 2,248
- 11th grade: 2,737
- 12th grade, no diploma: 2,091
- High school graduate (or equivalency): 31,218
- Less than 1 year of college: 6,763
- Some college more than 1 year, no degree: 15,631
- Associate degree: 10,423
- Bachelor's degree: 16,055
- Master's degree: 3,789
- Professional school degree: 1,849
- Doctorate degree: 1,366
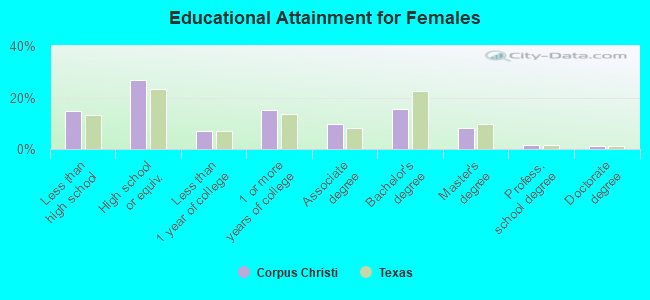
Education attainment for females 25 years and older:
- No schooling: 2,941
- Nursery to 4th grade: 491
- 5th and 6th grade: 1,326
- 7th and 8th grade: 1,728
- 9th grade: 2,940
- 10th grade: 2,284
- 11th grade: 1,882
- 12th grade, no diploma: 2,131
- High school graduate (or equivalency): 28,390
- Less than 1 year of college: 7,620
- Some college more than 1 year, no degree: 16,180
- Associate degree: 10,201
- Bachelor's degree: 16,492
- Master's degree: 8,517
- Professional school degree: 1,668
- Doctorate degree: 1,335
Housing units in structures:
- One, detached: 86,797
- One, attached: 2,280
- Two: 3,661
- 3 or 4: 8,717
- 5 to 9: 11,824
- 10 to 19: 8,995
- 20 to 49: 3,785
- 50 or more: 5,907
- Mobile homes: 4,950
- Boats, RVs, vans, etc.: 226
Median worth of mobile homes: $63,900
Housing units lacking complete kitchen facilities in 2022: 2.5%
House/condo owner moved in on average 11 years ago
Renter moved in on average 2 years ago
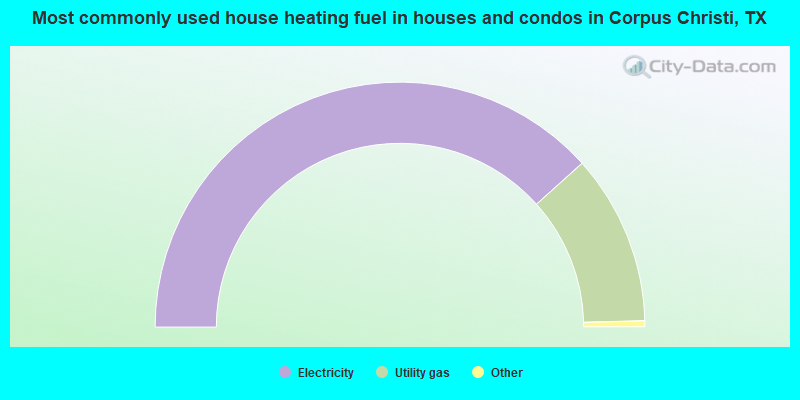
- 76.7%Electricity
- 22.5%Utility gas
- 0.4%Bottled, tank, or LP gas
- 0.3%No fuel used
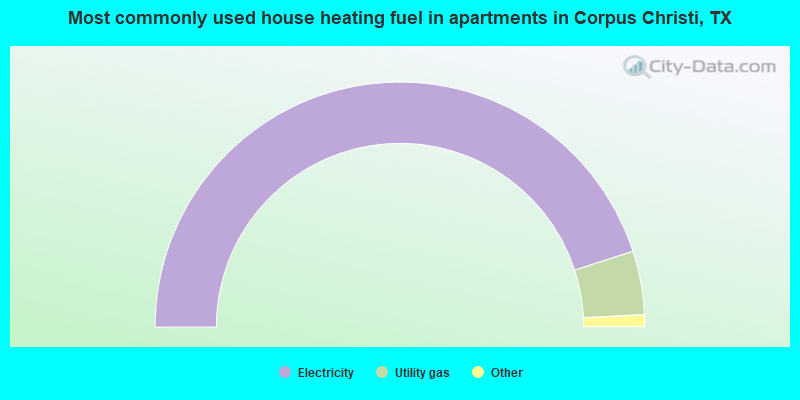
- 90.0%Electricity
- 8.4%Utility gas
- 0.8%Bottled, tank, or LP gas
- 0.6%No fuel used
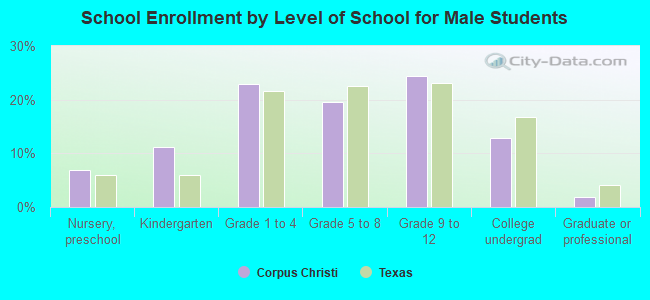
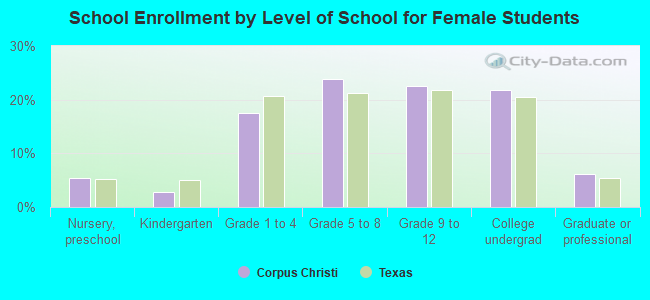
Private vs. public school enrollment:
| Here: | 10.5% |
| Texas: | 8.8% |
| Here: | 3.2% |
| Texas: | 8.0% |
| Here: | 11.7% |
| Texas: | 16.2% |