Work and Jobs in Corpus Christi, Texas (TX) Detailed Stats
Occupations, Industries, Unemployment, Workers, Commute
Settings
X


Recent posts about work in Corpus Christi, Texas on our local forum with over 2,400,000 registered users:
 | Oil jobs in Corpus Christi (2 replies) |
| Moving from Vegas to Corpus Christi (1 reply) |
| Are teaching jobs hard to come by in Corpus Christi? (2 replies) |
| Questions About Houston and It's Nearby Areas (87 replies) |
| Is Texas A&M law school a good law school and does it get cold in Corpus Christi? (16 replies) |
| Texas Unemployment Rates (12 replies) |
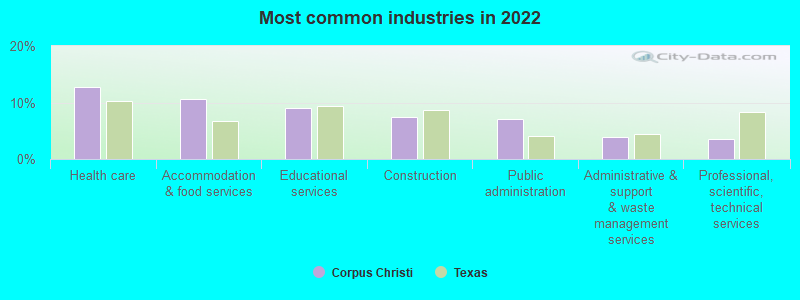
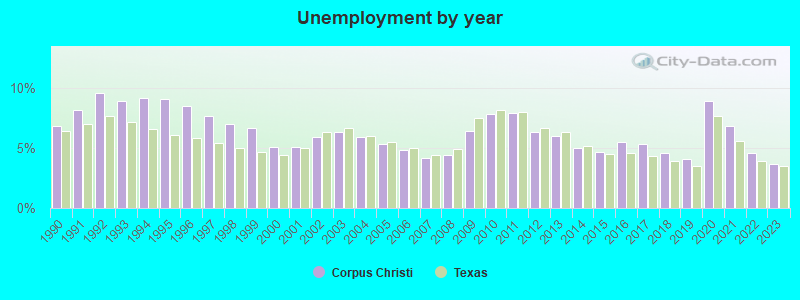
The unemployment rate in 2023 in Corpus Christi, TX was 3.7%, which was 5.4% greater than the unemployment rate of 3.5% across the entire state of Texas. Compared to the unemployment rate of 6.0% in 2013, this represents a decrease of 62.2%. According to 2022 data, the most common industries in Corpus Christi are: Health care (12.7% of civilian employees), Accommodation & food services (10.7% of civilian employees), Educational services (9.1% of civilian employees). 92.8% of workers work in Nueces County and 4.7% of all workers work at home. 67.8% of workers are employees of private companies, which is 2.6% less than the rate of 69.6% across the entire state of Texas.
Whole page based on the data from 2000 / 2022 when the population of Corpus Christi, Texas was 277,454 / 316,228
Whole page based on the data from 2000 / 2022 when the population of Corpus Christi, Texas was 277,454 / 316,228
Most common industries


Most common industries | Most common industries | |||||
|---|---|---|---|---|---|---|
Industry | All | Males | Females | All | Males | Females |
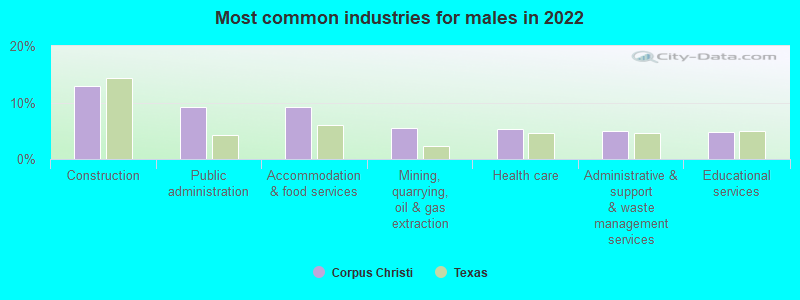
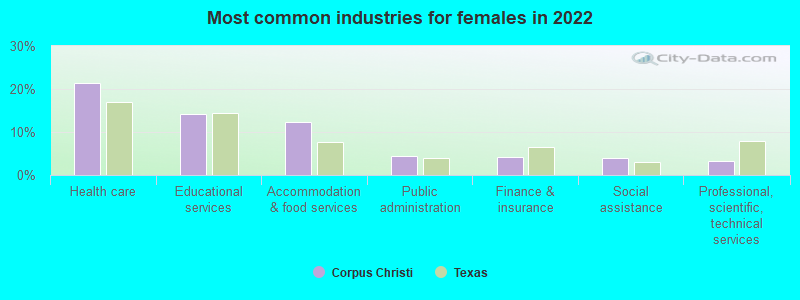
| Health care | 12.7% (21,694) | 5.4% (4,983) | 21.3% (16,711) | 11.1% (13,165) | 5.3% (3,349) | 17.9% (9,816) |
| Accommodation and food services | 10.7% (18,284) | 9.2% (8,530) | 12.4% (9,754) | 8.4% (9,951) | 7.3% (4,625) | 9.7% (5,326) |
| Educational services | 9.1% (15,593) | 4.7% (4,381) | 14.3% (11,212) | 10.3% (12,169) | 5.5% (3,486) | 15.8% (8,683) |
| Construction | 7.5% (12,871) | 12.9% (11,957) | 1.2% (914) | 8.0% (9,515) | 13.7% (8,673) | 1.5% (842) |
| Public administration | 7.0% (12,071) | 9.2% (8,564) | 4.5% (3,507) | 6.6% (7,789) | 7.7% (4,880) | 5.3% (2,909) |
| Administrative and support and waste management services | 3.9% (6,698) | 4.9% (4,565) | 2.7% (2,133) | 4.6% (5,408) | 4.5% (2,829) | 4.7% (2,579) |
| Professional, scientific, and technical services | 3.5% (5,919) | 3.5% (3,276) | 3.4% (2,643) | 4.5% (5,375) | 4.7% (2,997) | 4.3% (2,378) |
| Mining, quarrying, and oil and gas extraction | 3.3% (5,669) | 5.5% (5,068) | 0.8% (601) | 1.2% (1,459) | 2.0% (1,273) | 0.3% (186) |
| Finance and insurance | 3.0% (5,081) | 2.0% (1,860) | 4.1% (3,221) | 3.6% (4,293) | 2.2% (1,388) | 5.3% (2,905) |
| Food and beverage stores | 2.5% (4,305) | 2.2% (2,078) | 2.8% (2,227) | 2.5% (3,003) | 2.5% (1,591) | 2.6% (1,412) |
| Real estate and rental and leasing | 2.4% (4,080) | 2.5% (2,317) | 2.2% (1,763) | 2.5% (2,982) | 2.5% (1,556) | 2.6% (1,426) |
| Social assistance | 2.1% (3,667) | 0.5% (488) | 4.0% (3,179) | 1.8% (2,140) | 0.5% (315) | 3.3% (1,825) |
| Repair and maintenance | 2.1% (3,596) | 3.4% (3,123) | 0.6% (473) | 2.2% (2,549) | 3.5% (2,224) | 0.6% (325) |
| Petroleum and coal products | 2.0% (3,432) | 3.1% (2,852) | 0.7% (580) | 2.2% (2,593) | 3.6% (2,306) | 0.5% (287) |
| Department and other general merchandise stores | 2.0% (3,378) | 1.5% (1,369) | 2.6% (2,009) | 2.2% (2,580) | 1.1% (718) | 3.4% (1,862) |
| Other transportation, and support activities, and couriers | 1.8% (3,162) | 2.4% (2,268) | 1.1% (894) | 1.7% (2,015) | 2.4% (1,534) | 0.9% (481) |
| Personal and laundry services | 1.7% (2,977) | 0.9% (849) | 2.7% (2,128) | 1.3% (1,597) | 0.7% (468) | 2.1% (1,129) |
| Truck transportation | 1.5% (2,515) | 2.3% (2,147) | 0.5% (368) | 0.9% (1,090) | 1.6% (1,023) | 0.1% (67) |
| Arts, entertainment, and recreation | 1.2% (2,097) | 1.2% (1,077) | 1.3% (1,020) | 1.4% (1,708) | 1.6% (1,035) | 1.2% (673) |
| Motor vehicle and parts dealers | 1.2% (2,051) | 1.5% (1,362) | 0.9% (689) | 1.6% (1,903) | 2.4% (1,510) | 0.7% (393) |
| Religious, grantmaking, civic, professional, and similar organizations | 1.2% (1,993) | 0.8% (733) | 1.6% (1,260) | 1.2% (1,367) | 0.8% (519) | 1.5% (848) |
| Building material and garden equipment and supplies dealers | 1.1% (1,856) | 1.3% (1,187) | 0.9% (669) | 0.7% (878) | 1.0% (659) | 0.4% (219) |
| Broadcasting and telecommunications | 1.1% (1,845) | 1.3% (1,185) | 0.8% (660) | 1.6% (1,882) | 1.8% (1,152) | 1.3% (730) |
| Used merchandise, gift, novelty, and souvenir, and other miscellaneous stores | 1.0% (1,781) | 0.7% (651) | 1.4% (1,130) | 0.8% (899) | 0.6% (367) | 1.0% (532) |
| Utilities | 0.8% (1,397) | 1.2% (1,119) | 0.4% (278) | 0.9% (1,102) | 1.4% (888) | 0.4% (214) |
| Metal and metal products | 0.8% (1,304) | 1.3% (1,228) | 0.1% (76) | 1.0% (1,216) | 1.7% (1,092) | 0.2% (124) |
| Furniture and home furnishings, and household appliance stores | 0.7% (1,178) | 0.9% (796) | 0.5% (382) | 0.6% (689) | 0.8% (478) | 0.4% (211) |
| Clothing and accessories, including shoe, stores | 0.7% (1,137) | 0.4% (351) | 1.0% (786) | 0.7% (829) | 0.4% (259) | 1.0% (570) |
| Food | 0.6% (1,052) | 0.5% (451) | 0.8% (601) | 0.7% (802) | 0.9% (593) | 0.4% (209) |
| Machinery, equipment, and supplies merchant wholesalers | 0.6% (1,011) | 0.7% (663) | 0.4% (348) | 0.5% (641) | 0.8% (512) | 0.2% (129) |
| Publishing, and motion picture and sound recording industries | 0.6% (988) | 0.7% (688) | 0.4% (300) | 0.7% (791) | 0.6% (369) | 0.8% (422) |
| Transportation equipment | 0.6% (982) | 0.9% (850) | 0.2% (132) | 0.4% (437) | 0.6% (381) | 0.1% (56) |
| Private households | 0.6% (958) | 0.1% (105) | 1.1% (853) | 0.6% (766) | 0.0% (23) | 1.4% (743) |
| Other direct selling establishments | 0.5% (839) | 0.3% (282) | 0.7% (557) | 0.6% (762) | 0.4% (274) | 0.9% (488) |
| Machinery | 0.5% (800) | 0.8% (753) | 0.1% (47) | 0.3% (329) | 0.4% (283) | 0.1% (46) |
| Groceries and related products merchant wholesalers | 0.4% (762) | 0.7% (628) | 0.2% (134) | 0.6% (652) | 0.9% (553) | 0.2% (99) |
| U. S. Postal service | 0.4% (728) | 0.7% (636) | 0.1% (92) | 0.6% (682) | 0.8% (518) | 0.3% (164) |
| Printing and related support activities | 0.4% (634) | 0.4% (377) | 0.3% (257) | 0.3% (333) | 0.3% (166) | 0.3% (167) |
| Miscellaneous manufacturing | 0.4% (612) | 0.5% (490) | 0.2% (122) | 0.3% (404) | 0.4% (241) | 0.3% (163) |
| Radio, TV, and computer stores | 0.4% (611) | 0.3% (317) | 0.4% (294) | 0.4% (482) | 0.5% (342) | 0.3% (140) |
| Computer and electronic products | 0.3% (589) | 0.4% (348) | 0.3% (241) | 0.3% (341) | 0.3% (163) | 0.3% (178) |
| Chemicals | 0.3% (586) | 0.5% (502) | 0.1% (84) | 1.2% (1,392) | 1.8% (1,135) | 0.5% (257) |
| Alcoholic beverages merchant wholesalers | 0.3% (576) | 0.6% (576) | 0.0% (0) | 0.1% (143) | 0.2% (131) | 0.0% (12) |
| Health and personal care, except drug, stores | 0.3% (538) | 0.1% (104) | 0.6% (434) | 0.2% (206) | 0.0% (28) | 0.3% (178) |
| Sporting goods, camera, and hobby and toy stores | 0.3% (532) | 0.3% (287) | 0.3% (245) | 0.4% (516) | 0.4% (281) | 0.4% (235) |
| Pharmacies and drug stores | 0.3% (512) | 0.3% (278) | 0.3% (234) | 0.3% (410) | 0.3% (177) | 0.4% (233) |
| Petroleum and petroleum products merchant wholesalers | 0.3% (450) | 0.4% (401) | 0.1% (49) | 0.3% (326) | 0.3% (206) | 0.2% (120) |
| Gasoline stations | 0.3% (436) | 0.2% (207) | 0.3% (229) | 0.2% (189) | 0.2% (146) | 0.1% (43) |
| Agriculture, forestry, fishing and hunting | 0.2% (401) | 0.4% (377) | 0.0% (24) | 0.5% (549) | 0.7% (475) | 0.1% (74) |
| Warehousing and storage | 0.2% (353) | 0.3% (255) | 0.1% (98) | 0.1% (151) | 0.2% (107) | 0.1% (44) |
| Book stores and news dealers | 0.2% (306) | 0.0% (16) | 0.4% (290) | 0.1% (163) | 0.1% (49) | 0.2% (114) |
| Air transportation | 0.1% (250) | 0.1% (130) | 0.2% (120) | 0.3% (323) | 0.3% (170) | 0.3% (153) |
| Jewelry, luggage, and leather goods stores | 0.1% (249) | 0.1% (92) | 0.2% (157) | 0.2% (259) | 0.1% (92) | 0.3% (167) |
| Textile mills and textile products | 0.1% (220) | 0.2% (203) | 0.0% (17) | 0.0% (44) | 0.1% (38) | 0.0% (6) |
| Management of companies and enterprises | 0.1% (217) | 0.1% (94) | 0.2% (123) | 0.0% (45) | 0.0% (20) | 0.0% (25) |
| Office supplies and stationery stores | 0.1% (215) | 0.1% (124) | 0.1% (91) | 0.1% (161) | 0.1% (87) | 0.1% (74) |
| Data processing, libraries, and other information services | 0.1% (207) | 0.0% (0) | 0.3% (207) | 0.2% (268) | 0.2% (97) | 0.3% (171) |
| Fuel dealers | 0.1% (203) | 0.2% (203) | 0.0% (0) | 0.0% (4) | 0.0% (4) | 0.0% (0) |
| Professional and commercial equipment and supplies merchant wholesalers | 0.1% (185) | 0.1% (109) | 0.1% (76) | 0.2% (200) | 0.2% (125) | 0.1% (75) |
| Electronic shopping and mail-order houses | 0.1% (182) | 0.1% (48) | 0.2% (134) | 0.1% (79) | 0.0% (30) | 0.1% (49) |
| Drugs, sundries, and chemical and allied products merchant wholesalers | 0.1% (164) | 0.1% (52) | 0.1% (112) | 0.2% (202) | 0.2% (136) | 0.1% (66) |
| Nonmetallic mineral products | 0.1% (142) | 0.2% (142) | 0.0% (0) | 0.1% (133) | 0.2% (111) | 0.0% (22) |
| Miscellaneous nondurable goods merchant wholesalers | 0.1% (139) | 0.1% (71) | 0.1% (68) | 0.4% (430) | 0.4% (226) | 0.4% (204) |
| Sewing, needlework, and piece goods stores | 0.1% (137) | 0.1% (101) | 0.0% (36) | 0.1% (91) | 0.0% (23) | 0.1% (68) |
| Motor vehicles, parts and supplies merchant wholesalers | 0.1% (136) | 0.1% (115) | 0.0% (21) | 0.1% (155) | 0.2% (135) | 0.0% (20) |
| Farm product raw materials merchant wholesalers | 0.1% (132) | 0.1% (132) | 0.0% (0) | 0.1% (129) | 0.2% (97) | 0.1% (32) |
| Hardware, plumbing and heating equipment, and supplies merchant wholesalers | 0.1% (132) | 0.1% (61) | 0.1% (71) | 0.2% (206) | 0.3% (159) | 0.1% (47) |
| Wood products | 0.1% (111) | 0.1% (94) | 0.0% (17) | 0.1% (136) | 0.2% (110) | 0.0% (26) |
| Electrical and electronic goods merchant wholesalers | 0.1% (102) | 0.1% (78) | 0.0% (24) | 0.3% (330) | 0.4% (240) | 0.2% (90) |
| Rail transportation | 0.1% (95) | 0.1% (95) | 0.0% (0) | 0.1% (62) | 0.1% (62) | 0.0% (0) |
| Recyclable material merchant wholesalers | 0.1% (95) | 0.1% (67) | 0.0% (28) | 0.1% (118) | 0.2% (109) | 0.0% (9) |
| Beverage and tobacco products | 0.1% (89) | 0.1% (72) | 0.0% (17) | 0.1% (173) | 0.2% (157) | 0.0% (16) |
| Music stores | 0.0% (77) | 0.1% (77) | 0.0% (0) | 0.1% (143) | 0.1% (95) | 0.1% (48) |
| Furniture and related product manufacturing | 0.0% (72) | 0.1% (54) | 0.0% (18) | 0.1% (130) | 0.2% (106) | 0.0% (24) |
| Metals and minerals, except petroleum, merchant wholesalers | 0.0% (59) | 0.1% (54) | 0.0% (5) | 0.1% (124) | 0.2% (107) | 0.0% (17) |
| Lumber and other construction materials merchant wholesalers | 0.0% (35) | 0.0% (35) | 0.0% (0) | 0.1% (99) | 0.1% (91) | 0.0% (8) |
| Miscellaneous durable goods merchant wholesalers | 0.0% (0) | 0.0% (0) | 0.0% (0) | 0.1% (113) | 0.2% (98) | 0.0% (15) |
Unemployment in Corpus Christi
- Unemployment by race in 2022
- Unemployment rate for White non-Hispanic residents
- 4.8%Males
- 6.1%Females
- Unemployment rate for Black residents
- 5.3%Males
- 19.8%Females
- Unemployment rate for American Indian and Alaska Native residents
- 21.6%Males
- 5.5%Females
- Unemployment rate for Asian residents
- 2.3%Males
- 2.8%Females
- Unemployment rate for other race residents
- 1.7%Males
- 3.5%Females
- Unemployment rate for two or more race residents
- 4.9%Males
- 3.6%Females
- Unemployment rate for Hispanic or Latino residents
- 4.4%Males
- 4.4%Females
- Unemployment by race in 2000
- Unemployment rate for White non-Hispanic residents
- 4.2%Males
- 5.5%Females
- Unemployment rate for Black residents
- 13.0%Males
- 13.7%Females
- Unemployment rate for American Indian and Alaska Native residents
- 15.7%Males
- 16.6%Females
- Unemployment rate for Asian residents
- 3.1%Males
- 6.9%Females
- Unemployment rate for other race residents
- 10.3%Males
- 9.6%Females
- Unemployment rate for two or more race residents
- 12.1%Males
- 10.1%Females
- Unemployment rate for Hispanic or Latino residents
- 9.4%Males
- 8.6%Females
Unemployment in 2023:
| Corpus Christi: | 3.7% |
| Texas: | 3.5% |
Unemployment in 2022:
| Corpus Christi: | 4.6% |
| Texas: | 3.9% |
Unemployment in 2021:
| Corpus Christi: | 6.8% |
| Texas: | 5.6% |
Unemployment in 2020:
| Corpus Christi: | 8.9% |
| Texas: | 7.7% |
Unemployment in 2019:
| Corpus Christi: | 4.1% |
| Texas: | 3.5% |
Unemployment in 2018:
| Corpus Christi: | 4.6% |
| Texas: | 3.9% |
Unemployment in 2017:
| Corpus Christi: | 5.3% |
| Texas: | 4.3% |
Unemployment in 2016:
| Corpus Christi: | 5.5% |
| Texas: | 4.6% |
Unemployment in 2015:
| Corpus Christi: | 4.7% |
| Texas: | 4.5% |
Unemployment in 2014:
| Corpus Christi: | 5.0% |
| Texas: | 5.2% |
Unemployment in 2013:
| Corpus Christi: | 6.0% |
| Texas: | 6.3% |
Unemployment in 2012:
| Corpus Christi: | 6.3% |
| Texas: | 6.7% |
Unemployment in 2011:
| Corpus Christi: | 7.9% |
| Texas: | 8.0% |
Unemployment in 2010:
| Corpus Christi: | 7.8% |
| Texas: | 8.2% |
Unemployment in 2009:
| Corpus Christi: | 6.4% |
| Texas: | 7.5% |
Unemployment in 2008:
| Corpus Christi: | 4.4% |
| Texas: | 4.9% |
Unemployment in 2007:
| Corpus Christi: | 4.2% |
| Texas: | 4.4% |
Unemployment in 2006:
| Corpus Christi: | 4.8% |
| Texas: | 5.0% |
Unemployment in 2005:
| Corpus Christi: | 5.3% |
| Texas: | 5.5% |
Unemployment in 2004:
| Corpus Christi: | 5.9% |
| Texas: | 6.0% |
Unemployment in 2003:
| Corpus Christi: | 6.3% |
| Texas: | 6.7% |
Unemployment in 2002:
| Corpus Christi: | 5.9% |
| Texas: | 6.3% |
Unemployment in 2001:
| Corpus Christi: | 5.1% |
| Texas: | 5.0% |
Unemployment in 2000:
| Corpus Christi: | 5.1% |
| Texas: | 4.4% |
Unemployment in 1999:
| Corpus Christi: | 6.7% |
| Texas: | 4.7% |
Unemployment in 1998:
| Corpus Christi: | 7.0% |
| Texas: | 5.0% |
Unemployment in 1997:
| Corpus Christi: | 7.7% |
| Texas: | 5.4% |
Unemployment in 1996:
| Corpus Christi: | 8.5% |
| Texas: | 5.8% |
Unemployment in 1995:
| Corpus Christi: | 9.1% |
| Texas: | 6.1% |
Unemployment in 1994:
| Corpus Christi: | 9.2% |
| Texas: | 6.6% |
Unemployment in 1993:
| Corpus Christi: | 8.9% |
| Texas: | 7.2% |
Unemployment in 1992:
| Corpus Christi: | 9.6% |
| Texas: | 7.7% |
Unemployment in 1991:
| Corpus Christi: | 8.2% |
| Texas: | 7.0% |
Unemployment in 1990:
| Corpus Christi: | 6.8% |
| Texas: | 6.4% |
Time leaving home to go to work
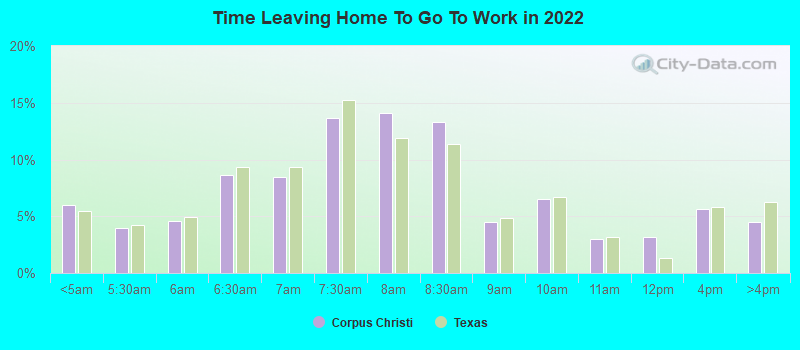
12:00 a.m. to 4:59 a.m.:
| Corpus Christi: | 6.0% (8,685) |
| Texas: | 5.5% (678,264) |
5:00 a.m. to 5:29 a.m.:
| Corpus Christi: | 3.9% (5,691) |
| Texas: | 4.3% (525,841) |
5:30 a.m. to 5:59 a.m.:
| Corpus Christi: | 4.6% (6,674) |
| Texas: | 4.9% (603,953) |
6:00 a.m. to 6:29 a.m.:
| Corpus Christi: | 8.6% (12,453) |
| Texas: | 9.4% (1,155,020) |
6:30 a.m. to 6:59 a.m.:
| Corpus Christi: | 8.4% (12,166) |
| Texas: | 9.3% (1,152,822) |
7:00 a.m. to 7:29 a.m.:
| Corpus Christi: | 13.7% (19,804) |
| Texas: | 15.3% (1,885,477) |
7:30 a.m. to 7:59 a.m.:
| Corpus Christi: | 14.1% (20,379) |
| Texas: | 11.9% (1,469,628) |
8:00 a.m. to 8:29 a.m.:
| Corpus Christi: | 13.3% (19,219) |
| Texas: | 11.3% (1,400,175) |
8:30 a.m. to 8:59 a.m.:
| Corpus Christi: | 4.5% (6,525) |
| Texas: | 4.9% (599,574) |
9:00 a.m. to 9:59 a.m.:
| Corpus Christi: | 6.6% (9,475) |
| Texas: | 6.7% (829,367) |
10:00 a.m. to 10:59 a.m.:
| Corpus Christi: | 3.0% (4,364) |
| Texas: | 3.2% (390,354) |
11:00 a.m. to 11:59 a.m.:
| Corpus Christi: | 3.1% (4,538) |
| Texas: | 1.3% (162,330) |
12:00 p.m. to 3:59 p.m.:
| Corpus Christi: | 5.6% (8,109) |
| Texas: | 5.8% (720,594) |
4:00 p.m. to 11:59 p.m.:
| Corpus Christi: | 4.5% (6,501) |
| Texas: | 6.3% (777,072) |

<5am:
| Corpus Christi: | 2.7% (3,263) |
| Texas: | 3.1% (281,361) |
5:30am:
| Corpus Christi: | 2.0% (2,409) |
| Texas: | 2.9% (262,060) |
6am:
| Corpus Christi: | 3.6% (4,329) |
| Texas: | 4.4% (403,423) |
6:30am:
| Corpus Christi: | 7.1% (8,473) |
| Texas: | 8.8% (808,876) |
7am:
| Corpus Christi: | 8.9% (10,630) |
| Texas: | 10.7% (976,557) |
7:30am:
| Corpus Christi: | 16.3% (19,319) |
| Texas: | 16.4% (1,500,904) |
8am:
| Corpus Christi: | 20.0% (23,823) |
| Texas: | 16.8% (1,536,308) |
8:30am:
| Corpus Christi: | 10.3% (12,227) |
| Texas: | 10.0% (913,601) |
9am:
| Corpus Christi: | 4.7% (5,618) |
| Texas: | 4.4% (398,656) |
10am:
| Corpus Christi: | 5.7% (6,800) |
| Texas: | 5.2% (472,592) |
11am:
| Corpus Christi: | 2.5% (2,946) |
| Texas: | 2.2% (197,844) |
12pm:
| Corpus Christi: | 1.2% (1,452) |
| Texas: | 0.9% (86,997) |
4pm:
| Corpus Christi: | 5.4% (6,360) |
| Texas: | 5.5% (503,565) |
>4pm:
| Corpus Christi: | 7.3% (8,624) |
| Texas: | 6.1% (563,107) |

12:00 a.m. to 4:59 a.m. - Males:
| Corpus Christi: | 7.8% (6,136) |
| Texas: | 7.0% (477,284) |
5:00 a.m. to 5:29 a.m. - Males:
| Corpus Christi: | 5.7% (4,507) |
| Texas: | 5.8% (394,876) |
5:30 a.m. to 5:59 a.m. - Males:
| Corpus Christi: | 6.1% (4,823) |
| Texas: | 5.9% (402,788) |
6:00 a.m. to 6:29 a.m. - Males:
| Corpus Christi: | 10.7% (8,394) |
| Texas: | 10.9% (751,118) |
6:30 a.m. to 6:59 a.m. - Males:
| Corpus Christi: | 9.6% (7,547) |
| Texas: | 9.5% (652,306) |
7:00 a.m. to 7:29 a.m. - Males:
| Corpus Christi: | 15.8% (12,394) |
| Texas: | 14.1% (970,598) |
7:30 a.m. to 7:59 a.m. - Males:
| Corpus Christi: | 8.4% (6,636) |
| Texas: | 10.2% (696,429) |
8:00 a.m. to 8:29 a.m. - Males:
| Corpus Christi: | 10.4% (8,201) |
| Texas: | 10.6% (729,041) |
8:30 a.m. to 8:59 a.m. - Males:
| Corpus Christi: | 3.2% (2,487) |
| Texas: | 4.1% (281,762) |
9:00 a.m. to 9:59 a.m. - Males:
| Corpus Christi: | 5.4% (4,271) |
| Texas: | 5.8% (401,071) |
10:00 a.m. to 10:59 a.m. - Males:
| Corpus Christi: | 2.2% (1,723) |
| Texas: | 2.7% (186,469) |
11:00 a.m. to 11:59 a.m. - Males:
| Corpus Christi: | 3.0% (2,383) |
| Texas: | 1.2% (82,242) |
12:00 p.m. to 3:59 p.m. - Males:
| Corpus Christi: | 6.4% (5,039) |
| Texas: | 5.8% (397,795) |
4:00 p.m. to 11:59 p.m. - Males:
| Corpus Christi: | 5.2% (4,049) |
| Texas: | 6.4% (435,950) |

12:00 a.m. to 4:59 a.m. - Females:
| Corpus Christi: | 3.9% (2,549) |
| Texas: | 3.7% (200,980) |
5:00 a.m. to 5:29 a.m. - Females:
| Corpus Christi: | 1.8% (1,184) |
| Texas: | 2.4% (130,965) |
5:30 a.m. to 5:59 a.m. - Females:
| Corpus Christi: | 2.8% (1,851) |
| Texas: | 3.7% (201,165) |
6:00 a.m. to 6:29 a.m. - Females:
| Corpus Christi: | 6.2% (4,059) |
| Texas: | 7.4% (403,902) |
6:30 a.m. to 6:59 a.m. - Females:
| Corpus Christi: | 7.0% (4,619) |
| Texas: | 9.1% (500,516) |
7:00 a.m. to 7:29 a.m. - Females:
| Corpus Christi: | 11.2% (7,410) |
| Texas: | 16.7% (914,879) |
7:30 a.m. to 7:59 a.m. - Females:
| Corpus Christi: | 20.8% (13,743) |
| Texas: | 14.1% (773,199) |
8:00 a.m. to 8:29 a.m. - Females:
| Corpus Christi: | 16.7% (11,018) |
| Texas: | 12.2% (671,134) |
8:30 a.m. to 8:59 a.m. - Females:
| Corpus Christi: | 6.1% (4,038) |
| Texas: | 5.8% (317,812) |
9:00 a.m. to 9:59 a.m. - Females:
| Corpus Christi: | 7.9% (5,204) |
| Texas: | 7.8% (428,296) |
10:00 a.m. to 10:59 a.m. - Females:
| Corpus Christi: | 4.0% (2,641) |
| Texas: | 3.7% (203,885) |
11:00 a.m. to 11:59 a.m. - Females:
| Corpus Christi: | 3.3% (2,155) |
| Texas: | 1.5% (80,088) |
12:00 p.m. to 3:59 p.m. - Females:
| Corpus Christi: | 4.7% (3,070) |
| Texas: | 5.9% (322,799) |
4:00 p.m. to 11:59 p.m. - Females:
| Corpus Christi: | 3.7% (2,452) |
| Texas: | 6.2% (341,122) |
Travel time to work
Percentage of workers working in this county: 92.8%
Number of people working at home: 7,204 (4.7% of all workers)
Daytime population change due to commuting: +7,779 (+2.8%)
Workers who live and work in this city: 105,965 (89.1%)
Number of people working at home: 7,204 (4.7% of all workers)
Daytime population change due to commuting: +7,779 (+2.8%)
Workers who live and work in this city: 105,965 (89.1%)

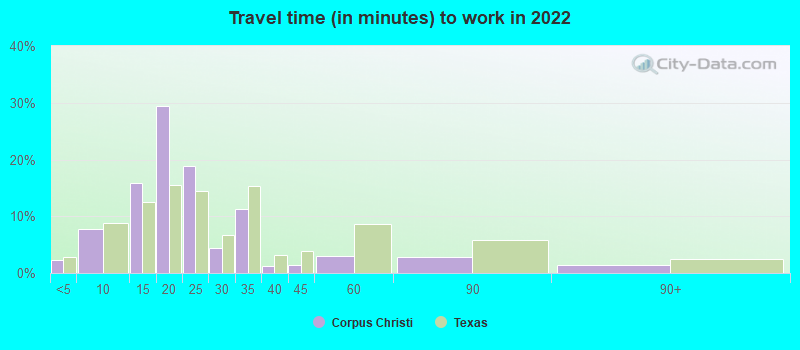

Less than 5 minutes:
| Corpus Christi: | 2.4% (3,481) |
| Texas: | 2.8% (350,462) |
5 to 9 minutes:
| Corpus Christi: | 7.7% (11,386) |
| Texas: | 8.8% (1,087,762) |
10 to 14 minutes:
| Corpus Christi: | 15.8% (23,338) |
| Texas: | 12.6% (1,550,271) |
15 to 19 minutes:
| Corpus Christi: | 29.5% (43,419) |
| Texas: | 15.6% (1,918,353) |
20 to 24 minutes:
| Corpus Christi: | 18.9% (27,894) |
| Texas: | 14.4% (1,772,079) |
25 to 29 minutes:
| Corpus Christi: | 4.4% (6,507) |
| Texas: | 6.7% (827,833) |
30 to 34 minutes:
| Corpus Christi: | 11.2% (16,483) |
| Texas: | 15.3% (1,887,878) |
35 to 39 minutes:
| Corpus Christi: | 1.2% (1,780) |
| Texas: | 3.2% (394,170) |
40 to 44 minutes:
| Corpus Christi: | 1.5% (2,165) |
| Texas: | 3.9% (476,118) |
45 to 59 minutes:
| Corpus Christi: | 3.1% (4,495) |
| Texas: | 8.6% (1,058,376) |
60 to 89 minutes:
| Corpus Christi: | 2.9% (4,203) |
| Texas: | 5.7% (706,002) |
90 or more minutes:
| Corpus Christi: | 1.4% (2,105) |
| Texas: | 2.4% (299,884) |


Less than 5 minutes:
| Corpus Christi: | 2.5% (2,914) |
| Texas: | 3.0% (277,642) |
5 to 9 minutes:
| Corpus Christi: | 12.0% (14,239) |
| Texas: | 10.3% (942,891) |
10 to 14 minutes:
| Corpus Christi: | 20.5% (24,412) |
| Texas: | 14.4% (1,317,555) |
15 to 19 minutes:
| Corpus Christi: | 24.0% (28,486) |
| Texas: | 16.0% (1,467,945) |
20 to 24 minutes:
| Corpus Christi: | 17.7% (21,091) |
| Texas: | 13.9% (1,276,781) |
25 to 29 minutes:
| Corpus Christi: | 4.3% (5,053) |
| Texas: | 5.3% (482,838) |
30 to 34 minutes:
| Corpus Christi: | 8.7% (10,336) |
| Texas: | 14.3% (1,309,699) |
35 to 39 minutes:
| Corpus Christi: | 1.1% (1,289) |
| Texas: | 2.4% (219,873) |
40 to 44 minutes:
| Corpus Christi: | 1.1% (1,315) |
| Texas: | 3.1% (280,916) |
45 to 59 minutes:
| Corpus Christi: | 2.7% (3,157) |
| Texas: | 7.6% (692,006) |
60 to 89 minutes:
| Corpus Christi: | 1.6% (1,861) |
| Texas: | 4.6% (418,905) |
90 or more minutes:
| Corpus Christi: | 1.8% (2,120) |
| Texas: | 2.4% (218,800) |

Less than 5 minutes - Males:
| Corpus Christi: | 1.7% (1,374) |
| Texas: | 2.7% (181,937) |
5 to 9 minutes - Males:
| Corpus Christi: | 6.0% (4,846) |
| Texas: | 7.6% (522,166) |
10 to 14 minutes - Males:
| Corpus Christi: | 12.7% (10,317) |
| Texas: | 11.5% (785,572) |
15 to 19 minutes - Males:
| Corpus Christi: | 32.4% (26,347) |
| Texas: | 14.6% (1,001,179) |
20 to 24 minutes - Males:
| Corpus Christi: | 18.1% (14,767) |
| Texas: | 13.9% (950,043) |
25 to 29 minutes - Males:
| Corpus Christi: | 4.1% (3,324) |
| Texas: | 6.7% (457,259) |
30 to 34 minutes - Males:
| Corpus Christi: | 13.0% (10,609) |
| Texas: | 16.2% (1,110,357) |
35 to 39 minutes - Males:
| Corpus Christi: | 1.2% (1,015) |
| Texas: | 3.3% (223,512) |
40 to 44 minutes - Males:
| Corpus Christi: | 1.8% (1,479) |
| Texas: | 4.2% (289,434) |
45 to 59 minutes - Males:
| Corpus Christi: | 3.4% (2,737) |
| Texas: | 9.3% (639,122) |
60 to 89 minutes - Males:
| Corpus Christi: | 3.9% (3,164) |
| Texas: | 6.8% (467,154) |
90 or more minutes - Males:
| Corpus Christi: | 1.8% (1,456) |
| Texas: | 3.1% (211,313) |

Less than 5 minutes - Females:
| Corpus Christi: | 3.2% (2,107) |
| Texas: | 3.1% (168,525) |
5 to 9 minutes - Females:
| Corpus Christi: | 9.9% (6,540) |
| Texas: | 10.3% (565,596) |
10 to 14 minutes - Females:
| Corpus Christi: | 19.8% (13,021) |
| Texas: | 13.9% (764,699) |
15 to 19 minutes - Females:
| Corpus Christi: | 25.9% (17,072) |
| Texas: | 16.7% (917,174) |
20 to 24 minutes - Females:
| Corpus Christi: | 19.9% (13,127) |
| Texas: | 15.0% (822,036) |
25 to 29 minutes - Females:
| Corpus Christi: | 4.8% (3,183) |
| Texas: | 6.7% (370,574) |
30 to 34 minutes - Females:
| Corpus Christi: | 8.9% (5,874) |
| Texas: | 14.2% (777,521) |
35 to 39 minutes - Females:
| Corpus Christi: | 1.2% (765) |
| Texas: | 3.1% (170,658) |
40 to 44 minutes - Females:
| Corpus Christi: | 1.0% (686) |
| Texas: | 3.4% (186,684) |
45 to 59 minutes - Females:
| Corpus Christi: | 2.7% (1,758) |
| Texas: | 7.6% (419,254) |
60 to 89 minutes - Females:
| Corpus Christi: | 1.6% (1,039) |
| Texas: | 4.4% (238,848) |
90 or more minutes - Females:
| Corpus Christi: | 1.0% (649) |
| Texas: | 1.6% (88,571) |
Means of transportation to work
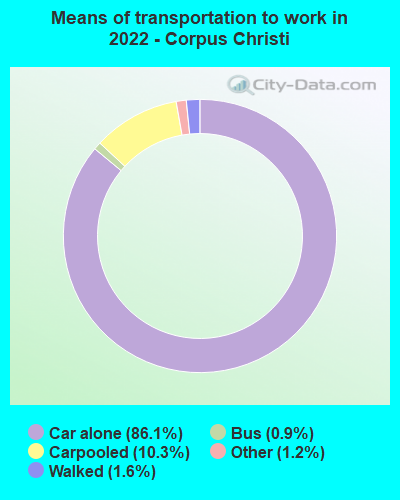

Drove car alone:
| Corpus Christi: | 86.1% (126,816) |
| Texas: | 83.3% (4,557,023) |
Carpooled:
| Corpus Christi: | 10.3% (15,139) |
| Texas: | 11.7% (674,818) |
Bus:
| Corpus Christi: | 0.9% (1,266) |
| Texas: | 0.9% (50,435) |
Walked:
| Corpus Christi: | 1.6% (2,284) |
| Texas: | 1.7% (99,911) |
Other means:
| Corpus Christi: | 1.2% (1,751) |
| Texas: | 2.0% (95,481) |


Drove car alone:
| Corpus Christi: | 76.8% (91,235) |
| Texas: | 77.7% (7,115,590) |
Carpooled:
| Corpus Christi: | 15.7% (18,633) |
| Texas: | 14.5% (1,326,012) |
Bus or trolley bus:
| Corpus Christi: | 1.9% (2,261) |
| Texas: | 1.7% (157,014) |
Streetcar or trolley car:
| Corpus Christi: | 0.0% (53) |
| Texas: | 0.0% (1,669) |
Subway or elevated:
| Corpus Christi: | 0.0% (18) |
| Texas: | 0.0% (2,371) |
Taxicab:
| Corpus Christi: | 0.1% (159) |
| Texas: | 0.1% (6,102) |
Motorcycle:
| Corpus Christi: | 0.2% (229) |
| Texas: | 0.1% (12,068) |
Bicycle:
| Corpus Christi: | 0.2% (290) |
| Texas: | 0.2% (21,551) |
Walked:
| Corpus Christi: | 1.8% (2,156) |
| Texas: | 1.9% (173,670) |
Other means:
| Corpus Christi: | 1.0% (1,239) |
| Texas: | 0.9% (86,692) |


Drove car alone - Males:
| Corpus Christi: | 86.1% (70,080) |
| Texas: | 83.6% (4,557,023) |
Carpooled - Males:
| Corpus Christi: | 10.0% (8,127) |
| Texas: | 11.2% (674,818) |
Bus - Males:
| Corpus Christi: | 1.1% (931) |
| Texas: | 0.8% (50,435) |
Walked - Males:
| Corpus Christi: | 1.4% (1,154) |
| Texas: | 1.7% (99,911) |
Other means - Males:
| Corpus Christi: | 1.4% (1,143) |
| Texas: | 2.2% (95,481) |


Drove car alone - Females:
| Corpus Christi: | 86.2% (56,736) |
| Texas: | 83.0% (4,557,023) |
Carpooled - Females:
| Corpus Christi: | 10.7% (7,012) |
| Texas: | 12.3% (674,818) |
Bus - Females:
| Corpus Christi: | 0.5% (335) |
| Texas: | 0.9% (50,435) |
Walked - Females:
| Corpus Christi: | 1.7% (1,130) |
| Texas: | 1.8% (99,911) |
Other means - Females:
| Corpus Christi: | 0.9% (608) |
| Texas: | 1.7% (95,481) |
Private vehicle occupancy

Drove alone:
| Corpus Christi: | 88.9% (123,624) |
| Texas: | 87.6% (10,283,021) |
In 2 person carpool:
| Corpus Christi: | 8.3% (11,518) |
| Texas: | 9.0% (1,052,595) |
In 3 person carpool:
| Corpus Christi: | 2.2% (3,001) |
| Texas: | 2.1% (244,139) |
In 4 person carpool:
| Corpus Christi: | 0.6% (810) |
| Texas: | 0.8% (92,732) |
In 5-6 person carpool:
| Corpus Christi: | 0.1% (84) |
| Texas: | 0.4% (44,947) |

Drove alone:
| Corpus Christi: | 83.0% (91,235) |
| Texas: | 84.3% (7,115,590) |
In 2 person carpool:
| Corpus Christi: | 13.1% (14,361) |
| Texas: | 11.6% (982,994) |
In 3 person carpool:
| Corpus Christi: | 2.4% (2,626) |
| Texas: | 2.4% (201,602) |
In 4 person carpool:
| Corpus Christi: | 1.0% (1,115) |
| Texas: | 1.0% (83,518) |
In 5-6 person carpool:
| Corpus Christi: | 0.4% (429) |
| Texas: | 0.5% (40,662) |
In 7+ person carpool:
| Corpus Christi: | 0.1% (102) |
| Texas: | 0.2% (17,236) |
Class of workers
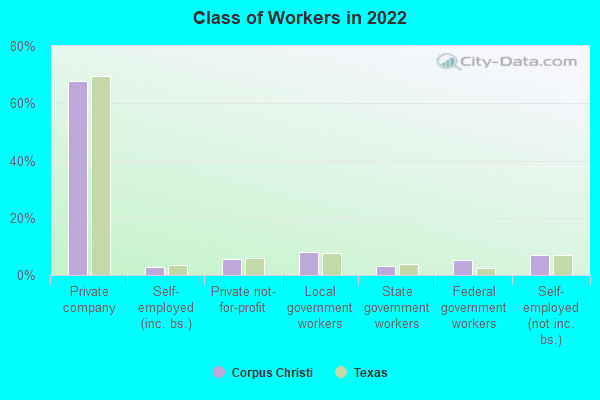
Employee of private company:
| Corpus Christi: | 67.8% (102,194) |
| Texas: | 69.6% (10,139,666) |
Self-employed in own incorporated business:
| Corpus Christi: | 2.9% (4,433) |
| Texas: | 3.5% (516,446) |
Private not-for-profit wage and salary workers:
| Corpus Christi: | 5.5% (8,328) |
| Texas: | 6.0% (870,454) |
Local government workers:
| Corpus Christi: | 8.0% (12,062) |
| Texas: | 7.6% (1,109,799) |
State government workers:
| Corpus Christi: | 3.3% (4,967) |
| Texas: | 3.8% (558,618) |
Federal government workers:
| Corpus Christi: | 5.4% (8,069) |
| Texas: | 2.5% (357,298) |
Self-employed workers in own not incorporated business:
| Corpus Christi: | 7.0% (10,505) |
| Texas: | 6.8% (998,270) |
Unpaid family workers:
| Corpus Christi: | 0.1% (167) |
| Texas: | 0.2% (27,882) |

Employee of private company:
| Corpus Christi: | 65.0% (76,876) |
| Texas: | 69.6% (6,425,274) |
Self-employed in own incorporated business:
| Corpus Christi: | 2.7% (3,240) |
| Texas: | 2.7% (250,864) |
Private not-for-profit wage and salary workers:
| Corpus Christi: | 6.4% (7,513) |
| Texas: | 5.7% (526,631) |
Local government workers:
| Corpus Christi: | 8.0% (9,438) |
| Texas: | 6.6% (608,479) |
State government workers:
| Corpus Christi: | 5.3% (6,314) |
| Texas: | 5.4% (501,082) |
Federal government workers:
| Corpus Christi: | 5.0% (5,974) |
| Texas: | 2.6% (237,177) |
Self-employed workers in own not incorporated business:
| Corpus Christi: | 7.2% (8,508) |
| Texas: | 7.1% (653,527) |
Unpaid family workers:
| Corpus Christi: | 0.4% (444) |
| Texas: | 0.3% (31,338) |

Employee of private company - Males:
| Corpus Christi: | 68.8% (54,662) |
| Texas: | 73.1% (5,788,450) |
Self-employed in own incorporated business - Males:
| Corpus Christi: | 3.3% (2,654) |
| Texas: | 4.2% (332,655) |
Private not-for-profit wage and salary workers - Males:
| Corpus Christi: | 3.5% (2,749) |
| Texas: | 4.1% (323,476) |
Local government workers - Males:
| Corpus Christi: | 6.0% (4,759) |
| Texas: | 5.1% (405,467) |
State government workers - Males:
| Corpus Christi: | 2.7% (2,152) |
| Texas: | 3.0% (236,706) |
Federal government workers - Males:
| Corpus Christi: | 7.0% (5,567) |
| Texas: | 2.7% (211,629) |
Self-employed workers in own not incorporated business - Males:
| Corpus Christi: | 8.5% (6,764) |
| Texas: | 7.7% (609,246) |
Unpaid family workers - Males:
| Corpus Christi: | 0.2% (167) |
| Texas: | 0.2% (12,606) |

Employee of private company - Females:
| Corpus Christi: | 66.7% (47,532) |
| Texas: | 65.4% (4,351,216) |
Self-employed in own incorporated business - Females:
| Corpus Christi: | 2.5% (1,779) |
| Texas: | 2.8% (183,791) |
Private not-for-profit wage and salary workers - Females:
| Corpus Christi: | 7.8% (5,579) |
| Texas: | 8.2% (546,978) |
Local government workers - Females:
| Corpus Christi: | 10.2% (7,303) |
| Texas: | 10.6% (704,332) |
State government workers - Females:
| Corpus Christi: | 4.0% (2,815) |
| Texas: | 4.8% (321,912) |
Federal government workers - Females:
| Corpus Christi: | 3.5% (2,502) |
| Texas: | 2.2% (145,669) |
Self-employed workers in own not incorporated business - Females:
| Corpus Christi: | 5.3% (3,741) |
| Texas: | 5.8% (389,024) |