Columbus, OH (Ohio) Houses and Residents
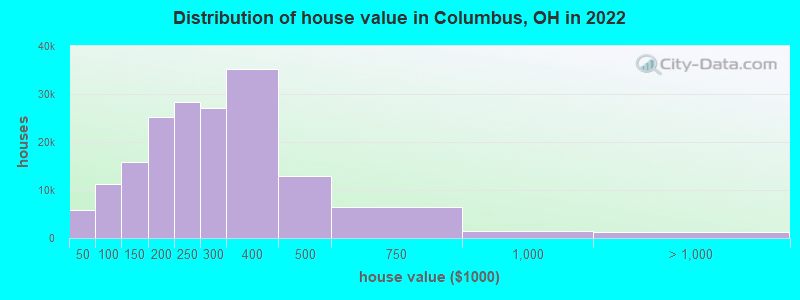
Estimated median house or condo value in 2022: $248,900 (it was $99,100 in 2000 )
Columbus:
$248,900Ohio:
$204,100
Lower value quartile - upper value quartile: $169,100 - $342,200Mean price in 2022: Detached houses: $262,671 Here:
$262,671State:
$254,366
Townhouses or other attached units: $225,866 Here:
$225,866State:
$225,733
In 2-unit structures: $229,348 Here:
$229,348State:
$144,384
In 3-to-4-unit structures: $188,873 Here:
$188,873State:
$203,002
In 5-or-more-unit structures: $370,723 Here:
$370,723State:
$211,593
Mobile homes: $63,253 Here:
$63,253State:
$62,719
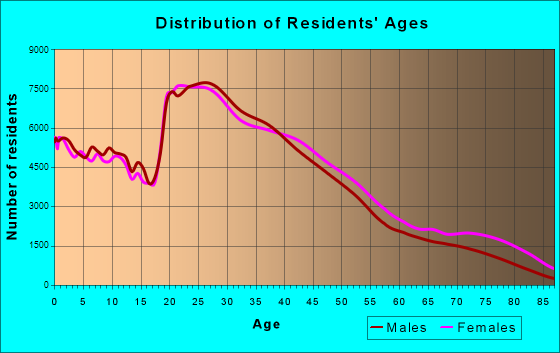
Total population: 835,957 (Urban population: 710,350, Rural population: 1,294 (44 farm, 1,250 nonfarm ))
Houses: 429,289 (392,041 occupied: 170,155 owner occupied, 221,886 renter occupied )
% of renters here:
57%State:
33%
Housing density: 2,042 houses/condos per square mile
Median price asked for vacant for-sale houses and condos in 2022: $195,410.
Median contract rent in 2022: $1,005 (lower quartile is $786, upper quartile is $1,307)
Median rent asked for vacant for-rent units in 2022: $1,908
Median gross rent in Columbus, OH in 2022: $1,208
Housing units in Columbus with a mortgage: 117,926 (13,635 second mortgage, 494 home equity loan, 11,867 both second mortgage and home equity loan )Houses without a mortgage: 4,108
Median household income for houses/condos with a mortgage: $96,826
Median household income for apartments without a mortgage: $64,309
Median monthly housing costs: $1,203
Data:
Median house or condo value ($)
Median house or condo value ($ change since 2000)
Median house or condo value ($) - White
Median house or condo value ($) - Black or African American
Median house or condo value ($) - Asian
Median house or condo value ($) - Hispanic or Latino
Median house or condo value ($) - American Indian and Alaska Native
Median house or condo value ($) - Multirace
Median house or condo value ($) - Other Race
Median price asked for mobile homes ($)
Household density (households per square mile)
Mean house or condo value by units in structure - 1, detached ($)
Mean house or condo value by units in structure - 1, attached ($)
Mean house or condo value by units in structure - 2 ($)
Mean house or condo value by units in structure by units in structure - 3 or 4 ($)
Mean house or condo value by units in structure - 5 or more ($)
Mean house or condo value by units in structure - Boat, RV, van, etc. ($)
Mean house or condo value by units in structure - Mobile home ($)
Median contract rent ($)
Median contract rent - Lower quartile ($)
Median contract rent - Upper quartile ($)
Median gross rent ($)
Urban houses (%)
Rural houses (%)
Houses occupied (%)
Houses occupied (% change since 2000)
Houses owner occupied (%)
Houses owner occupied (% change since 2000)
Houses renter occupied (%)
Houses renter occupied (% change since 2000)
Vacant housing units - For rent (%)
Vacant housing units - For rent (% change since 2000)
Vacant housing units - For sale only (%)
Vacant housing units - For sale only (% change since 2000)
Vacant housing units - Rented or sold, not occupied (%)
Vacant housing units - Rented or sold, not occupied (% change since 2000)
Vacant housing units - For seasonal, recreational, or occasional use (%)
Vacant housing units - For seasonal, recreational, or occasional use (% change since 2000)
Vacant housing units - For migrant workers (%)
Vacant housing units - For migrant workers (% change since 2000)
Vacant housing units - Other vacant (%)
Vacant housing units - Other vacant (% change since 2000)
Median monthly housing costs ($)
Median household income for houses/condos with a mortgage ($)
Median household income for houses/condos without a mortgage ($)
Median household income ($)
Median household income ($) - White
Median household income ($) - Black or African American
Median household income ($) - Asian
Median household income ($) - Hispanic or Latino
Median household income ($) - American Indian and Alaska Native
Median household income ($) - Multirace
Median household income ($) - Other Race
Mortgage status - with mortgage (%)
Mortgage status - with second mortgage (%)
Mortgage status - with home equity loan (%)
Mortgage status - with both second mortgage and home equity loan (%)
Mortgage status - without a mortgage (%)
Median year house/condo built
Median year apartment built
Household type by relationship - Male householder living alone (%)
Household type by relationship - Male householder not living alone (%)
Household type by relationship - Female householder living alone (%)
Household type by relationship - Female householder not living alone (%)
Household type by relationship - Opposite-Sex spouse (%)
Household type by relationship - Same-Sex spouse (%)
Household type by relationship - Opposite-Sex unmarried partner (%)
Household type by relationship - Same-Sex unmarried partner (%)
Household type by relationship - In group quarters (%)
Size of family households - 2-person household (%)
Size of family households - 3-person household (%)
Size of family households - 4-person household (%)
Size of family households - 5-person household (%)
Size of family households - 6-person household (%)
Size of family households - 7-or-more-person household (%)
Size of nonfamily households - 1-person household (%)
Size of nonfamily households - 2-person household (%)
Size of nonfamily households - 3-person household (%)
Size of nonfamily households - 4-person household (%)
Size of nonfamily households - 5-person household (%)
Size of nonfamily households - 6-person household (%)
Size of nonfamily households - 7-or-moreperson household (%)
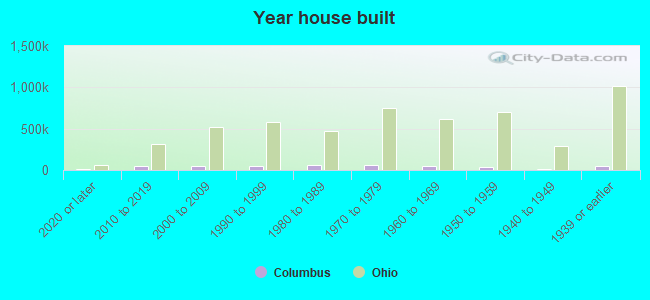
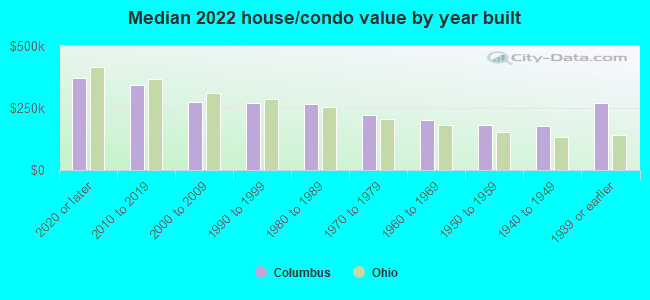
Year house built - Built 2010 or later (%)
Year house built - Built 2000 to 2009 (%)
Year house built - Built 1990 to 1999 (%)
Year house built - Built 1980 to 1989 (%)
Year house built - Built 1970 to 1979 (%)
Year house built - Built 1960 to 1969 (%)
Year house built - Built 1950 to 1959 (%)
Year house built - Built 1940 to 1949 (%)
Year house built - Built 1939 or earlier (%)
Median number of rooms in houses and condos
Median number of rooms in apartments
Median number of bedrooms in owner occupied houses
Mean number of bedrooms in owner occupied houses
Median number of bedrooms in renter occupied houses
Mean number of bedrooms in renter occupied houses
Median number of vehichles in owner occupied houses
Mean number of vehichles in owner occupied houses
Median number of vehichles in renter occupied houses
Mean number of vehichles in renter occupied houses
Rooms in owner-occupied houses - 1 room (%)
Rooms in owner-occupied houses - 2 rooms (%)
Rooms in owner-occupied houses - 3 rooms (%)
Rooms in owner-occupied houses - 4 rooms (%)
Rooms in owner-occupied houses - 5 rooms (%)
Rooms in owner-occupied houses - 6 rooms (%)
Rooms in owner-occupied houses - 7 rooms (%)
Rooms in owner-occupied houses - 8 rooms (%)
Rooms in owner-occupied houses - 9+ rooms (%)
Rooms in renter-occupied houses - 1 room (%)
Rooms in renter-occupied houses - 2 rooms (%)
Rooms in renter-occupied houses - 3 rooms (%)
Rooms in renter-occupied houses - 4 rooms (%)
Rooms in renter-occupied houses - 5 rooms (%)
Rooms in renter-occupied houses - 6 rooms (%)
Rooms in renter-occupied houses - 7 rooms (%)
Rooms in renter-occupied houses - 8 rooms (%)
Rooms in renter-occupied houses - 9+ rooms (%)
Bedrooms in owner-occupied houses - no bedrooms (%)
Bedrooms in owner-occupied houses - 1 bedroom (%)
Bedrooms in owner-occupied houses - 2 bedrooms (%)
Bedrooms in owner-occupied houses - 3 bedrooms (%)
Bedrooms in owner-occupied houses - 4 bedrooms (%)
Bedrooms in owner-occupied houses - 5+ bedrooms (%)
Bedrooms in renter-occupied houses - no bedrooms (%)
Bedrooms in renter-occupied houses - 1 bedroom (%)
Bedrooms in renter-occupied houses - 2 bedrooms (%)
Bedrooms in renter-occupied houses - 3 bedrooms (%)
Bedrooms in renter-occupied houses - 4 bedrooms (%)
Bedrooms in renter-occupied houses - 5+ bedrooms (%)
Vehicles available in owner-occupied houses - no vehicle available (%)
Vehicles available in owner-occupied houses - 1 vehicle available(%)
Vehicles available in owner-occupied houses - 2 Vehicles available (%)
Vehicles available in owner-occupied houses - 3 Vehicles available (%)
Vehicles available in owner-occupied houses - 4 Vehicles available (%)
Vehicles available in owner-occupied houses - 5+ Vehicles available (%)
Vehicles available in renter-occupied houses - no vehicle available (%)
Vehicles available in renter-occupied houses - 1 vehicle available (%)
Vehicles available in renter-occupied houses - 2 Vehicles available (%)
Vehicles available in renter-occupied houses - 3 Vehicles available (%)
Vehicles available in renter-occupied houses - 4 Vehicles available (%)
Vehicles available in renter-occupied houses - 5+ Vehicles available (%)
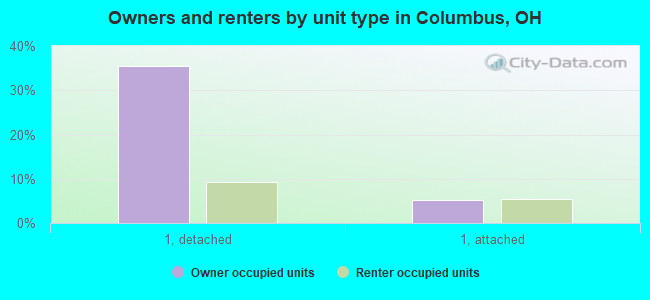
Housing units in structures - 1, detached (%)
Housing units in structures - 1, attached (%)
Housing units in structures - 2 (%)
Housing units in structures - 3 or 4 (%)
Housing units in structures - 5 to 9 (%)
Housing units in structures - 10 to 19 (%)
Housing units in structures - 20 to 49 (%)
Housing units in structures - 50 or more (%)
Housing units in structures - Mobile home (%)
Housing units in structures - Boat, RV, van, etc. (%)
Housing units in structures - Owners - 1, detached (%)
Housing units in structures - Owners - 1, attached (%)
Housing units in structures - Owners - 2 (%)
Housing units in structures - Owners - 3 or 4 (%)
Housing units in structures - Owners - 5 to 9 (%)
Housing units in structures - Owners - 10 to 19 (%)
Housing units in structures - Owners - 20 to 49 (%)
Housing units in structures - Owners - 50 or more (%)
Housing units in structures - Owners - Mobile home (%)
Housing units in structures - Owners - Boat, RV, van, etc. (%)
Housing units in structures - Renters - 1, detached (%)
Housing units in structures - Renters - 1, attached (%)
Housing units in structures - Renters - 2 (%)
Housing units in structures - Renters - 3 or 4 (%)
Housing units in structures - Renters - 5 to 9 (%)
Housing units in structures - Renters - 10 to 19 (%)
Housing units in structures - Renters - 20 to 49 (%)
Housing units in structures - Renters - 50 or more (%)
Housing units in structures - Renters - Mobile home (%)
Housing units in structures - Renters - Boat, RV, van, etc. (%)
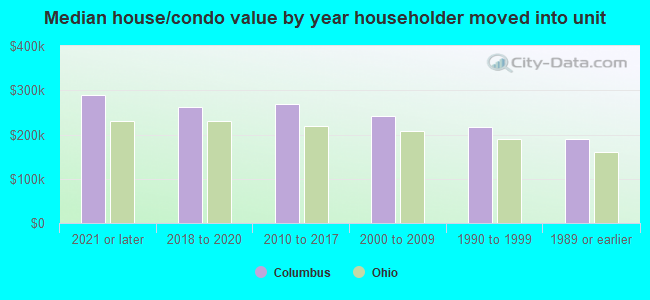
House/condo owner moved in on average (years ago)
Renter moved in on average (years ago)
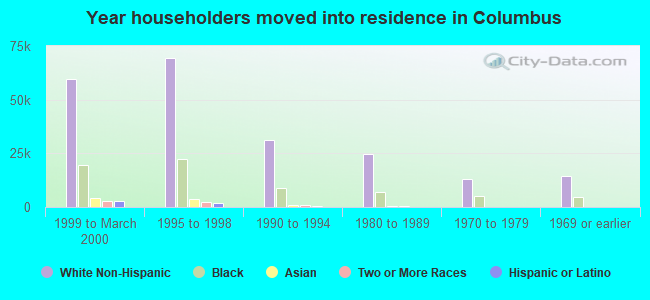
Year householder moved into unit - Moved in 1999 to March 2000 (%)
Year householder moved into unit - Moved in 1999 to March 2000 (%) - White
Year householder moved into unit - Moved in 1999 to March 2000 (%) - Black or African American
Year householder moved into unit - Moved in 1999 to March 2000 (%) - Asian
Year householder moved into unit - Moved in 1999 to March 2000 (%) - Hispanic or Latino
Year householder moved into unit - Moved in 1999 to March 2000 (%) - American Indian and Alaska Native
Year householder moved into unit - Moved in 1999 to March 2000 (%) - Multirace
Year householder moved into unit - Moved in 1999 to March 2000 (%) - Other Race
Year householder moved into unit - Moved in 1995 to 1998 (%)
Year householder moved into unit - Moved in 1995 to 1998 (%) - White
Year householder moved into unit - Moved in 1995 to 1998 (%) - Black or African American
Year householder moved into unit - Moved in 1995 to 1998 (%) - Asian
Year householder moved into unit - Moved in 1995 to 1998 (%) - Hispanic or Latino
Year householder moved into unit - Moved in 1995 to 1998 (%) - American Indian and Alaska Native
Year householder moved into unit - Moved in 1995 to 1998 (%) - Multirace
Year householder moved into unit - Moved in 1995 to 1998 (%) - Other Race
Year householder moved into unit - Moved in 1990 to 1994 (%)
Year householder moved into unit - Moved in 1990 to 1994 (%) - White
Year householder moved into unit - Moved in 1990 to 1994 (%) - Black or African American
Year householder moved into unit - Moved in 1990 to 1994 (%) - Asian
Year householder moved into unit - Moved in 1990 to 1994 (%) - Hispanic or Latino
Year householder moved into unit - Moved in 1990 to 1994 (%) - American Indian and Alaska Native
Year householder moved into unit - Moved in 1990 to 1994 (%) - Multirace
Year householder moved into unit - Moved in 1990 to 1994 (%) - Other Race
Year householder moved into unit - Moved in 1980 to 1989 (%)
Year householder moved into unit - Moved in 1980 to 1989 (%) - White
Year householder moved into unit - Moved in 1980 to 1989 (%) - Black or African American
Year householder moved into unit - Moved in 1980 to 1989 (%) - Asian
Year householder moved into unit - Moved in 1980 to 1989 (%) - Hispanic or Latino
Year householder moved into unit - Moved in 1980 to 1989 (%) - American Indian and Alaska Native
Year householder moved into unit - Moved in 1980 to 1989 (%) - Multirace
Year householder moved into unit - Moved in 1980 to 1989 (%) - Other Race
Year householder moved into unit - Moved in 1970 to 1979 (%)
Year householder moved into unit - Moved in 1970 to 1979 (%) - White
Year householder moved into unit - Moved in 1970 to 1979 (%) - Black or African American
Year householder moved into unit - Moved in 1970 to 1979 (%) - Asian
Year householder moved into unit - Moved in 1970 to 1979 (%) - Hispanic or Latino
Year householder moved into unit - Moved in 1970 to 1979 (%) - American Indian and Alaska Native
Year householder moved into unit - Moved in 1970 to 1979 (%) - Multirace
Year householder moved into unit - Moved in 1970 to 1979 (%) - Other Race
Year householder moved into unit - Moved in 1969 or earlier (%)
Year householder moved into unit - Moved in 1969 or earlier (%) - White
Year householder moved into unit - Moved in 1969 or earlier (%) - Black or African American
Year householder moved into unit - Moved in 1969 or earlier (%) - Asian
Year householder moved into unit - Moved in 1969 or earlier (%) - Hispanic or Latino
Year householder moved into unit - Moved in 1969 or earlier (%) - American Indian and Alaska Native
Year householder moved into unit - Moved in 1969 or earlier (%) - Multirace
Year householder moved into unit - Moved in 1969 or earlier (%) - Other Race
Housing units lacking complete plumbing facilities (%)
Housing units lacking complete kitchen facilities (%)
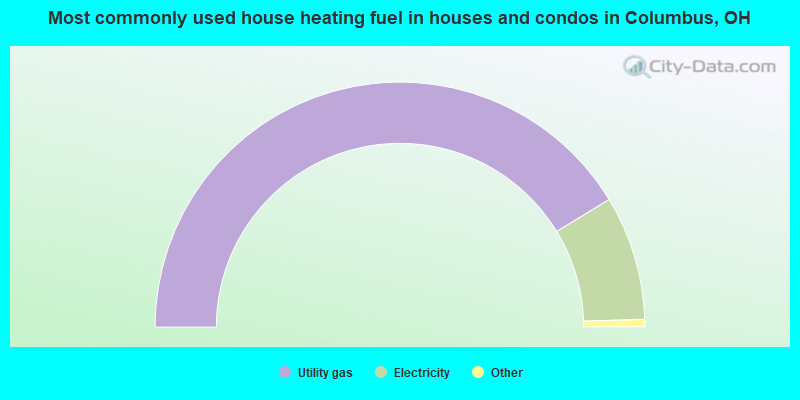
House heating fuel used in houses and condos - Utility gas (%)
House heating fuel used in houses and condos - Bottled, tank, or LP gas (%)
House heating fuel used in houses and condos - Electricity (%)
House heating fuel used in houses and condos - Fuel oil, kerosene, etc. (%)
House heating fuel used in houses and condos - Coal or coke (%)
House heating fuel used in houses and condos - Wood (%)
House heating fuel used in houses and condos - Solar energy (%)
House heating fuel used in houses and condos - Other fuel (%)
House heating fuel used in houses and condos - No fuel used (%)
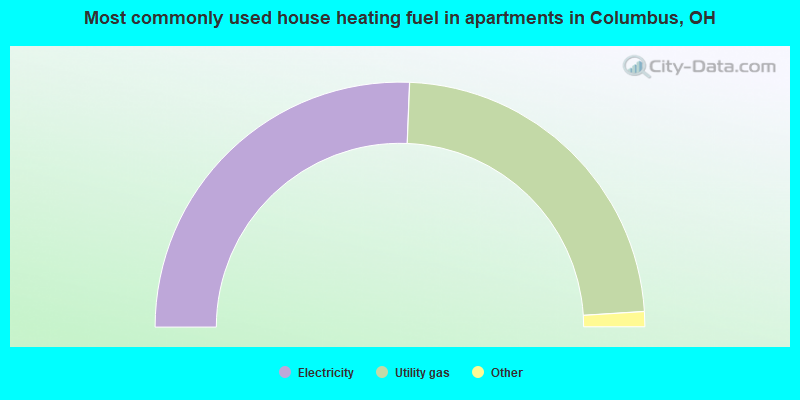
House heating fuel used in apartments - Utility gas (%)
House heating fuel used in apartments - Bottled, tank, or LP gas (%)
House heating fuel used in apartments - Electricity (%)
House heating fuel used in apartments - Fuel oil, kerosene, etc. (%)
House heating fuel used in apartments - Coal or coke (%)
House heating fuel used in apartments - Wood (%)
House heating fuel used in apartments - Solar energy (%)
House heating fuel used in apartments - Other fuel (%)
House heating fuel used in apartments - No fuel used (%)
Latest news about housing in Columbus, OH collected exclusively by city-data.com from local newspapers, TV, and radio stations
Median year house/condo built: 1979Median year apartment built: 1982Household type by relationship:
Households: 908,372
Male householders: 183,107 (70,234 living alone ), Female householders: 208,934 (75,261 living alone )121,491 spouses (119,457 opposite-sex spouses ), 40,167 unmarried partners , (37,249 opposite-sex unmarried partners ), 232,431 children (222,760 natural , 3,233 adopted , 6,438 stepchildren ), 13,871 grandchildren , 11,833 brothers or sisters , 9,914 parents , 838 foster children , 14,028 other relatives , 47,884 non-relatives In group quarters: 23,874
Size of family households: 93,336 2-persons , 47,765 3-persons , 31,163 4-persons , 16,844 5-persons , 6,734 6-persons , 3,344 7-or-more-persons .
Size of nonfamily households: 145,495 1-person , 39,641 2-persons , 4,451 3-persons , 1,689 4-persons , 719 5-persons , 536 6-persons , 324 7-or-more-persons .
94,166 married couples with children. single-parent households (14,953 men , 62,443 women ).
81.9% of residents of Columbus speak English at home. of residents speak Spanish at home (52% speak English very well , 20% speak English well , 18% speak English not well , 11% don't speak English at all ).of residents speak other Indo-European language at home (58% speak English very well , 26% speak English well , 10% speak English not well , 5% don't speak English at all ).of residents speak Asian or Pacific Island language at home (53% speak English very well , 26% speak English well , 20% speak English not well , 1% don't speak English at all ).of residents speak other language at home (66% speak English very well , 22% speak English well , 8% speak English not well , 4% don't speak English at all ).
Foreign born population: 133,967 (14.7%)of them are naturalized citizens )
Median number of rooms in houses and condos:
Median number of rooms in apartments
Owner-occupied Renter-occupied
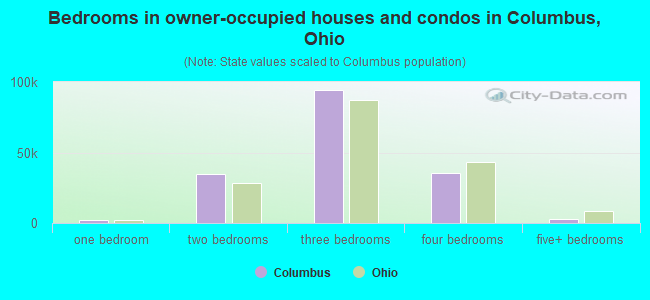
Bedrooms in owner-occupied houses and condos in Columbus, Ohio
486 no bedroom 1,929 1 bedroom 35,099 2 bedrooms 94,389 3 bedrooms 35,343 4 bedrooms 2,909 5+ bedrooms
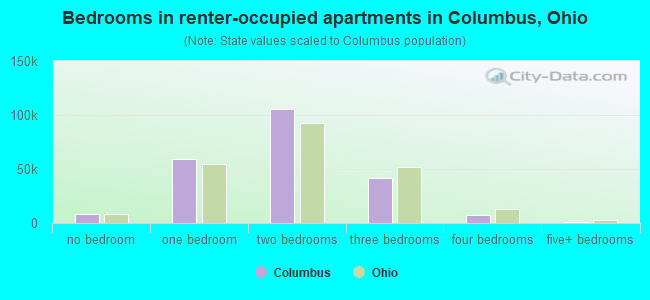
Bedrooms in renter-occupied apartments in Columbus, Ohio
8,206 no bedroom 58,888 1 bedroom 105,340 2 bedrooms 41,263 3 bedrooms 7,326 4 bedrooms 863 5+ bedrooms
Owner-occupied Renter-occupied
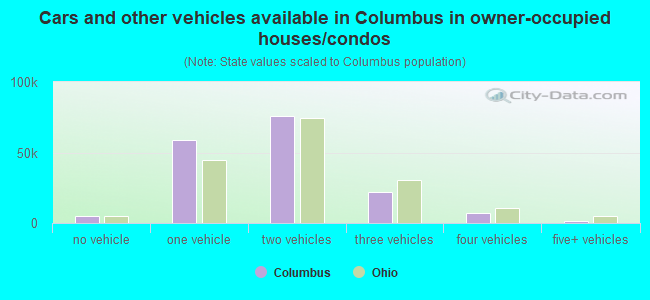
Cars and other vehicles available in Columbus in owner-occupied houses/condos
4,782 no vehicle 59,015 1 vehicle 75,790 2 vehicles 22,075 3 vehicles 6,963 4 vehicles 1,530 5+ vehicles
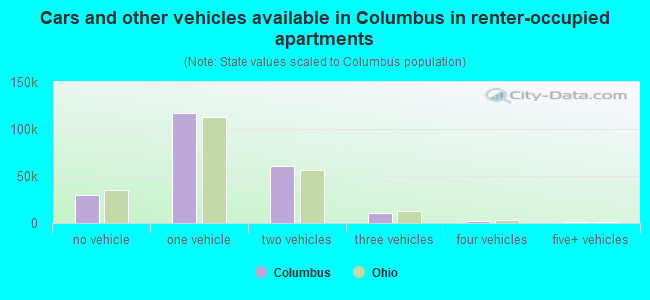
Cars and other vehicles available in Columbus in renter-occupied apartments
30,050 no vehicle 116,847 1 vehicle 60,290 2 vehicles 10,662 3 vehicles 2,623 4 vehicles 1,414 5+ vehicles
Owner-occupied Renter-occupied
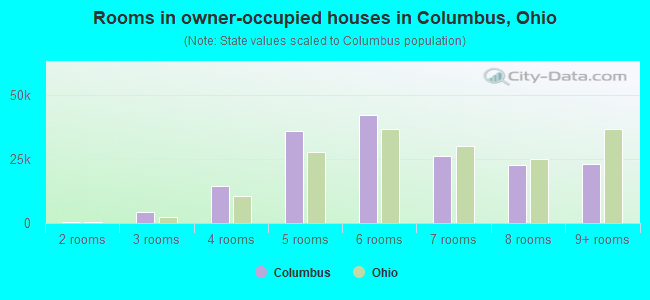
Rooms in owner-occupied houses in Columbus, Ohio
305 1 room 386 2 rooms 4,488 3 rooms 14,505 4 rooms 35,991 5 rooms 42,334 6 rooms 26,402 7 rooms 22,733 8 rooms 23,011 9+ rooms
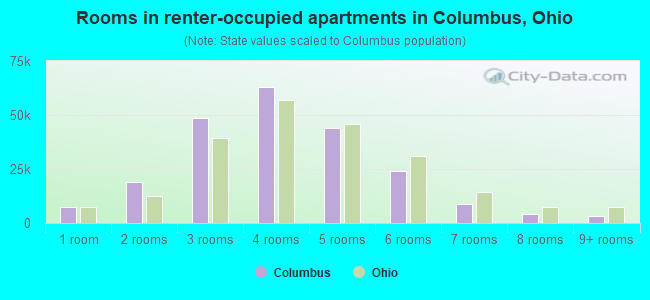
Rooms in renter-occupied apartments in Columbus, Ohio
7,419 1 room 19,198 2 rooms 48,395 3 rooms 62,831 4 rooms 43,946 5 rooms 23,901 6 rooms 8,782 7 rooms 4,163 8 rooms 3,251 9+ rooms
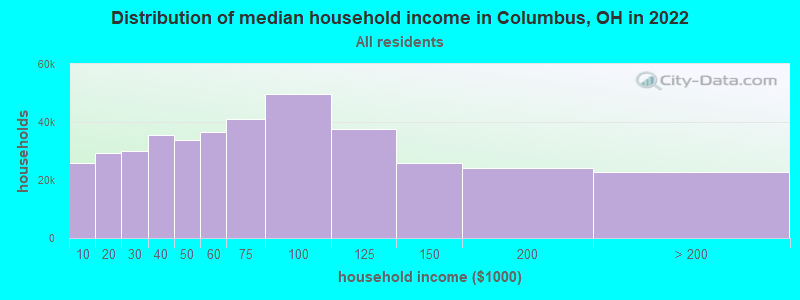
Columbus, OH household income distribution 25,827 Less than $10,00029,245 $10,000 to $19,99930,101 $20,000 to $29,99935,639 $30,000 to $39,99933,857 $40,000 to $49,99936,559 $50,000 to $59,99941,189 $60,000 to $74,99949,494 $75,000 to $99,99937,416 $100,000 to $124,99925,861 $125,000 to $149,99924,084 $150,000 to $199,99922,769 $200,000 or more
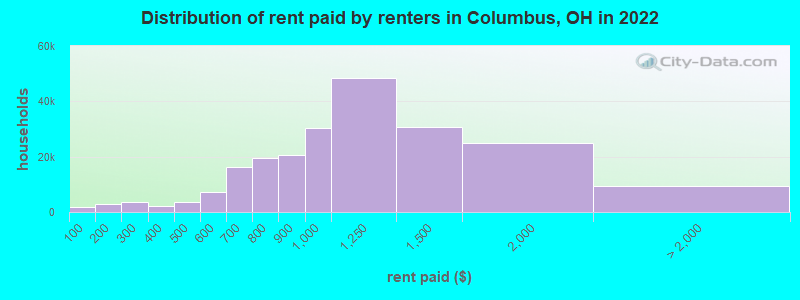
Home value of owner - occupied houses in 2022 in Columbus, OH 1,905 Less than $10,0001,021 $10,000 to $14,999330 $15,000 to $19,999447 $20,000 to $24,999736 $25,000 to $29,999415 $30,000 to $34,999169 $35,000 to $39,999894 $40,000 to $49,9991,284 $50,000 to $59,9991,456 $60,000 to $69,9991,199 $70,000 to $79,9994,227 $80,000 to $89,9992,248 $90,000 to $99,9997,358 $100,000 to $124,9998,579 $125,000 to $149,99913,425 $150,000 to $174,99911,743 $175,000 to $199,99928,289 $200,000 to $249,99927,000 $250,000 to $299,99935,276 $300,000 to $399,99912,899 $400,000 to $499,9996,543 $500,000 to $749,9991,462 $750,000 to $999,9991,178 $1,000,000 to $1,499,99972 $1,500,000 to $1,999,999Rent paid by renters in 2022 in Columbus, OH 1,756 Less than $1001,176 $100 to $1491,850 $150 to $1992,224 $200 to $2491,551 $250 to $2991,581 $300 to $349455 $350 to $3991,907 $400 to $4491,811 $450 to $4993,166 $500 to $5494,000 $550 to $5996,136 $600 to $64910,092 $650 to $69910,027 $700 to $7499,460 $750 to $79920,492 $800 to $89930,416 $900 to $99948,576 $1,000 to $1,24930,783 $1,250 to $1,49924,983 $1,500 to $1,9993,133 $2,000 to $2,4991,492 $2,500 to $2,999426 $3,000 to $3,499729 $3,500 or more3,664 No cash rent
Percentage of workers working in this county: 88.0%Number of people working at home: 88,381 (18.2% of all workers )
Travel time to work (commute)
Less than 5 minutes: 6,5625 to 9 minutes: 35,07910 to 14 minutes: 61,37015 to 19 minutes: 81,66420 to 24 minutes: 87,26225 to 29 minutes: 33,86830 to 34 minutes: 48,07035 to 39 minutes: 8,28540 to 44 minutes: 8,28045 to 59 minutes: 12,45760 to 89 minutes: 8,77690 or more minutes: 4,433
Means of transportation to work:
Drove a car alone: 376,393 (70.6%)Carpooled: 40,601 (7.6%)Bus : 9,628 (1.8%)Ferryboat: 58 (0.0%)Taxi: 7,294 (1.4%)Bicycle: 1,757 (0.3%)Walked: 9,087 (1.7%)Worked at home: 88,381 (16.6%)
Unemployment by race in 2022
Unemployment rate for White non-Hispanic residents 3.6% Males2.6% FemalesUnemployment rate for Black residents 8.2% Males7.2% FemalesUnemployment rate for American Indian and Alaska Native residents 7.8% Males10.9% FemalesUnemployment rate for Asian residents 2.1% Males4.3% FemalesUnemployment rate for other race residents 2.1% Males9.3% FemalesUnemployment rate for two or more race residents 5.0% Males4.5% FemalesUnemployment rate for Hispanic or Latino residents 2.7% Males4.7% Females
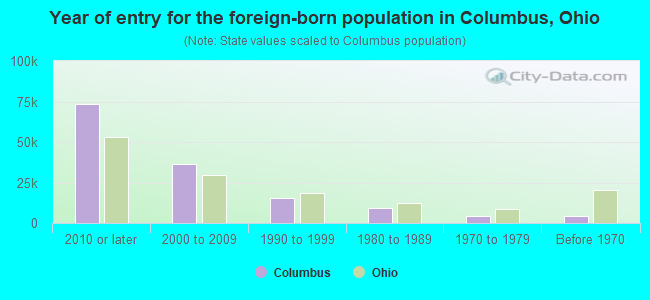
Year of entry for the foreign-born population in Columbus, Ohio
73,279 2010 or later 36,445 2000 to 2009 15,313 1990 to 1999 9,004 1980 to 1989 4,099 1970 to 1979 4,201 Before 1970
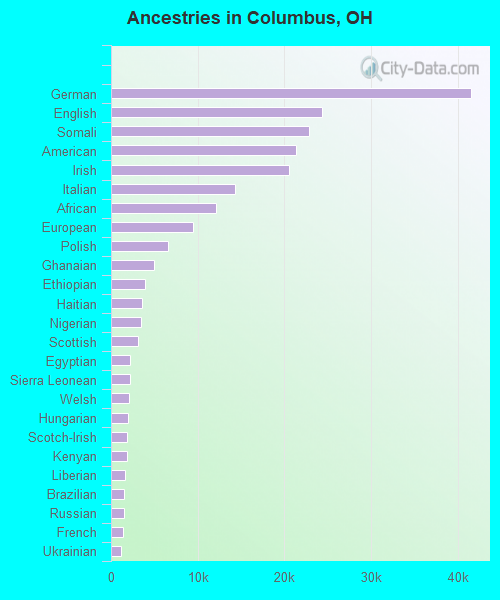
First ancestries reported:
German: 41,541 (8.4%)
English: 24,330 (4.9%)
Somali: 22,858 (4.6%)
American: 21,362 (4.3%)
Irish: 20,543 (4.2%)
Italian: 14,254 (2.9%)
African: 12,158 (2.5%)
European: 9,432 (1.9%)
Polish: 6,543 (1.3%)
Ghanaian: 4,966 (1.0%)
Ethiopian: 3,957 (0.8%)
Haitian: 3,612 (0.7%)
Nigerian: 3,478 (0.7%)
Scottish: 3,062 (0.6%)
Egyptian: 2,225 (0.5%)
Sierra Leonean: 2,174 (0.4%)
Welsh: 2,077 (0.4%)
Hungarian: 1,941 (0.4%)
Scotch-Irish: 1,855 (0.4%)
Kenyan: 1,846 (0.4%)
Liberian: 1,620 (0.3%)
Brazilian: 1,540 (0.3%)
Russian: 1,475 (0.3%)
French: 1,394 (0.3%)
Ukrainian: 1,188 (0.2%)
Greek: 1,137 (0.2%)
Lebanese: 1,006 (0.2%)
Jordanian: 953 (0.2%)
British: 857 (0.2%)
Slovak: 831 (0.2%)
Eastern European: 795 (0.2%)
Jamaican: 783 (0.2%)
Iraqi: 769 (0.2%)
Turkish: 747 (0.2%)
Dutch: 743 (0.2%)
Afghan: 696 (0.1%)
Norwegian: 693 (0.1%)
Scandinavian: 655 (0.1%)
Romanian: 632 (0.1%)
Palestinian: 631 (0.1%)
Moroccan: 575 (0.1%)
Swedish: 503 (0.1%)
Iranian: 483 (0.10%)
Macedonian: 471 (0.10%)
Arab: 452 (0.09%)
Czech: 442 (0.09%)
West Indian: 438 (0.09%)
Sudanese: 434 (0.09%)
Croatian: 416 (0.08%)
Syrian: 378 (0.08%)
Slovene: 374 (0.08%)
Swiss: 357 (0.07%)
Israeli: 307 (0.06%)
Canadian: 301 (0.06%)
Northern European: 287 (0.06%)
Senegalese: 266 (0.05%)
Lithuanian: 247 (0.05%)
Bulgarian: 235 (0.05%)
Austrian: 234 (0.05%)
French Canadian: 218 (0.04%)
Danish: 208 (0.04%)
Portuguese: 201 (0.04%)
Serbian: 194 (0.04%)
Yugoslavian: 193 (0.04%)
Czechoslovakian: 149 (0.03%)
Trinidadian and Tobagonian: 147 (0.03%)
Slavic: 121 (0.02%)
Albanian: 118 (0.02%)
Finnish: 92 (0.02%)
Barbadian: 90 (0.02%)
Pennsylvania German: 89 (0.02%)
Armenian: 84 (0.02%)
Belgian: 76 (0.02%)
Belizean: 61 (0.01%)
U.S. Virgin Islander: 57 (0.01%)
Bahamian: 42 (0.01%)
South African: 40 (0.01%)
Maltese: 37 (0.01%)
Ugandan: 35 (0.01%)
Australian: 35 (0.01%)
New Zealander: 34 (0.01%)
Alsatian: 32 (0.01%)
Bermudan: 29 (0.01%)
Most common places of birth for foreign-born residents (%): India Columbus:
9.5% (12,257)Ohio:
11.6% (66,525)
Mexico Columbus:
8.5% (10,989)Ohio:
7.8% (44,796)
Somalia Columbus:
8.4% (10,908)Ohio:
2.2% (12,861)
China, excluding Hong Kong and Taiwan Columbus:
4.2% (5,432)Ohio:
6.2% (35,703)
Ghana Columbus:
3.9% (4,980)Ohio:
1.8% (10,561)
Bhutan Columbus:
3.8% (4,906)Ohio:
2.4% (13,773)
Kenya Columbus:
3.3% (4,236)Ohio:
1.0% (5,674)
Nepal Columbus:
2.4% (3,120)Ohio:
1.9% (10,777)
Ethiopia Columbus:
2.4% (3,084)Ohio:
1.5% (8,380)
Haiti Columbus:
2.4% (3,052)Ohio:
0.5% (2,819)
Dominican Republic Columbus:
2.1% (2,706)Ohio:
1.1% (6,549)
El Salvador Columbus:
2.1% (2,663)Ohio:
1.4% (7,947)
Nigeria Columbus:
1.7% (2,230)Ohio:
1.2% (7,029)
Other Western Africa Columbus:
1.6% (2,014)Ohio:
0.9% (5,331)
Venezuela Columbus:
1.6% (2,012)Ohio:
0.7% (3,920)
Africa, n.e.c. Columbus:
1.6% (2,012)Ohio:
1.1% (6,096)
Korea Columbus:
1.5% (1,999)Ohio:
2.0% (11,398)
Place of birth for U.S.-born residents:
This state: 559,175Other state: 203,732Northeast: 52,004Midwest: 51,914South: 75,124West: 24,690 79.3% of Columbus residents lived in the same house 1 years ago.
Out of people who lived in different houses, 40.2% lived in this county.
Out of people who lived in different counties, 55.9% lived in Ohio.
Columbus:
79.3%State average:
87.8%
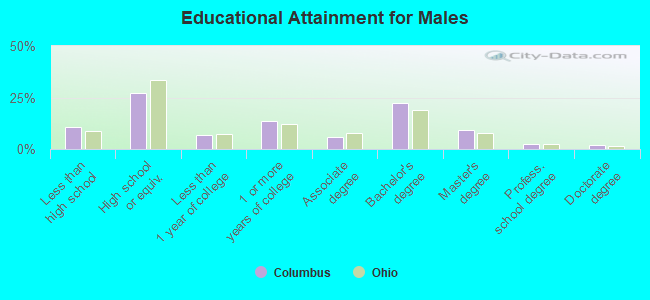
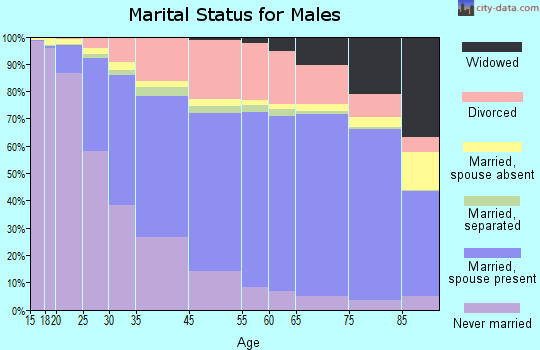
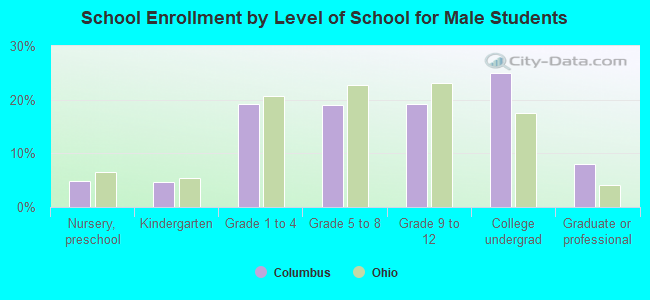
Education attainment for males 25 years and older:
No schooling: 6,580Nursery to 4th grade: 1,1895th and 6th grade: 1,6617th and 8th grade: 1,5189th grade: 4,32810th grade: 3,72911th grade: 5,40212th grade, no diploma: 6,978High school graduate (or equivalency): 81,875Less than 1 year of college: 19,943Some college more than 1 year, no degree: 40,237Associate degree: 17,841Bachelor's degree: 67,359Master's degree: 27,267Professional school degree: 7,265Doctorate degree: 5,588
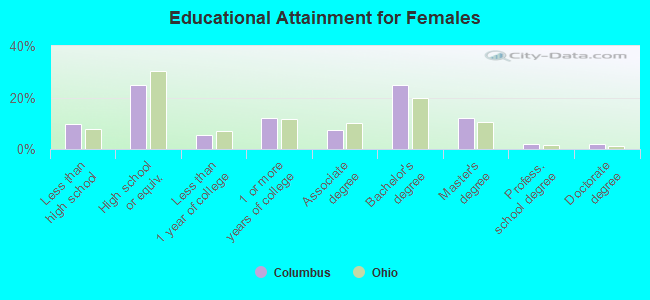
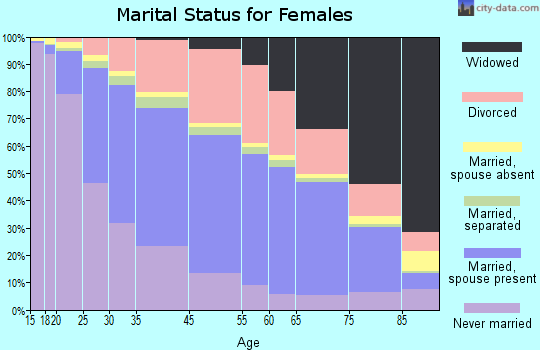
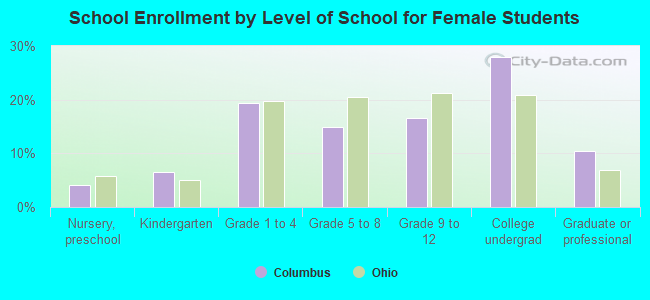
Education attainment for females 25 years and older:
No schooling: 6,704Nursery to 4th grade: 1,0595th and 6th grade: 1,8117th and 8th grade: 1,7779th grade: 2,69810th grade: 4,29811th grade: 6,03612th grade, no diploma: 5,625High school graduate (or equivalency): 76,488Less than 1 year of college: 16,387Some college more than 1 year, no degree: 37,400Associate degree: 22,911Bachelor's degree: 77,111Master's degree: 37,746Professional school degree: 6,352Doctorate degree: 5,606
Housing units in structures:
One, detached: 185,844One, attached: 44,779Two: 15,5973 or 4: 40,5545 to 9: 48,31510 to 19: 36,00120 to 49: 19,24650 or more: 35,727Mobile homes: 3,226Median worth of mobile homes: $18,400
Housing units lacking complete plumbing facilities in 2022: 1.1%Housing units lacking complete kitchen facilities in 2022: 2.2%House/condo owner moved in on average 10 years ago
Renter moved in on average 2 years ago
Private vs. public school enrollment:
Students in private schools in grades 1 to 8 (elementary and middle school): 12,013 Students in private schools in grades 9 to 12 (high school): 4,054 Students in private undergraduate colleges: 7,148