Races in Columbus, Ohio (OH) Detailed Stats
Data:
Races - White alone (%)
Races - White alone (% change since 2000)
Races - Black alone (%)
Races - Black alone (% change since 2000)
Races - American Indian alone (%)
Races - American Indian alone (% change since 2000)
Races - Asian alone (%)
Races - Asian alone (% change since 2000)
Races - Hispanic (%)
Races - Hispanic (% change since 2000)
Races - Native Hawaiian and Other Pacific Islander alone (%)
Races - Native Hawaiian and Other Pacific Islander alone (% change since 2000)
Races - Two or more races(%)
Races - Two or more races(% change since 2000)
Races - Other race alone (%)
Races - Other race alone (% change since 2000)
Racial diversity
Place of birth - Born in state of residence (%)
Place of birth - Born in state of residence (%) - White
Place of birth - Born in state of residence (%) - Black or African American
Place of birth - Born in state of residence (%) - Asian
Place of birth - Born in state of residence (%) - Hispanic or Latino
Place of birth - Born in state of residence (%) - American Indian and Alaska Native
Place of birth - Born in state of residence (%) - Multirace
Place of birth - Born in state of residence (%) - Other Race
Place of birth - Born in other state (%)
Place of birth - Born in other state (%) - White
Place of birth - Born in other state (%) - Black or African American
Place of birth - Born in other state (%) - Asian
Place of birth - Born in other state (%) - Hispanic or Latino
Place of birth - Born in other state (%) - American Indian and Alaska Native
Place of birth - Born in other state (%) - Multirace
Place of birth - Born in other state (%) - Other Race
Place of birth - Native, outside of US (%)
Place of birth - Native, outside of US (%) - White
Place of birth - Native, outside of US (%) - Black or African American
Place of birth - Native, outside of US (%) - Asian
Place of birth - Native, outside of US (%) - Hispanic or Latino
Place of birth - Native, outside of US (%) - American Indian and Alaska Native
Place of birth - Native, outside of US (%) - Multirace
Place of birth - Native, outside of US (%) - Other Race
Place of birth - Foreign born (%)
Place of birth - Foreign born (%) - White
Place of birth - Foreign born (%) - Black or African American
Place of birth - Foreign born (%) - Asian
Place of birth - Foreign born (%) - Hispanic or Latino
Place of birth - Foreign born (%) - American Indian and Alaska Native
Place of birth - Foreign born (%) - Multirace
Place of birth - Foreign born (%) - Other Race
Residents speaking English at home (%)
Residents speaking English at home - Born in the United States (%)
Residents speaking English at home - Native, born elsewhere (%)
Residents speaking English at home - Foreign born (%)
Residents speaking Spanish at home (%)
Residents speaking Spanish at home - Born in the United States (%)
Residents speaking Spanish at home - Native, born elsewhere (%)
Residents speaking Spanish at home - Foreign born (%)
Residents speaking other language at home (%)
Residents speaking other language at home - Born in the United States (%)
Residents speaking other language at home - Native, born elsewhere (%)
Residents speaking other language at home - Foreign born (%)
Marital status - Never married (%)
Marital status - Now married (%)
Marital status - Separated (%)
Marital status - Widowed (%)
Marital status - Divorced (%)
Ancestries Reported - Arab (%)
Ancestries Reported - Czech (%)
Ancestries Reported - Danish (%)
Ancestries Reported - Dutch (%)
Ancestries Reported - English (%)
Ancestries Reported - French (%)
Ancestries Reported - French Canadian (%)
Ancestries Reported - German (%)
Ancestries Reported - Greek (%)
Ancestries Reported - Hungarian (%)
Ancestries Reported - Irish (%)
Ancestries Reported - Italian (%)
Ancestries Reported - Lithuanian (%)
Ancestries Reported - Norwegian (%)
Ancestries Reported - Polish (%)
Ancestries Reported - Portuguese (%)
Ancestries Reported - Russian (%)
Ancestries Reported - Scotch-Irish (%)
Ancestries Reported - Scottish (%)
Ancestries Reported - Slovak (%)
Ancestries Reported - Subsaharan African (%)
Ancestries Reported - Swedish (%)
Ancestries Reported - Swiss (%)
Ancestries Reported - Ukrainian (%)
Ancestries Reported - United States (%)
Ancestries Reported - Welsh (%)
Ancestries Reported - West Indian (%)
Ancestries Reported - Other (%)
Geographical mobility - Same house 1 year ago (%)
Geographical mobility - Same house 1 year ago (%) - White
Geographical mobility - Same house 1 year ago (%) - Black or African American
Geographical mobility - Same house 1 year ago (%) - Asian
Geographical mobility - Same house 1 year ago (%) - Hispanic or Latino
Geographical mobility - Same house 1 year ago (%) - American Indian and Alaska Native
Geographical mobility - Same house 1 year ago (%) - Multirace
Geographical mobility - Same house 1 year ago (%) - Other Race
Geographical mobility - Moved within same county (%)
Geographical mobility - Moved within same county (%) - White
Geographical mobility - Moved within same county (%) - Black or African American
Geographical mobility - Moved within same county (%) - Asian
Geographical mobility - Moved within same county (%) - Hispanic or Latino
Geographical mobility - Moved within same county (%) - American Indian and Alaska Native
Geographical mobility - Moved within same county (%) - Multirace
Geographical mobility - Moved within same county (%) - Other Race
Geographical mobility - Moved from different county within same state (%)
Geographical mobility - Moved from different county within same state (%) - White
Geographical mobility - Moved from different county within same state (%) - Black or African American
Geographical mobility - Moved from different county within same state (%) - Asian
Geographical mobility - Moved from different county within same state (%) - Hispanic or Latino
Geographical mobility - Moved from different county within same state (%) - American Indian and Alaska Native
Geographical mobility - Moved from different county within same state (%) - Multirace
Geographical mobility - Moved from different county within same state (%) - Other Race
Geographical mobility - Moved from different state (%)
Geographical mobility - Moved from different state (%) - White
Geographical mobility - Moved from different state (%) - Black or African American
Geographical mobility - Moved from different state (%) - Asian
Geographical mobility - Moved from different state (%) - Hispanic or Latino
Geographical mobility - Moved from different state (%) - American Indian and Alaska Native
Geographical mobility - Moved from different state (%) - Multirace
Geographical mobility - Moved from different state (%) - Other Race
Geographical mobility - Moved from abroad (%)
Geographical mobility - Moved from abroad (%) - White
Geographical mobility - Moved from abroad (%) - Black or African American
Geographical mobility - Moved from abroad (%) - Asian
Geographical mobility - Moved from abroad (%) - Hispanic or Latino
Geographical mobility - Moved from abroad (%) - American Indian and Alaska Native
Geographical mobility - Moved from abroad (%) - Multirace
Geographical mobility - Moved from abroad (%) - Other Race
Place of birth for the foreign-born population - Ireland (%)
Place of birth for the foreign-born population - Denmark (%)
Place of birth for the foreign-born population - Norway (%)
Place of birth for the foreign-born population - Sweden (%)
Place of birth for the foreign-born population - United Kingdom (%)
Place of birth for the foreign-born population - England (%)
Place of birth for the foreign-born population - Scotland (%)
Place of birth for the foreign-born population - Other Northern Europe (%)
Place of birth for the foreign-born population - Austria (%)
Place of birth for the foreign-born population - Belgium (%)
Place of birth for the foreign-born population - France (%)
Place of birth for the foreign-born population - Germany (%)
Place of birth for the foreign-born population - Netherlands (%)
Place of birth for the foreign-born population - Switzerland (%)
Place of birth for the foreign-born population - Other Western Europe (%)
Place of birth for the foreign-born population - Greece (%)
Place of birth for the foreign-born population - Italy (%)
Place of birth for the foreign-born population - Portugal (%)
Place of birth for the foreign-born population - Spain (%)
Place of birth for the foreign-born population - Other Southern Europe (%)
Place of birth for the foreign-born population - Albania (%)
Place of birth for the foreign-born population - Belarus (%)
Place of birth for the foreign-born population - Bosnia and Herzegovina (%)
Place of birth for the foreign-born population - Bulgaria (%)
Place of birth for the foreign-born population - Croatia (%)
Place of birth for the foreign-born population - Czechoslovakia (%)
Place of birth for the foreign-born population - Hungary (%)
Place of birth for the foreign-born population - Latvia (%)
Place of birth for the foreign-born population - Lithuania (%)
Place of birth for the foreign-born population - North Macedonia (Macedonia) (%)
Place of birth for the foreign-born population - Moldova (%)
Place of birth for the foreign-born population - Poland (%)
Place of birth for the foreign-born population - Romania (%)
Place of birth for the foreign-born population - Russia (%)
Place of birth for the foreign-born population - Serbia (%)
Place of birth for the foreign-born population - Ukraine (%)
Place of birth for the foreign-born population - Other Eastern Europe (%)
Place of birth for the foreign-born population - China (%)
Place of birth for the foreign-born population - Hong Kong (%)
Place of birth for the foreign-born population - Taiwan (%)
Place of birth for the foreign-born population - Japan (%)
Place of birth for the foreign-born population - Korea (%)
Place of birth for the foreign-born population - Other Eastern Asia (%)
Place of birth for the foreign-born population - Afghanistan (%)
Place of birth for the foreign-born population - Bangladesh (%)
Place of birth for the foreign-born population - India (%)
Place of birth for the foreign-born population - Iran (%)
Place of birth for the foreign-born population - Kazakhstan (%)
Place of birth for the foreign-born population - Nepal (%)
Place of birth for the foreign-born population - Pakistan (%)
Place of birth for the foreign-born population - Sri Lanka (%)
Place of birth for the foreign-born population - Uzbekistan (%)
Place of birth for the foreign-born population - Other South Central Asia (%)
Place of birth for the foreign-born population - Burma (%)
Place of birth for the foreign-born population - Cambodia (%)
Place of birth for the foreign-born population - Indonesia (%)
Place of birth for the foreign-born population - Laos (%)
Place of birth for the foreign-born population - Malaysia (%)
Place of birth for the foreign-born population - Philippines (%)
Place of birth for the foreign-born population - Singapore (%)
Place of birth for the foreign-born population - Thailand (%)
Place of birth for the foreign-born population - Vietnam (%)
Place of birth for the foreign-born population - Other South Eastern Asia (%)
Place of birth for the foreign-born population - Armenia (%)
Place of birth for the foreign-born population - Iraq (%)
Place of birth for the foreign-born population - Israel (%)
Place of birth for the foreign-born population - Jordan (%)
Place of birth for the foreign-born population - Kuwait (%)
Place of birth for the foreign-born population - Lebanon (%)
Place of birth for the foreign-born population - Saudi Arabia (%)
Place of birth for the foreign-born population - Syria (%)
Place of birth for the foreign-born population - Turkey (%)
Place of birth for the foreign-born population - Yemen (%)
Place of birth for the foreign-born population - Other Western Asia (%)
Place of birth for the foreign-born population - Eritrea (%)
Place of birth for the foreign-born population - Ethiopia (%)
Place of birth for the foreign-born population - Kenya (%)
Place of birth for the foreign-born population - Somalia (%)
Place of birth for the foreign-born population - Uganda (%)
Place of birth for the foreign-born population - Zimbabwe (%)
Place of birth for the foreign-born population - Other Eastern Africa (%)
Place of birth for the foreign-born population - Cameroon (%)
Place of birth for the foreign-born population - Congo (%)
Place of birth for the foreign-born population - Democratic Republic of Congo (Zaire) (%)
Place of birth for the foreign-born population - Other Middle Africa (%)
Place of birth for the foreign-born population - Egypt (%)
Place of birth for the foreign-born population - Morocco (%)
Place of birth for the foreign-born population - Sudan (%)
Place of birth for the foreign-born population - Other Northern Africa (%)
Place of birth for the foreign-born population - South Africa (%)
Place of birth for the foreign-born population - Other Southern Africa (%)
Place of birth for the foreign-born population - Cabo Verde (%)
Place of birth for the foreign-born population - Ghana (%)
Place of birth for the foreign-born population - Liberia (%)
Place of birth for the foreign-born population - Nigeria (%)
Place of birth for the foreign-born population - Senegal (%)
Place of birth for the foreign-born population - Sierra Leone (%)
Place of birth for the foreign-born population - Other Western Africa (%)
Place of birth for the foreign-born population - Australia (%)
Place of birth for the foreign-born population - New Zealand (%)
Place of birth for the foreign-born population - Fiji (%)
Place of birth for the foreign-born population - Micronesia (%)
Place of birth for the foreign-born population - Bahamas (%)
Place of birth for the foreign-born population - Barbados (%)
Place of birth for the foreign-born population - Cuba (%)
Place of birth for the foreign-born population - Dominica (%)
Place of birth for the foreign-born population - Dominican Republic (%)
Place of birth for the foreign-born population - Grenada (%)
Place of birth for the foreign-born population - Haiti (%)
Place of birth for the foreign-born population - Jamaica (%)
Place of birth for the foreign-born population - St. Vincent and the Grenadines (%)
Place of birth for the foreign-born population - Trinidad and Tobago (%)
Place of birth for the foreign-born population - West Indies (%)
Place of birth for the foreign-born population - Other Caribbean (%)
Place of birth for the foreign-born population - Belize (%)
Place of birth for the foreign-born population - Costa Rica (%)
Place of birth for the foreign-born population - El Salvador (%)
Place of birth for the foreign-born population - Guatemala (%)
Place of birth for the foreign-born population - Honduras (%)
Place of birth for the foreign-born population - Mexico (%)
Place of birth for the foreign-born population - Nicaragua (%)
Place of birth for the foreign-born population - Panama (%)
Place of birth for the foreign-born population - Other Central America (%)
Place of birth for the foreign-born population - Argentina (%)
Place of birth for the foreign-born population - Bolivia (%)
Place of birth for the foreign-born population - Brazil (%)
Place of birth for the foreign-born population - Chile (%)
Place of birth for the foreign-born population - Colombia (%)
Place of birth for the foreign-born population - Ecuador (%)
Place of birth for the foreign-born population - Guyana (%)
Place of birth for the foreign-born population - Peru (%)
Place of birth for the foreign-born population - Uruguay (%)
Place of birth for the foreign-born population - Venezuela (%)
Place of birth for the foreign-born population - Other South America (%)
Place of birth for the foreign-born population - Canada (%)
Place of birth for the foreign-born population - Other Northern America (%)
Place of birth for the foreign-born population - Other (%)
Latest news about races in Columbus, OH collected exclusively by city-data.com from local newspapers, TV, and radio stations
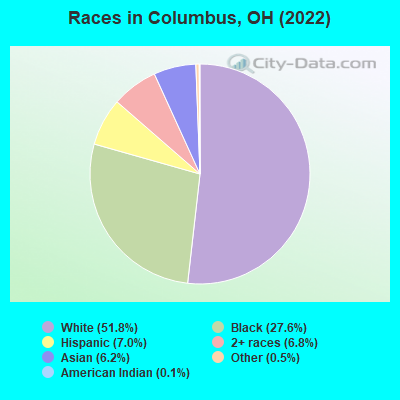
According to 2022 data, the most numerous races in Columbus, OH are White alone (470,314 residents), Black alone (250,371 residents), and Two or more races (62,166 residents). 81.9% of Columbus residents speak English at home. 14.3% of Columbus, OH residents are foreign-born (5.2% born in Africa, 4.8% born in Asia, 2.9% born in Latin America), which is 72.0% greater than the foreign-born rate of 4.0% across the entire state of Ohio.
Race distribution in Columbus
2000 2022
475,897 66.9% White alone 172,750 24.3% Black alone 24,386 3.4% Asian alone 17,471 2.5% Hispanic 16,958 2.4% Two or more races 1,824 0.3% Other race alone 1,858 0.3% American Indian alone 326 0.05% Native Hawaiian and Other
470,314 51.8% White alone 250,371 27.6% Black alone 63,432 7.0% Hispanic 62,166 6.8% Two or more races 56,317 6.2% Asian alone 4,290 0.5% Other race alone 1,064 0.1% American Indian alone 418 0.05% Native Hawaiian and Other
2000 2022
9,538,111 84.0% White alone 1,290,662 11.4% Black alone 217,123 1.9% Hispanic 137,770 1.2% Two or more races 131,670 1.2% Asian alone 21,985 0.2% American Indian alone 13,483 0.1% Other race alone 2,336 0.02% Native Hawaiian and Other
8,948,793 76.1% White alone 1,401,403 11.9% Black alone 529,291 4.5% Two or more races 517,232 4.4% Hispanic 293,387 2.5% Asian alone 52,805 0.4% Other race alone 9,785 0.08% American Indian alone 3,362 0.03% Native Hawaiian and Other
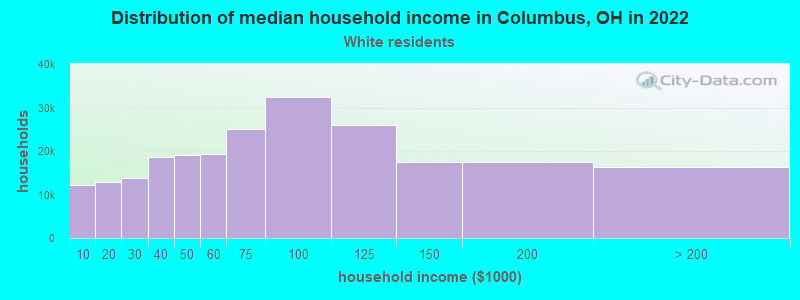
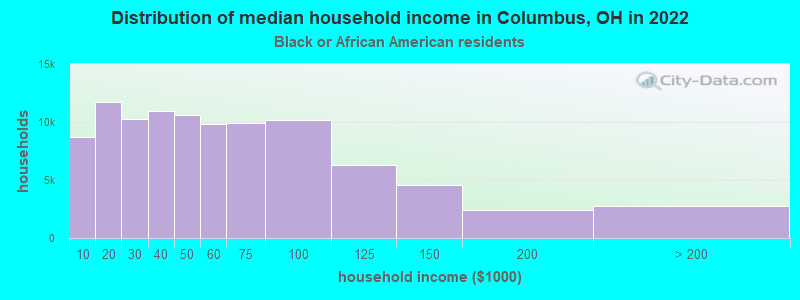
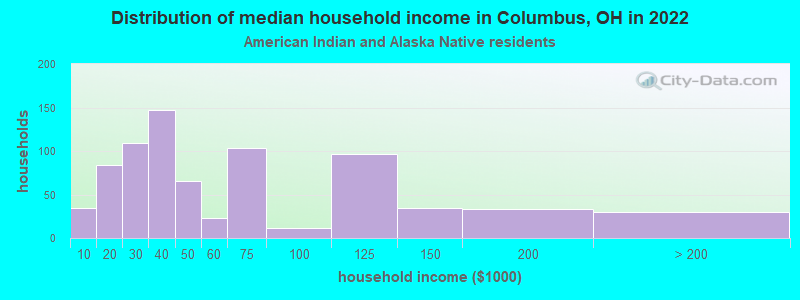
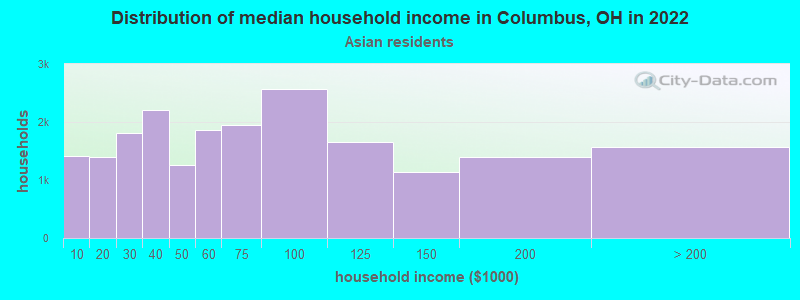
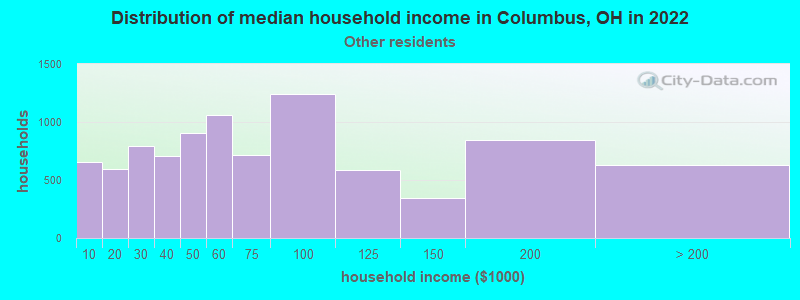
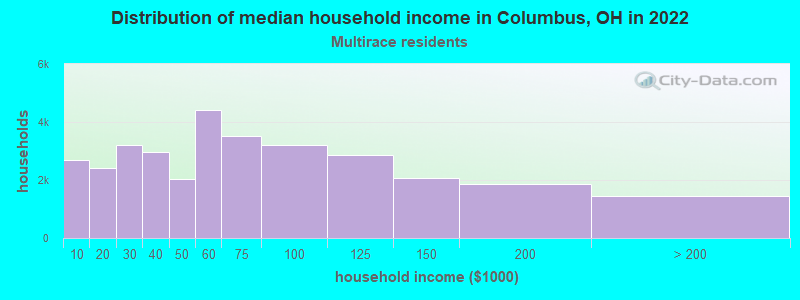
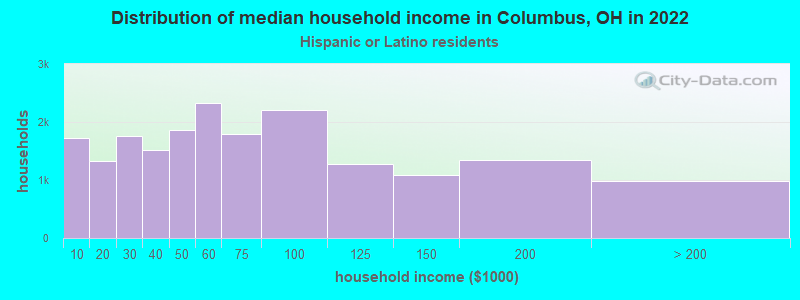
Income and house value in Columbus Median household income in 2022 $71,200 White non-Hispanic householders$46,893 Black householders$38,801 American Indian and Alaska Native householders$60,561 Asian householders$4,455 Native Hawaiian and other Pacific Islander householders$58,516 Some other race householders$56,521 Two or more races householders$54,890 Hispanic or Latino race householdersMedian 2022 house value $272,257 White Non-Hispanic householders$192,891 Black or African American householders$187,616 American Indian or Alaska Native householders $335,801 Asian householders$282,555 Native Hawaiian and other Pacific Islander householders$283,560 Some other race householders$235,588 Two or more races householders$272,006 Hispanic or Latino householders
Median age by race in Columbus
36.2 Median age for White residents35.7 36.8 30.8 Median age for Black or African American residents30.1 31.7 30.5 Median age for American Indian / Alaska Native residents29.9 30.7 31.9 Median age for Asian residents31.1 32.6 26.4 Median age for Native Hawaiian / Pacific Islander residents25.9 -666,666,666.0 27.7 Median age for Other race residents29.0 25.1 26.9 Median age for Two or more races residents27.9 26.8 36.4 Median age for White alone residents35.7 37.0 25.5 Median age for Hispanic or Latino residents27.1 24.4
Owner/renter occupied households by race in Columbus
House owners and renters - White residents 119,619 51.9% Owner occupied110,849 48.1% Renter occupiedHouse owners and renters - Black or African American residents 28,823 29.4% Owner occupied69,246 70.6% Renter occupiedHouse owners and renters - American Indian / Alaska Native residents 247 18.6% Owner occupied1,083 81.4% Renter occupiedHouse owners and renters - Asian residents 9,362 46.3% Owner occupied10,872 53.7% Renter occupiedHouse owners and renters - Native Hawaiian / Pacific Islander residents 30 28.2% Owner occupied77 71.8% Renter occupiedHouse owners and renters - Other race residents 2,642 29.1% Owner occupied6,435 70.9% Renter occupiedHouse owners and renters - Two or more races residents 9,439 28.9% Owner occupied23,231 71.1% Renter occupiedHouse owners and renters - White alone residents 118,563 52.1% Owner occupied109,162 47.9% Renter occupiedHouse owners and renters - Hispanic or Latino residents 5,254 27.4% Owner occupied13,933 72.6% Renter occupied
Language usage in Columbus
English speakers - Total 81.9% of residents of Columbus speak English at home.
5.2% of residents speak Spanish at home 23,019 51.8% Speak English very well21,454 48.2% Speak English less than very well12.9% of residents speak other language at home 66,750 60.8% Speak English very well43,106 39.2% Speak English less than very well
English speakers - Born in the United States 93.6% of residents of Columbus speak English at home.
3.3% of residents speak Spanish at home 5,409 83.3% Speak English very well1,088 16.7% Speak English less than very well3.1% of residents speak other language at home 5,637 91.6% Speak English very well515 8.4% Speak English less than very well
English speakers - Native, born elsewhere 60.9% of residents of Columbus speak English at home.
21.4% of residents speak Spanish at home 1,529 63.3% Speak English very well887 36.7% Speak English less than very well17.7% of residents speak other language at home 1,758 87.7% Speak English very well247 12.3% Speak English less than very well
English speakers - Foreign-born 14.4% of residents of Columbus speak English at home.
18.6% of residents speak Spanish at home 6,998 28.6% Speak English very well17,496 71.4% Speak English less than very well67.0% of residents speak other language at home 48,140 54.5% Speak English very well40,246 45.5% Speak English less than very well
White (Caucasian) - Speak only English Native:
98.1% (432,482)Foreign-born:
23.3% (3,601)
White (Caucasian) - Speak another language Native:
1.9% (8,490)Foreign-born:
76.7% (11,847)
Black or African American - Speak only English Native:
94.6% (170,638)Foreign-born:
20.2% (9,885)
Black or African American - Speak another language Native:
5.4% (9,733)Foreign-born:
79.8% (39,022)
American Indian / Alaska Native - Speak another language Native:
39.3% (1,288)Foreign-born:
100.0% (645)
Asian - Speak only English Native:
50.6% (6,716)Foreign-born:
9.2% (3,594)
Asian - Speak another language Native:
49.4% (6,548)Foreign-born:
90.8% (35,682)
Native Hawaiian / Pacific Islander - Speak only English Native:
73.5% (104)Foreign-born:
5.7% (6)
Native Hawaiian / Pacific Islander - Speak another language Native:
26.5% (37)Foreign-born:
94.9% (99)
Other race - Speak only English Native:
41.4% (5,688)Foreign-born:
0.5% (77)
Other race - Speak another language Native:
58.6% (8,065)Foreign-born:
99.5% (14,578)
Two or more races - Speak only English Native:
89.2% (59,669)Foreign-born:
14.2% (1,801)
Two or more races - Speak another language Native:
10.8% (7,245)Foreign-born:
85.8% (10,895)
White alone - Speak only English Native:
98.3% (428,627)Foreign-born:
24.2% (3,507)
White alone - Speak another language Native:
1.7% (7,371)Foreign-born:
75.8% (10,990)
Hispanic or Latino - Speak only English Native:
48.2% (15,186)Foreign-born:
4.2% (1,050)
Hispanic or Latino - Speak another language Native:
51.8% (16,304)Foreign-born:
95.8% (24,125)
Foreign-born residents in Columbus 129,227 residents are foreign born (5.2% Africa , 4.8% Asia , 2.9% Latin America ).
Marital status for residents in Columbus Marital status - White (Caucasian) population 15 years and over
Males 46.6% Never married39.5% Now married1.5% Separated3.0% Widowed9.5% DivorcedFemales 39.4% Never married37.5% Now married2.2% Separated6.4% Widowed14.5% DivorcedWomen who gave birth in the past 12 months Now married:
79.6% (4,767)Unmarried:
20.4% (1,225)
Women who did not give birth in the past 12 months Now married:
33.6% (42,425)Unmarried:
66.4% (83,864)
Marital status - Black or African American population 15 years and over
Males 56.1% Never married26.8% Now married1.1% Separated2.0% Widowed13.9% DivorcedFemales 49.8% Never married26.7% Now married3.1% Separated6.3% Widowed14.1% DivorcedWomen who gave birth in the past 12 months Now married:
63.3% (3,364)Unmarried:
36.7% (1,954)
Women who did not give birth in the past 12 months Now married:
24.9% (15,164)Unmarried:
75.1% (45,632)
Marital status - American Indian / Alaska Native population 15 years and over
Males 62.4% Never married33.0% Now married0.5% Separated1.5% Widowed2.6% DivorcedFemales 37.2% Never married51.0% Now married5.0% Separated3.7% Widowed3.0% DivorcedWomen who gave birth in the past 12 months Now married:
0.0% (0)Unmarried:
100.0% (33)
Women who did not give birth in the past 12 months Now married:
61.7% (301)Unmarried:
38.3% (187)
Marital status - Asian population 15 years and over
Males 44.9% Never married50.3% Now married0.3% Separated1.4% Widowed3.2% DivorcedFemales 35.1% Never married57.6% Now married0.2% Separated2.6% Widowed4.5% DivorcedWomen who gave birth in the past 12 months Now married:
96.3% (1,199)Unmarried:
3.7% (46)
Women who did not give birth in the past 12 months Now married:
53.0% (8,754)Unmarried:
47.0% (7,770)
Marital status - Native Hawaiian / Pacific Islander population 15 years and over
Males 62.0% Never married33.8% Now married0.0% Separated0.0% Widowed4.2% DivorcedFemales 39.3% Never married29.2% Now married0.0% Separated0.0% Widowed31.5% DivorcedWomen who did not give birth in the past 12 months Now married:
48.1% (27)Unmarried:
51.9% (29)
Marital status - Other race population 15 years and over
Males 48.8% Never married40.0% Now married1.9% Separated0.9% Widowed8.4% DivorcedFemales 42.2% Never married46.9% Now married3.0% Separated0.3% Widowed7.6% DivorcedWomen who gave birth in the past 12 months Now married:
40.8% (341)Unmarried:
59.2% (494)
Women who did not give birth in the past 12 months Now married:
46.9% (3,654)Unmarried:
53.1% (4,143)
Marital status - Two or more races population 15 years and over
Males 58.5% Never married29.3% Now married1.3% Separated1.8% Widowed9.1% DivorcedFemales 52.7% Never married25.7% Now married3.3% Separated3.5% Widowed14.9% DivorcedWomen who gave birth in the past 12 months Now married:
23.0% (137)Unmarried:
77.0% (459)
Women who did not give birth in the past 12 months Now married:
23.3% (5,762)Unmarried:
76.7% (18,991)
Marital status - White alone, not Hispanic / Latino population 15 years and over
Males 46.4% Never married39.7% Now married1.4% Separated2.9% Widowed9.6% DivorcedFemales 39.1% Never married37.7% Now married2.1% Separated6.5% Widowed14.6% DivorcedWomen who gave birth in the past 12 months Now married:
80.3% (4,677)Unmarried:
19.7% (1,144)
Women who did not give birth in the past 12 months Now married:
33.7% (41,881)Unmarried:
66.3% (82,343)
Marital status - Hispanic or Latino population 15 years and over
Males 54.3% Never married35.3% Now married2.0% Separated1.1% Widowed7.2% DivorcedFemales 46.5% Never married40.4% Now married3.2% Separated0.7% Widowed9.3% DivorcedWomen who gave birth in the past 12 months Now married:
43.7% (431)Unmarried:
56.3% (555)
Women who did not give birth in the past 12 months Now married:
39.4% (6,701)Unmarried:
60.6% (10,294)
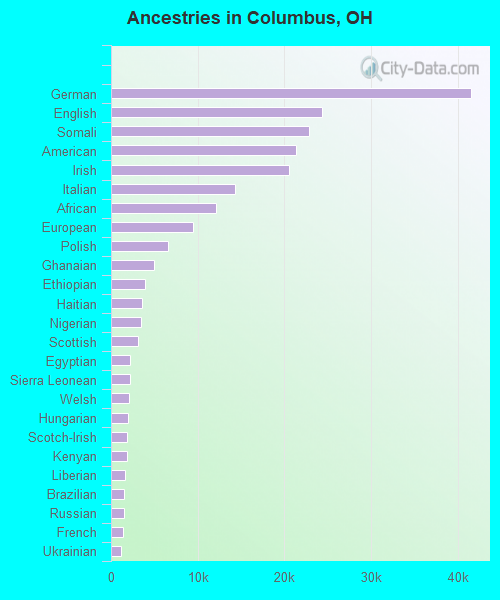
Ancestries in Columbus
41,541 8.4% German24,330 4.9% English22,858 4.6% Somali21,362 4.3% American20,543 4.2% Irish14,254 2.9% Italian12,158 2.5% African9,432 1.9% European6,543 1.3% Polish4,966 1.0% Ghanaian3,957 0.8% Ethiopian3,612 0.7% Haitian3,478 0.7% Nigerian3,062 0.6% Scottish2,225 0.5% Egyptian2,174 0.4% Sierra Leonean2,077 0.4% Welsh1,941 0.4% Hungarian1,855 0.4% Scotch-Irish1,846 0.4% Kenyan1,620 0.3% Liberian1,540 0.3% Brazilian1,475 0.3% Russian1,394 0.3% French1,188 0.2% Ukrainian1,137 0.2% Greek1,006 0.2% Lebanese953 0.2% Jordanian857 0.2% British831 0.2% Slovak795 0.2% Eastern European783 0.2% Jamaican769 0.2% Iraqi747 0.2% Turkish743 0.2% Dutch696 0.1% Afghan693 0.1% Norwegian655 0.1% Scandinavian632 0.1% Romanian631 0.1% Palestinian575 0.1% Moroccan503 0.1% Swedish483 0.10% Iranian471 0.10% Macedonian452 0.09% Arab442 0.09% Czech438 0.09% West Indian434 0.09% Sudanese416 0.08% Croatian378 0.08% Syrian374 0.08% Slovene357 0.07% Swiss307 0.06% Israeli301 0.06% Canadian287 0.06% Northern European266 0.05% Senegalese247 0.05% Lithuanian235 0.05% Bulgarian234 0.05% Austrian218 0.04% French Canadian208 0.04% Danish201 0.04% Portuguese194 0.04% Serbian193 0.04% Yugoslavian149 0.03% Czechoslovakian147 0.03% Trinidadian and Tobagonian121 0.02% Slavic118 0.02% Albanian92 0.02% Finnish90 0.02% Barbadian89 0.02% Pennsylvania German84 0.02% Armenian76 0.02% Belgian61 0.01% Belizean57 0.01% U.S. Virgin Islander42 0.01% Bahamian40 0.01% South African37 0.01% Maltese35 0.01% Ugandan35 0.01% Australian34 0.01% New Zealander32 0.01% Alsatian29 0.01% Bermudan
Geographical mobility in Columbus Same house 1 year ago 379,339 80.3% White (Caucasian)194,192 78.8% Black or African American1,750 72.1% American Indian / Alaska Native42,587 76.5% Asian133 54.3% Native Hawaiian / Pacific Islander23,828 76.5% Other race66,878 77.8% Two or more races374,753 80.4% White alone, not Hispanic / Latino47,211 76.5% Hispanic or LatinoMoved within same county 58,462 12.4% White / Caucasian36,843 15.0% Black or African American304 12.5% American Indian / Alaska Native6,672 12.0% Asian108 43.8% Native Hawaiian / Pacific Islander3,338 10.7% Other race11,023 12.8% Two or more races57,572 12.4% White alone, not Hispanic / Latino8,005 13.0% Hispanic or LatinoMoved within same state 20,355 4.3% White / Caucasian6,409 2.6% Black or African American33 1.3% American Indian / Alaska Native2,442 4.4% Asian489 1.6% Other race3,205 3.7% Two or more races19,911 4.3% White alone, not Hispanic / Latino1,222 2.0% Hispanic or LatinoMoved from different state 12,265 2.6% White / Caucasian6,022 2.4% Black or African American216 8.9% American Indian / Alaska Native1,207 2.2% Asian1,681 5.4% Other race2,560 3.0% Two or more races11,928 2.6% White alone, not Hispanic / Latino1,890 3.1% Hispanic or LatinoMoved from abroad 1,815 0.4% White2,909 1.2% Black or African American24 1.0% American Indian / Alaska Native2,728 4.9% Asian1,827 5.9% Other race2,309 2.7% Two or more races1,815 0.4% White alone, not Hispanic / Latino3,400 5.5% Hispanic or Latino
Children Nativity (place of birth) in Columbus
Children under 6 years - Living with two parents Both parents native 20,228 100.0% NativeBoth parents foreign-born 11,759 90.0% Native1,306 10.0% Foreign-bornOne native, one foreign-born parent 4,805 100.0% NativeChildren under 6 years - Living with one parent Native parent 20,443 100.0% NativeForeign-born parent 5,879 90.9% Native590 9.1% Foreign-bornChildren 6 to 17 years - Living with two parents Both parents native 29,750 100.0% NativeBoth parents foreign-born 16,107 68.9% Native7,274 31.1% Foreign-bornOne native, one foreign-born parent 3,383 96.4% Native125 3.6% Foreign-bornChildren 6 to 17 years - Living with one parent Native parent 41,412 100.0% NativeForeign-born parent 14,814 57.4% Native10,987 42.6% Foreign-born
Place of birth for residents in Columbus 47,666 Africa44,553 Asia28,537 Americas27,173 Latin America22,631 South Central Asia21,958 Eastern Africa17,195 Central America15,469 Western Africa10,707 Eastern Asia8,037 Europe7,480 China6,754 South Eastern Asia5,676 Caribbean4,344 Northern Africa4,301 South America4,300 Western Asia4,266 Eastern Europe2,307 Middle Africa1,648 Western Europe1,363 Northern America1,360 Northern Europe761 Southern Europe665 Southern Africa433 Oceania208 Australia and New Zealand Subregion12,945 India11,768 Somalia10,273 Mexico6,569 China5,908 Ghana4,153 Bhutan3,782 Ethiopia3,485 El Salvador3,309 Kenya2,725 Nepal2,645 Dominican Republic2,142 Sierra Leone2,113 Philippines1,909 Korea1,805 Honduras1,746 Vietnam1,681 Nigeria1,674 Liberia1,618 Haiti1,342 Canada1,300 Eritrea1,294 Venezuela1,291 Japan1,257 Algeria1,235 Cameroon1,174 Ukraine1,163 Morocco1,128 Laos1,101 Brazil1,087 Egypt1,024 Guatemala1,000 Iraq976 Senegal884 Pakistan872 Germany848 Russia836 Cambodia831 Jordan795 Colombia794 Democratic Republic of Congo (Zaire)620 Jamaica575 Taiwan571 Sudan556 Ecuador556 Syria549 England544 Bangladesh524 South Africa520 United Kingdom504 Saudi Arabia482 Iran448 North Macedonia (Macedonia)437 Tanzania430 Turkey397 Trinidad and Tobago382 Poland382 France359 Thailand335 Hong Kong321 Italy321 Afghanistan315 Panama310 Israel289 Romania287 Lebanon265 Uzbekistan250 Greece245 Netherlands244 Malaysia233 Zimbabwe229 Ivory Coast224 Congo190 Australia189 Peru183 Bulgaria170 Ireland155 Guyana153 Burma (Myanmar)145 Cuba144 Indonesia144 Uganda143 Spain139 Belarus132 Barbados124 Togo122 Czechoslovakia120 Kuwait115 Albania111 Argentina110 Sri Lanka105 United Arab Emirates104 Costa Rica104 Bosnia and Herzegovina99 Hungary93 Lithuania82 Scotland70 Belize65 Chile65 Switzerland62 Serbia55 Azerbaijan51 Bahamas48 Kazakhstan46 Austria43 Yemen38 Croatia35 Belgium35 Armenia27 Singapore25 Uruguay18 New Zealand18 Georgia16 Norway15 Nicaragua12 Latvia8 Portugal7 Denmark5 Bolivia4 Moldova
Grandparents responsible for own grandchildren in Columbus
Grandparents (30 to 59 years) White / Caucasian 1,339 53.4% Responsible for grandchildren1,168 46.6% Not responsible for grandchildrenBlack or African American 1,688 56.7% Responsible for grandchildren1,291 43.3% Not responsible for grandchildrenAmerican Indian / Alaska Native 17 100.0% Not responsible for grandchildrenAsian 60 17.7% Responsible for grandchildren278 82.3% Not responsible for grandchildrenOther race 122 24.1% Responsible for grandchildren385 75.9% Not responsible for grandchildrenTwo or more races 169 35.0% Responsible for grandchildren315 65.0% Not responsible for grandchildrenWhite alone, not Hispanic / Latino 1,339 53.4% Responsible for grandchildren1,168 46.6% Not responsible for grandchildrenHispanic or Latino 192 29.1% Responsible for grandchildren468 70.9% Not responsible for grandchildrenGrandparents (60 years and over) White / Caucasian 2,065 70.7% Responsible for grandchildren855 29.3% Not responsible for grandchildrenBlack or African American 453 26.0% Responsible for grandchildren1,286 74.0% Not responsible for grandchildrenAsian 125 13.1% Responsible for grandchildren829 86.9% Not responsible for grandchildrenOther race 11 6.8% Responsible for grandchildren148 93.2% Not responsible for grandchildrenTwo or more races 54 11.6% Responsible for grandchildren413 88.4% Not responsible for grandchildrenWhite alone, not Hispanic / Latino 2,065 70.7% Responsible for grandchildren855 29.3% Not responsible for grandchildrenHispanic or Latino 7 2.4% Responsible for grandchildren287 97.6% Not responsible for grandchildren
Zip codes: 43002 , 43004 , 43016 , 43017 , 43026 , 43035 , 43054 , 43065 , 43081 , 43082 , 43085 , 43119 , 43123 , 43137 , 43147 , 43201 , 43202 , 43203 , 43204 , 43205 , 43206 , 43207 , 43210 , 43211 , 43212 , 43213 , 43214 , 43215 , 43217 , 43219 , 43220 , 43221 , 43222 , 43223 , 43224 , 43227 , 43228 , 43229 , 43230 , 43231 , 43235 , 43240 .