Columbia, TN (Tennessee) Houses and Residents
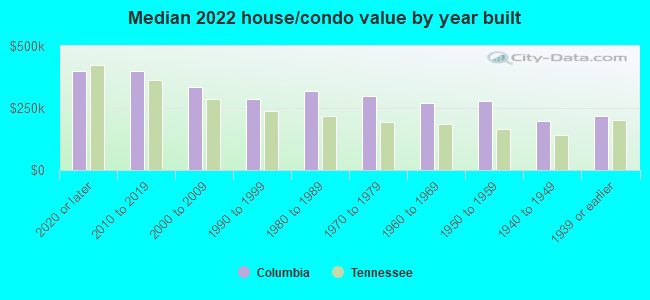
Estimated median house or condo value in 2022: $303,590 (it was $86,400 in 2000 )
Columbia:
$303,590Tennessee:
$284,800
Lower value quartile - upper value quartile: $215,489 - $422,594Total population: 36,071 (Urban population: 31,209 (all inside urban clusters), Rural population: 1,849 (102 farm, 1,747 nonfarm ))
Houses: 20,347 (18,190 occupied: 11,652 owner occupied, 6,573 renter occupied )
% of renters here:
36%State:
33%
Housing density: 687 houses/condos per square mile
Median price asked for vacant for-sale houses and condos in 2022: $472,156.
Median contract rent in 2022: $900 (lower quartile is $752, upper quartile is $1,189)
Median rent asked for vacant for-rent units in 2022: $972
Median gross rent in Columbia, TN in 2022: $1,083
Housing units in Columbia with a mortgage: 7,386 (515 second mortgage, 0 home equity loan, 354 both second mortgage and home equity loan )Houses without a mortgage: 211
Median household income for houses/condos with a mortgage: $81,308
Median household income for apartments without a mortgage: $53,400
Median monthly housing costs: $1,035
Data:
Median house or condo value ($)
Median house or condo value ($ change since 2000)
Median house or condo value ($) - White
Median house or condo value ($) - Black or African American
Median house or condo value ($) - Asian
Median house or condo value ($) - Hispanic or Latino
Median house or condo value ($) - American Indian and Alaska Native
Median house or condo value ($) - Multirace
Median house or condo value ($) - Other Race
Median price asked for mobile homes ($)
Household density (households per square mile)
Mean house or condo value by units in structure - 1, detached ($)
Mean house or condo value by units in structure - 1, attached ($)
Mean house or condo value by units in structure - 2 ($)
Mean house or condo value by units in structure by units in structure - 3 or 4 ($)
Mean house or condo value by units in structure - 5 or more ($)
Mean house or condo value by units in structure - Boat, RV, van, etc. ($)
Mean house or condo value by units in structure - Mobile home ($)
Median contract rent ($)
Median contract rent - Lower quartile ($)
Median contract rent - Upper quartile ($)
Median gross rent ($)
Urban houses (%)
Rural houses (%)
Houses occupied (%)
Houses occupied (% change since 2000)
Houses owner occupied (%)
Houses owner occupied (% change since 2000)
Houses renter occupied (%)
Houses renter occupied (% change since 2000)
Vacant housing units - For rent (%)
Vacant housing units - For rent (% change since 2000)
Vacant housing units - For sale only (%)
Vacant housing units - For sale only (% change since 2000)
Vacant housing units - Rented or sold, not occupied (%)
Vacant housing units - Rented or sold, not occupied (% change since 2000)
Vacant housing units - For seasonal, recreational, or occasional use (%)
Vacant housing units - For seasonal, recreational, or occasional use (% change since 2000)
Vacant housing units - For migrant workers (%)
Vacant housing units - For migrant workers (% change since 2000)
Vacant housing units - Other vacant (%)
Vacant housing units - Other vacant (% change since 2000)
Median monthly housing costs ($)
Median household income for houses/condos with a mortgage ($)
Median household income for houses/condos without a mortgage ($)
Median household income ($)
Median household income ($) - White
Median household income ($) - Black or African American
Median household income ($) - Asian
Median household income ($) - Hispanic or Latino
Median household income ($) - American Indian and Alaska Native
Median household income ($) - Multirace
Median household income ($) - Other Race
Mortgage status - with mortgage (%)
Mortgage status - with second mortgage (%)
Mortgage status - with home equity loan (%)
Mortgage status - with both second mortgage and home equity loan (%)
Mortgage status - without a mortgage (%)
Median year house/condo built
Median year apartment built
Household type by relationship - Male householder living alone (%)
Household type by relationship - Male householder not living alone (%)
Household type by relationship - Female householder living alone (%)
Household type by relationship - Female householder not living alone (%)
Household type by relationship - Opposite-Sex spouse (%)
Household type by relationship - Same-Sex spouse (%)
Household type by relationship - Opposite-Sex unmarried partner (%)
Household type by relationship - Same-Sex unmarried partner (%)
Household type by relationship - In group quarters (%)
Size of family households - 2-person household (%)
Size of family households - 3-person household (%)
Size of family households - 4-person household (%)
Size of family households - 5-person household (%)
Size of family households - 6-person household (%)
Size of family households - 7-or-more-person household (%)
Size of nonfamily households - 1-person household (%)
Size of nonfamily households - 2-person household (%)
Size of nonfamily households - 3-person household (%)
Size of nonfamily households - 4-person household (%)
Size of nonfamily households - 5-person household (%)
Size of nonfamily households - 6-person household (%)
Size of nonfamily households - 7-or-moreperson household (%)
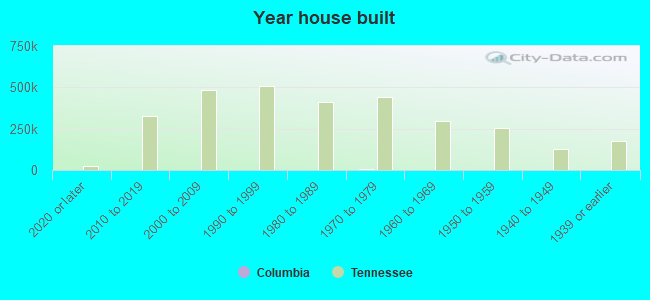
Year house built - Built 2010 or later (%)
Year house built - Built 2000 to 2009 (%)
Year house built - Built 1990 to 1999 (%)
Year house built - Built 1980 to 1989 (%)
Year house built - Built 1970 to 1979 (%)
Year house built - Built 1960 to 1969 (%)
Year house built - Built 1950 to 1959 (%)
Year house built - Built 1940 to 1949 (%)
Year house built - Built 1939 or earlier (%)
Median number of rooms in houses and condos
Median number of rooms in apartments
Median number of bedrooms in owner occupied houses
Mean number of bedrooms in owner occupied houses
Median number of bedrooms in renter occupied houses
Mean number of bedrooms in renter occupied houses
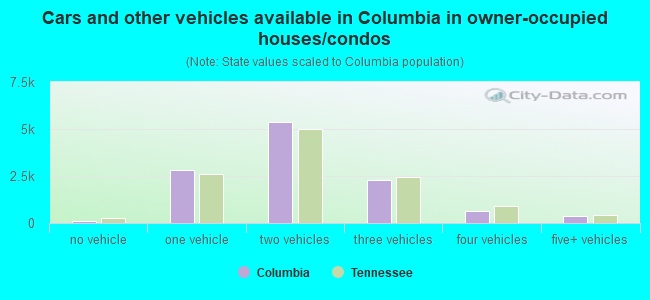
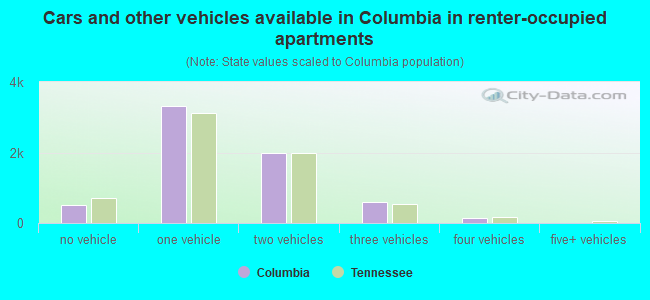
Median number of vehichles in owner occupied houses
Mean number of vehichles in owner occupied houses
Median number of vehichles in renter occupied houses
Mean number of vehichles in renter occupied houses
Rooms in owner-occupied houses - 1 room (%)
Rooms in owner-occupied houses - 2 rooms (%)
Rooms in owner-occupied houses - 3 rooms (%)
Rooms in owner-occupied houses - 4 rooms (%)
Rooms in owner-occupied houses - 5 rooms (%)
Rooms in owner-occupied houses - 6 rooms (%)
Rooms in owner-occupied houses - 7 rooms (%)
Rooms in owner-occupied houses - 8 rooms (%)
Rooms in owner-occupied houses - 9+ rooms (%)
Rooms in renter-occupied houses - 1 room (%)
Rooms in renter-occupied houses - 2 rooms (%)
Rooms in renter-occupied houses - 3 rooms (%)
Rooms in renter-occupied houses - 4 rooms (%)
Rooms in renter-occupied houses - 5 rooms (%)
Rooms in renter-occupied houses - 6 rooms (%)
Rooms in renter-occupied houses - 7 rooms (%)
Rooms in renter-occupied houses - 8 rooms (%)
Rooms in renter-occupied houses - 9+ rooms (%)
Bedrooms in owner-occupied houses - no bedrooms (%)
Bedrooms in owner-occupied houses - 1 bedroom (%)
Bedrooms in owner-occupied houses - 2 bedrooms (%)
Bedrooms in owner-occupied houses - 3 bedrooms (%)
Bedrooms in owner-occupied houses - 4 bedrooms (%)
Bedrooms in owner-occupied houses - 5+ bedrooms (%)
Bedrooms in renter-occupied houses - no bedrooms (%)
Bedrooms in renter-occupied houses - 1 bedroom (%)
Bedrooms in renter-occupied houses - 2 bedrooms (%)
Bedrooms in renter-occupied houses - 3 bedrooms (%)
Bedrooms in renter-occupied houses - 4 bedrooms (%)
Bedrooms in renter-occupied houses - 5+ bedrooms (%)
Vehicles available in owner-occupied houses - no vehicle available (%)
Vehicles available in owner-occupied houses - 1 vehicle available(%)
Vehicles available in owner-occupied houses - 2 Vehicles available (%)
Vehicles available in owner-occupied houses - 3 Vehicles available (%)
Vehicles available in owner-occupied houses - 4 Vehicles available (%)
Vehicles available in owner-occupied houses - 5+ Vehicles available (%)
Vehicles available in renter-occupied houses - no vehicle available (%)
Vehicles available in renter-occupied houses - 1 vehicle available (%)
Vehicles available in renter-occupied houses - 2 Vehicles available (%)
Vehicles available in renter-occupied houses - 3 Vehicles available (%)
Vehicles available in renter-occupied houses - 4 Vehicles available (%)
Vehicles available in renter-occupied houses - 5+ Vehicles available (%)
Housing units in structures - 1, detached (%)
Housing units in structures - 1, attached (%)
Housing units in structures - 2 (%)
Housing units in structures - 3 or 4 (%)
Housing units in structures - 5 to 9 (%)
Housing units in structures - 10 to 19 (%)
Housing units in structures - 20 to 49 (%)
Housing units in structures - 50 or more (%)
Housing units in structures - Mobile home (%)
Housing units in structures - Boat, RV, van, etc. (%)
Housing units in structures - Owners - 1, detached (%)
Housing units in structures - Owners - 1, attached (%)
Housing units in structures - Owners - 2 (%)
Housing units in structures - Owners - 3 or 4 (%)
Housing units in structures - Owners - 5 to 9 (%)
Housing units in structures - Owners - 10 to 19 (%)
Housing units in structures - Owners - 20 to 49 (%)
Housing units in structures - Owners - 50 or more (%)
Housing units in structures - Owners - Mobile home (%)
Housing units in structures - Owners - Boat, RV, van, etc. (%)
Housing units in structures - Renters - 1, detached (%)
Housing units in structures - Renters - 1, attached (%)
Housing units in structures - Renters - 2 (%)
Housing units in structures - Renters - 3 or 4 (%)
Housing units in structures - Renters - 5 to 9 (%)
Housing units in structures - Renters - 10 to 19 (%)
Housing units in structures - Renters - 20 to 49 (%)
Housing units in structures - Renters - 50 or more (%)
Housing units in structures - Renters - Mobile home (%)
Housing units in structures - Renters - Boat, RV, van, etc. (%)
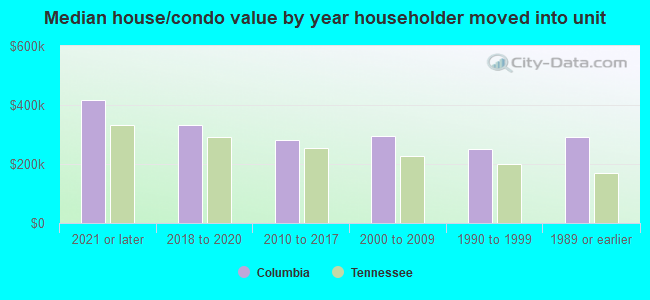
House/condo owner moved in on average (years ago)
Renter moved in on average (years ago)
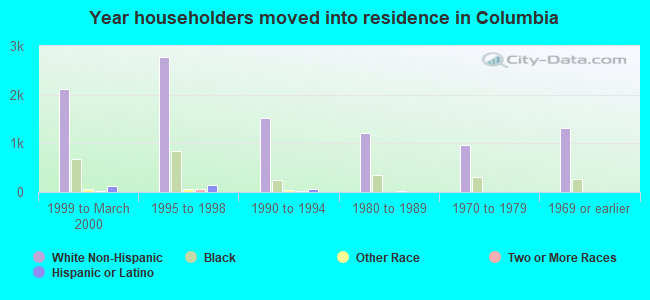
Year householder moved into unit - Moved in 1999 to March 2000 (%)
Year householder moved into unit - Moved in 1999 to March 2000 (%) - White
Year householder moved into unit - Moved in 1999 to March 2000 (%) - Black or African American
Year householder moved into unit - Moved in 1999 to March 2000 (%) - Asian
Year householder moved into unit - Moved in 1999 to March 2000 (%) - Hispanic or Latino
Year householder moved into unit - Moved in 1999 to March 2000 (%) - American Indian and Alaska Native
Year householder moved into unit - Moved in 1999 to March 2000 (%) - Multirace
Year householder moved into unit - Moved in 1999 to March 2000 (%) - Other Race
Year householder moved into unit - Moved in 1995 to 1998 (%)
Year householder moved into unit - Moved in 1995 to 1998 (%) - White
Year householder moved into unit - Moved in 1995 to 1998 (%) - Black or African American
Year householder moved into unit - Moved in 1995 to 1998 (%) - Asian
Year householder moved into unit - Moved in 1995 to 1998 (%) - Hispanic or Latino
Year householder moved into unit - Moved in 1995 to 1998 (%) - American Indian and Alaska Native
Year householder moved into unit - Moved in 1995 to 1998 (%) - Multirace
Year householder moved into unit - Moved in 1995 to 1998 (%) - Other Race
Year householder moved into unit - Moved in 1990 to 1994 (%)
Year householder moved into unit - Moved in 1990 to 1994 (%) - White
Year householder moved into unit - Moved in 1990 to 1994 (%) - Black or African American
Year householder moved into unit - Moved in 1990 to 1994 (%) - Asian
Year householder moved into unit - Moved in 1990 to 1994 (%) - Hispanic or Latino
Year householder moved into unit - Moved in 1990 to 1994 (%) - American Indian and Alaska Native
Year householder moved into unit - Moved in 1990 to 1994 (%) - Multirace
Year householder moved into unit - Moved in 1990 to 1994 (%) - Other Race
Year householder moved into unit - Moved in 1980 to 1989 (%)
Year householder moved into unit - Moved in 1980 to 1989 (%) - White
Year householder moved into unit - Moved in 1980 to 1989 (%) - Black or African American
Year householder moved into unit - Moved in 1980 to 1989 (%) - Asian
Year householder moved into unit - Moved in 1980 to 1989 (%) - Hispanic or Latino
Year householder moved into unit - Moved in 1980 to 1989 (%) - American Indian and Alaska Native
Year householder moved into unit - Moved in 1980 to 1989 (%) - Multirace
Year householder moved into unit - Moved in 1980 to 1989 (%) - Other Race
Year householder moved into unit - Moved in 1970 to 1979 (%)
Year householder moved into unit - Moved in 1970 to 1979 (%) - White
Year householder moved into unit - Moved in 1970 to 1979 (%) - Black or African American
Year householder moved into unit - Moved in 1970 to 1979 (%) - Asian
Year householder moved into unit - Moved in 1970 to 1979 (%) - Hispanic or Latino
Year householder moved into unit - Moved in 1970 to 1979 (%) - American Indian and Alaska Native
Year householder moved into unit - Moved in 1970 to 1979 (%) - Multirace
Year householder moved into unit - Moved in 1970 to 1979 (%) - Other Race
Year householder moved into unit - Moved in 1969 or earlier (%)
Year householder moved into unit - Moved in 1969 or earlier (%) - White
Year householder moved into unit - Moved in 1969 or earlier (%) - Black or African American
Year householder moved into unit - Moved in 1969 or earlier (%) - Asian
Year householder moved into unit - Moved in 1969 or earlier (%) - Hispanic or Latino
Year householder moved into unit - Moved in 1969 or earlier (%) - American Indian and Alaska Native
Year householder moved into unit - Moved in 1969 or earlier (%) - Multirace
Year householder moved into unit - Moved in 1969 or earlier (%) - Other Race
Housing units lacking complete plumbing facilities (%)
Housing units lacking complete kitchen facilities (%)
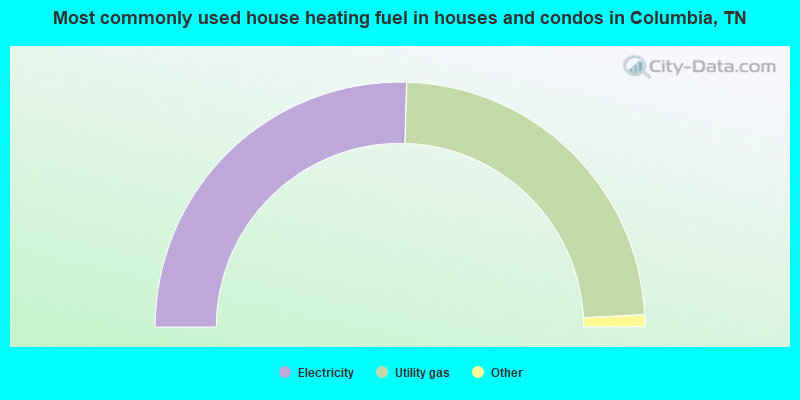
House heating fuel used in houses and condos - Utility gas (%)
House heating fuel used in houses and condos - Bottled, tank, or LP gas (%)
House heating fuel used in houses and condos - Electricity (%)
House heating fuel used in houses and condos - Fuel oil, kerosene, etc. (%)
House heating fuel used in houses and condos - Coal or coke (%)
House heating fuel used in houses and condos - Wood (%)
House heating fuel used in houses and condos - Solar energy (%)
House heating fuel used in houses and condos - Other fuel (%)
House heating fuel used in houses and condos - No fuel used (%)
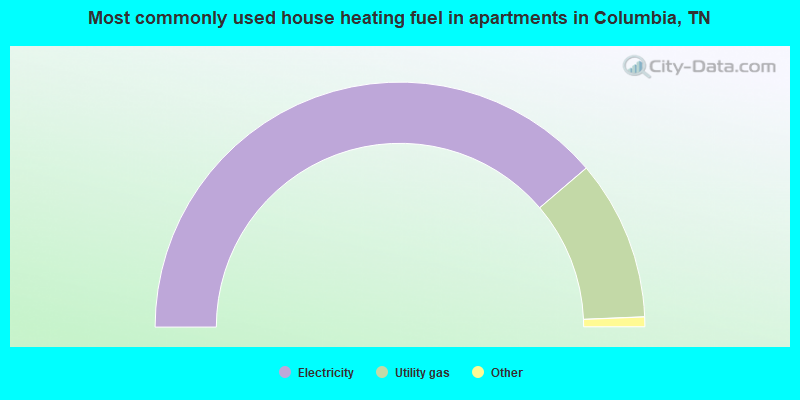
House heating fuel used in apartments - Utility gas (%)
House heating fuel used in apartments - Bottled, tank, or LP gas (%)
House heating fuel used in apartments - Electricity (%)
House heating fuel used in apartments - Fuel oil, kerosene, etc. (%)
House heating fuel used in apartments - Coal or coke (%)
House heating fuel used in apartments - Wood (%)
House heating fuel used in apartments - Solar energy (%)
House heating fuel used in apartments - Other fuel (%)
House heating fuel used in apartments - No fuel used (%)
Latest news about housing in Columbia, TN collected exclusively by city-data.com from local newspapers, TV, and radio stations
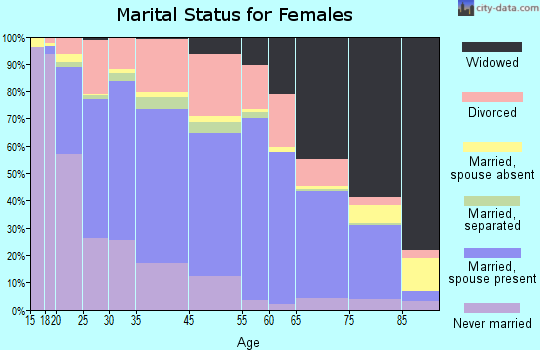
Median year house/condo built: 1983Median year apartment built: 1976Household type by relationship:
Households: 45,037
Male householders: 8,104 (2,066 living alone ), Female householders: 9,965 (3,364 living alone )7,122 spouses (7,122 opposite-sex spouses ), 1,359 unmarried partners , (1,343 opposite-sex unmarried partners ), 13,513 children (12,264 natural , 290 adopted , 958 stepchildren ), 1,136 grandchildren , 528 brothers or sisters , 684 parents , 0 foster children , 553 other relatives , 1,009 non-relatives In group quarters: 1,060
Size of family households: 4,604 2-persons , 2,810 3-persons , 1,951 4-persons , 1,540 5-persons , 162 6-persons , 262 7-or-more-persons .
Size of nonfamily households: 5,883 1-person , 1,244 2-persons , 167 3-persons , 37 4-persons .
5,019 married couples with children. single-parent households (775 men , 2,995 women ).
92.9% of residents of Columbia speak English at home. of residents speak Spanish at home (76% speak English very well , 10% speak English well , 8% speak English not well , 6% don't speak English at all ).of residents speak other Indo-European language at home (91% speak English very well , 9% speak English well ).of residents speak Asian or Pacific Island language at home (16% speak English very well , 33% speak English well , 21% speak English not well , 31% don't speak English at all ).of residents speak other language at home (67% speak English very well , 33% speak English well ).
Foreign born population: 1,470 (3.3%)of them are naturalized citizens )
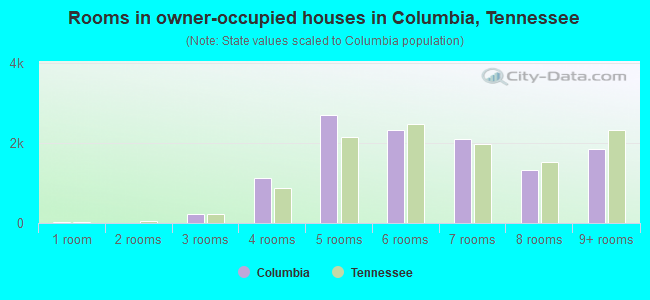
Median number of rooms in houses and condos:
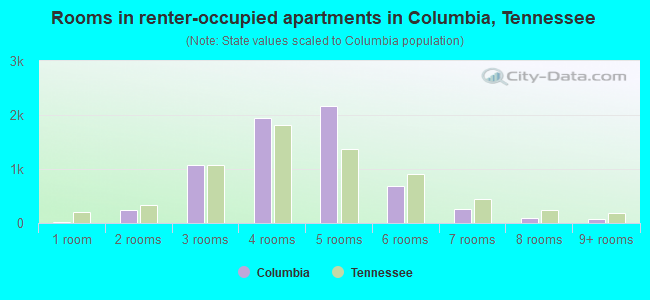
Median number of rooms in apartments
Owner-occupied Renter-occupied
Rooms in owner-occupied houses in Columbia, Tennessee
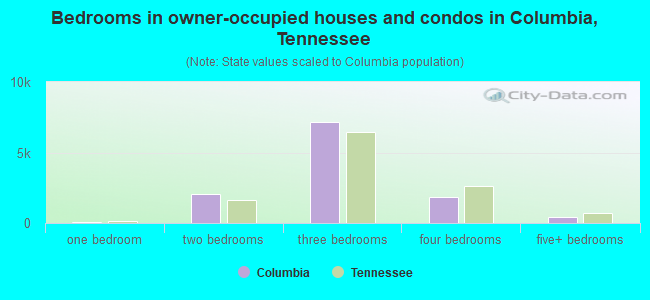
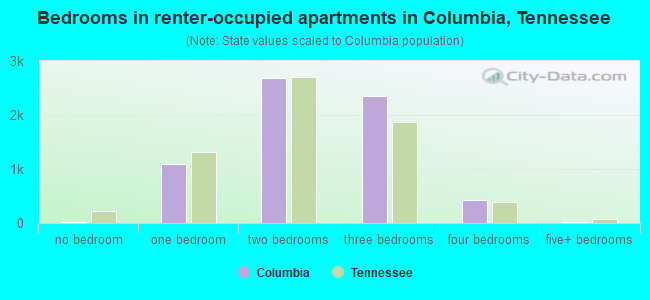
31 1 room 0 2 rooms 237 3 rooms 1,114 4 rooms 2,699 5 rooms 2,314 6 rooms 2,092 7 rooms 1,319 8 rooms 1,845 9+ rooms
Rooms in renter-occupied apartments in Columbia, Tennessee
25 1 room 250 2 rooms 1,068 3 rooms 1,936 4 rooms 2,161 5 rooms 688 6 rooms 266 7 rooms 98 8 rooms 80 9+ rooms
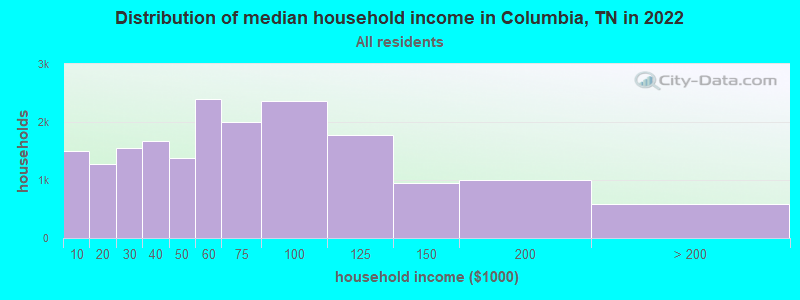
Columbia, TN household income distribution 1,497 Less than $10,0001,276 $10,000 to $19,9991,551 $20,000 to $29,9991,675 $30,000 to $39,9991,387 $40,000 to $49,9992,399 $50,000 to $59,9992,003 $60,000 to $74,9992,363 $75,000 to $99,9991,776 $100,000 to $124,999943 $125,000 to $149,999997 $150,000 to $199,999578 $200,000 or more
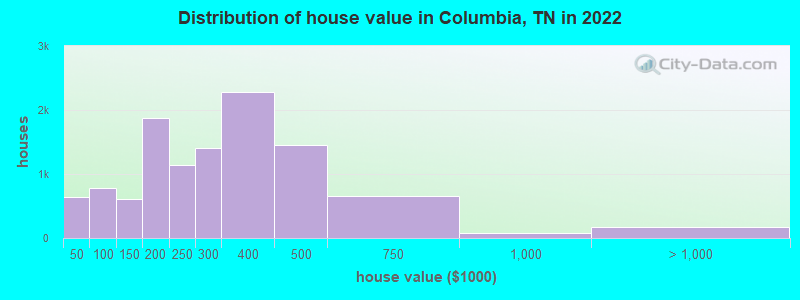
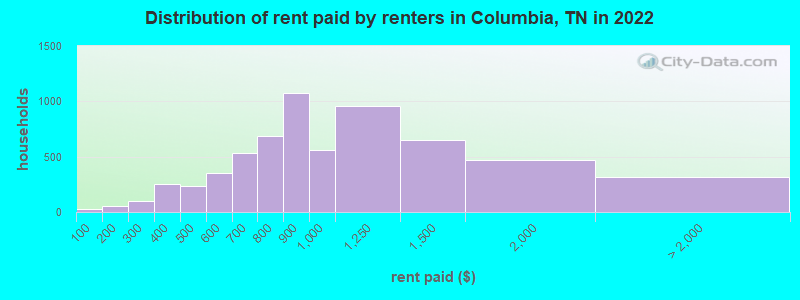
Home value of owner - occupied houses in 2022 in Columbia, TN 124 Less than $10,00027 $15,000 to $19,99981 $20,000 to $24,9994 $25,000 to $29,999128 $30,000 to $34,99946 $35,000 to $39,999223 $40,000 to $49,999132 $50,000 to $59,999122 $60,000 to $69,99973 $70,000 to $79,99981 $80,000 to $89,999151 $90,000 to $99,999209 $100,000 to $124,999394 $125,000 to $149,9991,050 $150,000 to $174,999823 $175,000 to $199,9991,143 $200,000 to $249,9991,413 $250,000 to $299,9992,283 $300,000 to $399,9991,447 $400,000 to $499,999659 $500,000 to $749,99981 $750,000 to $999,99914 $1,000,000 to $1,499,999163 $1,500,000 to $1,999,999Rent paid by renters in 2022 in Columbia, TN 29 Less than $10013 $100 to $14939 $150 to $19934 $200 to $24963 $250 to $299143 $300 to $349107 $350 to $399132 $400 to $449101 $450 to $499200 $500 to $549152 $550 to $599203 $600 to $649327 $650 to $699460 $700 to $749230 $750 to $7991,077 $800 to $899561 $900 to $999961 $1,000 to $1,249650 $1,250 to $1,499469 $1,500 to $1,999100 $2,000 to $2,499214 No cash rent
Percentage of workers working in this county: 74.4%Number of people working at home: 2,830 (13.4% of all workers )
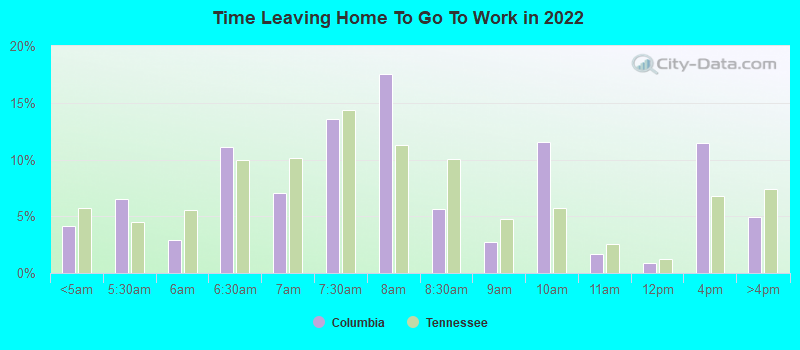
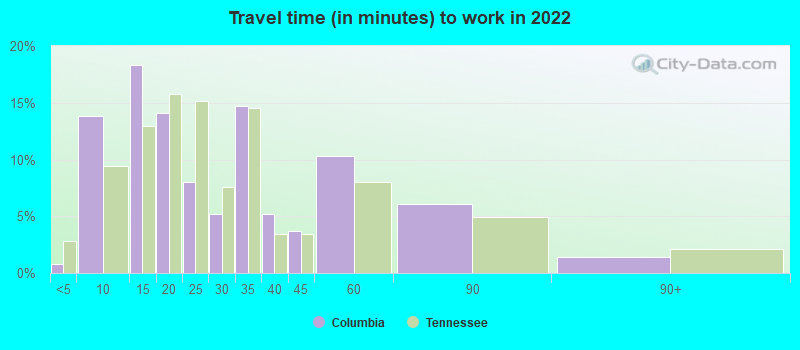
Travel time to work (commute)
Less than 5 minutes: 2115 to 9 minutes: 2,88410 to 14 minutes: 4,26115 to 19 minutes: 2,86220 to 24 minutes: 1,48525 to 29 minutes: 93930 to 34 minutes: 2,82335 to 39 minutes: 69140 to 44 minutes: 64545 to 59 minutes: 1,52660 to 89 minutes: 1,60990 or more minutes: 282
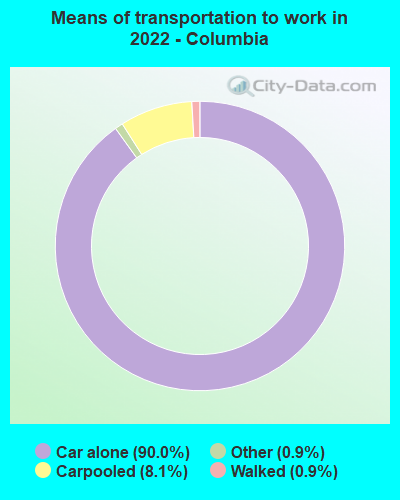
Means of transportation to work:
Drove a car alone: 21,178 (79.2%)Carpooled: 2,004 (7.5%)Bus : 13 (0.0%)Taxi: 259 (1.0%)Walked: 230 (0.9%)Worked at home: 2,830 (10.6%)
Unemployment by race in 2022
Unemployment rate for White non-Hispanic residents 2.4% Males2.7% FemalesUnemployment rate for Black residents 0.8% Males0.1% FemalesUnemployment rate for other race residents 16.8% MalesUnemployment rate for two or more race residents 1.7% Males4.8% FemalesUnemployment rate for Hispanic or Latino residents 1.2% Males4.2% Females
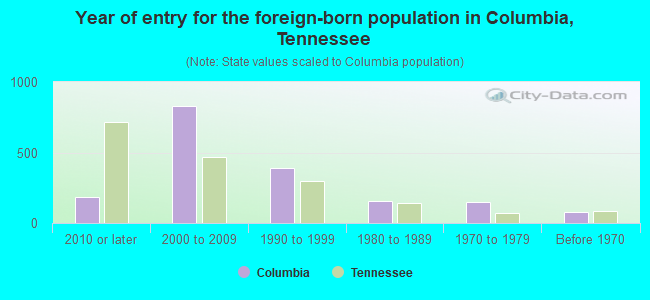
Year of entry for the foreign-born population in Columbia, Tennessee
182 2010 or later 828 2000 to 2009 392 1990 to 1999 153 1980 to 1989 148 1970 to 1979 79 Before 1970
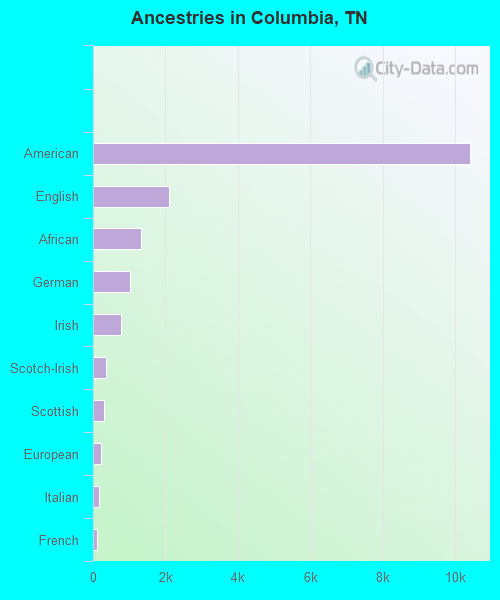
First ancestries reported:
American: 10,415 (39.7%)
English: 2,093 (8.0%)
African: 1,334 (5.1%)
German: 1,027 (3.9%)
Irish: 765 (2.9%)
Scotch-Irish: 349 (1.3%)
Scottish: 314 (1.2%)
European: 227 (0.9%)
Italian: 176 (0.7%)
French: 98 (0.4%)
Scandinavian: 85 (0.3%)
Jamaican: 77 (0.3%)
French Canadian: 49 (0.2%)
Dutch: 35 (0.1%)
Polish: 31 (0.1%)
British: 29 (0.1%)
Canadian: 29 (0.1%)
Norwegian: 28 (0.1%)
Ukrainian: 28 (0.1%)
Hungarian: 26 (0.10%)
Egyptian: 22 (0.08%)
Lebanese: 22 (0.08%)
Danish: 17 (0.06%)
Portuguese: 11 (0.04%)
Swedish: 9 (0.03%)
Slovak: 8 (0.03%)
Welsh: 7 (0.03%) Most common places of birth for foreign-born residents (%): Mexico Columbia:
47.5% (765)Tennessee:
23.0% (86,435)
Venezuela Columbia:
7.8% (125)Tennessee:
1.6% (5,936)
Colombia Columbia:
4.6% (74)Tennessee:
1.0% (3,879)
Jamaica Columbia:
4.4% (71)Tennessee:
0.6% (2,405)
China, excluding Hong Kong and Taiwan Columbia:
4.3% (70)Tennessee:
3.3% (12,582)
Canada Columbia:
3.8% (62)Tennessee:
2.7% (10,295)
Germany Columbia:
3.5% (57)Tennessee:
2.2% (8,261)
Panama Columbia:
3.4% (55)Tennessee:
0.3% (1,008)
Dominican Republic Columbia:
2.7% (44)Tennessee:
0.5% (1,963)
Egypt Columbia:
1.9% (31)Tennessee:
3.1% (11,761)
Place of birth for U.S.-born residents:
This state: 27,323Other state: 15,761Northeast: 1,846Midwest: 5,002South: 6,219West: 2,594 89.3% of Columbia residents lived in the same house 1 years ago.
Out of people who lived in different houses, 23.7% lived in this county.
Out of people who lived in different counties, 80.4% lived in Tennessee.
Columbia:
89.3%State average:
87.0%
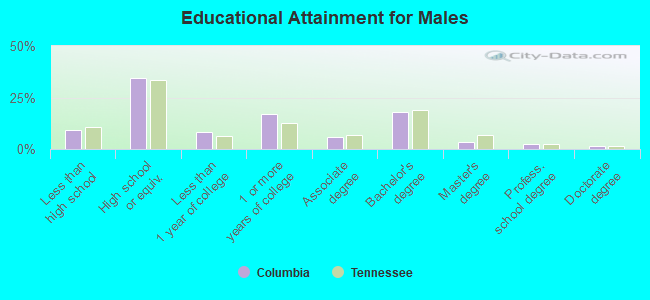
Education attainment for males 25 years and older:
No schooling: 194Nursery to 4th grade: 15th and 6th grade: 1527th and 8th grade: 669th grade: 7710th grade: 7011th grade: 26912th grade, no diploma: 468High school graduate (or equivalency): 4,746Less than 1 year of college: 1,106Some college more than 1 year, no degree: 2,334Associate degree: 825Bachelor's degree: 2,455Master's degree: 461Professional school degree: 306Doctorate degree: 196
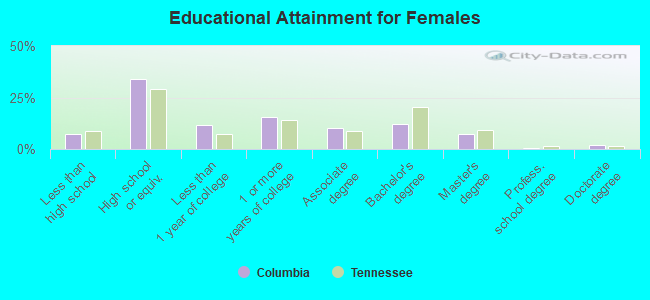
Education attainment for females 25 years and older:
No schooling: 245Nursery to 4th grade: 275th and 6th grade: 2027th and 8th grade: 929th grade: 15610th grade: 23711th grade: 14112th grade, no diploma: 105High school graduate (or equivalency): 5,638Less than 1 year of college: 1,946Some college more than 1 year, no degree: 2,572Associate degree: 1,654Bachelor's degree: 2,005Master's degree: 1,171Professional school degree: 117Doctorate degree: 285
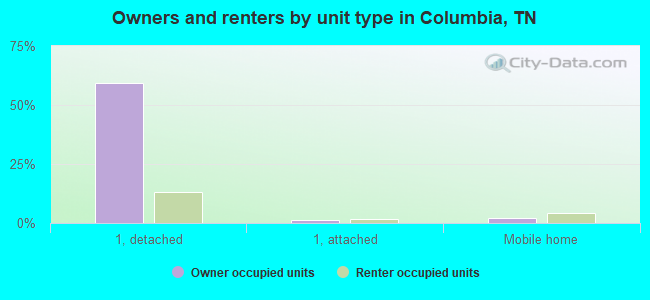
Housing units in structures:
One, detached: 14,440One, attached: 486Two: 1,1523 or 4: 8985 to 9: 1,15110 to 19: 51420 to 49: 12850 or more: 84Mobile homes: 1,463Boats, RVs, vans, etc.: 25Housing units lacking complete plumbing facilities in 2022: 1.6%Housing units lacking complete kitchen facilities in 2022: 2.5%House/condo owner moved in on average 7 years ago
Renter moved in on average 3 years ago
Private vs. public school enrollment:
Students in private schools in grades 1 to 8 (elementary and middle school): 603 Here:
11.4%Tennessee:
15.0%
Students in private schools in grades 9 to 12 (high school): 148 Students in private undergraduate colleges: 308 Here:
24.0%Tennessee:
23.5%