Races in Columbia, Tennessee (TN) Detailed Stats
Data:
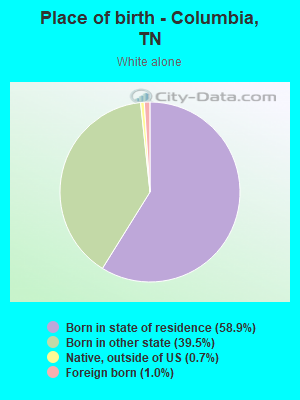
Races - White alone (%)
Races - White alone (% change since 2000)
Races - Black alone (%)
Races - Black alone (% change since 2000)
Races - American Indian alone (%)
Races - American Indian alone (% change since 2000)
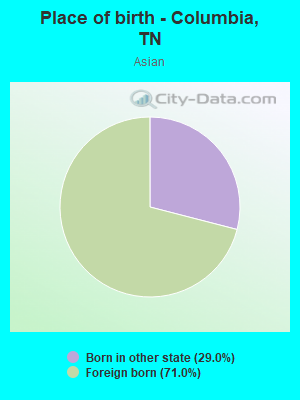
Races - Asian alone (%)
Races - Asian alone (% change since 2000)
Races - Hispanic (%)
Races - Hispanic (% change since 2000)
Races - Native Hawaiian and Other Pacific Islander alone (%)
Races - Native Hawaiian and Other Pacific Islander alone (% change since 2000)
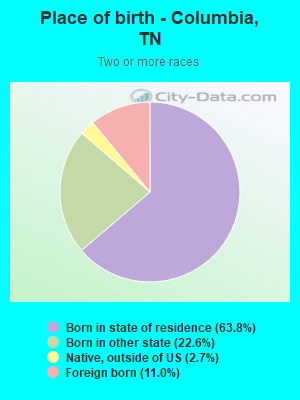
Races - Two or more races(%)
Races - Two or more races(% change since 2000)
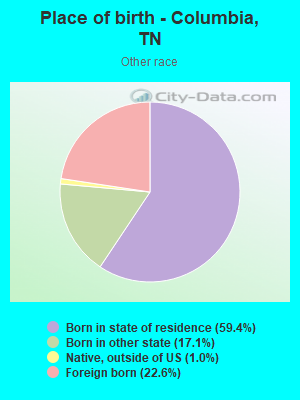
Races - Other race alone (%)
Races - Other race alone (% change since 2000)
Racial diversity
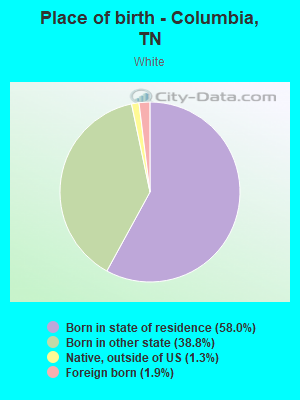
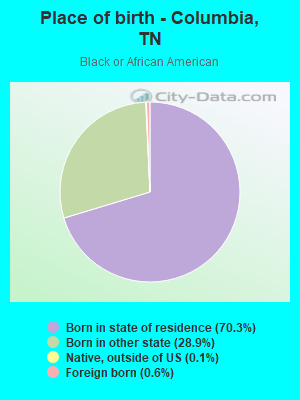
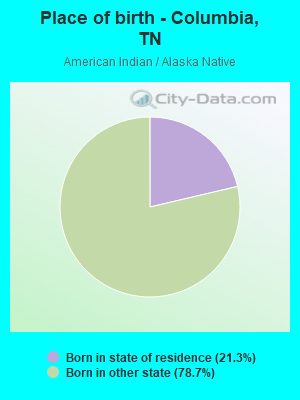
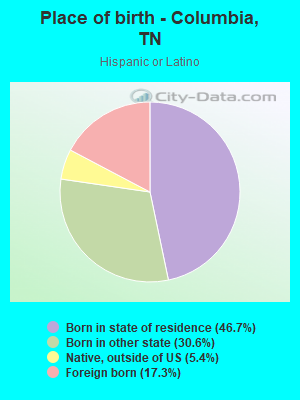
Place of birth - Born in state of residence (%)
Place of birth - Born in state of residence (%) - White
Place of birth - Born in state of residence (%) - Black or African American
Place of birth - Born in state of residence (%) - Asian
Place of birth - Born in state of residence (%) - Hispanic or Latino
Place of birth - Born in state of residence (%) - American Indian and Alaska Native
Place of birth - Born in state of residence (%) - Multirace
Place of birth - Born in state of residence (%) - Other Race
Place of birth - Born in other state (%)
Place of birth - Born in other state (%) - White
Place of birth - Born in other state (%) - Black or African American
Place of birth - Born in other state (%) - Asian
Place of birth - Born in other state (%) - Hispanic or Latino
Place of birth - Born in other state (%) - American Indian and Alaska Native
Place of birth - Born in other state (%) - Multirace
Place of birth - Born in other state (%) - Other Race
Place of birth - Native, outside of US (%)
Place of birth - Native, outside of US (%) - White
Place of birth - Native, outside of US (%) - Black or African American
Place of birth - Native, outside of US (%) - Asian
Place of birth - Native, outside of US (%) - Hispanic or Latino
Place of birth - Native, outside of US (%) - American Indian and Alaska Native
Place of birth - Native, outside of US (%) - Multirace
Place of birth - Native, outside of US (%) - Other Race
Place of birth - Foreign born (%)
Place of birth - Foreign born (%) - White
Place of birth - Foreign born (%) - Black or African American
Place of birth - Foreign born (%) - Asian
Place of birth - Foreign born (%) - Hispanic or Latino
Place of birth - Foreign born (%) - American Indian and Alaska Native
Place of birth - Foreign born (%) - Multirace
Place of birth - Foreign born (%) - Other Race
Residents speaking English at home (%)
Residents speaking English at home - Born in the United States (%)
Residents speaking English at home - Native, born elsewhere (%)
Residents speaking English at home - Foreign born (%)
Residents speaking Spanish at home (%)
Residents speaking Spanish at home - Born in the United States (%)
Residents speaking Spanish at home - Native, born elsewhere (%)
Residents speaking Spanish at home - Foreign born (%)
Residents speaking other language at home (%)
Residents speaking other language at home - Born in the United States (%)
Residents speaking other language at home - Native, born elsewhere (%)
Residents speaking other language at home - Foreign born (%)
Marital status - Never married (%)
Marital status - Now married (%)
Marital status - Separated (%)
Marital status - Widowed (%)
Marital status - Divorced (%)
Ancestries Reported - Arab (%)
Ancestries Reported - Czech (%)
Ancestries Reported - Danish (%)
Ancestries Reported - Dutch (%)
Ancestries Reported - English (%)
Ancestries Reported - French (%)
Ancestries Reported - French Canadian (%)
Ancestries Reported - German (%)
Ancestries Reported - Greek (%)
Ancestries Reported - Hungarian (%)
Ancestries Reported - Irish (%)
Ancestries Reported - Italian (%)
Ancestries Reported - Lithuanian (%)
Ancestries Reported - Norwegian (%)
Ancestries Reported - Polish (%)
Ancestries Reported - Portuguese (%)
Ancestries Reported - Russian (%)
Ancestries Reported - Scotch-Irish (%)
Ancestries Reported - Scottish (%)
Ancestries Reported - Slovak (%)
Ancestries Reported - Subsaharan African (%)
Ancestries Reported - Swedish (%)
Ancestries Reported - Swiss (%)
Ancestries Reported - Ukrainian (%)
Ancestries Reported - United States (%)
Ancestries Reported - Welsh (%)
Ancestries Reported - West Indian (%)
Ancestries Reported - Other (%)
Geographical mobility - Same house 1 year ago (%)
Geographical mobility - Same house 1 year ago (%) - White
Geographical mobility - Same house 1 year ago (%) - Black or African American
Geographical mobility - Same house 1 year ago (%) - Asian
Geographical mobility - Same house 1 year ago (%) - Hispanic or Latino
Geographical mobility - Same house 1 year ago (%) - American Indian and Alaska Native
Geographical mobility - Same house 1 year ago (%) - Multirace
Geographical mobility - Same house 1 year ago (%) - Other Race
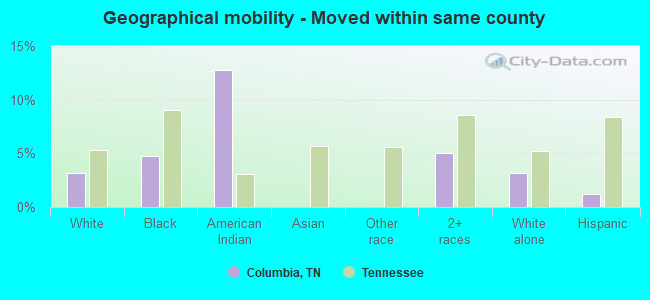
Geographical mobility - Moved within same county (%)
Geographical mobility - Moved within same county (%) - White
Geographical mobility - Moved within same county (%) - Black or African American
Geographical mobility - Moved within same county (%) - Asian
Geographical mobility - Moved within same county (%) - Hispanic or Latino
Geographical mobility - Moved within same county (%) - American Indian and Alaska Native
Geographical mobility - Moved within same county (%) - Multirace
Geographical mobility - Moved within same county (%) - Other Race
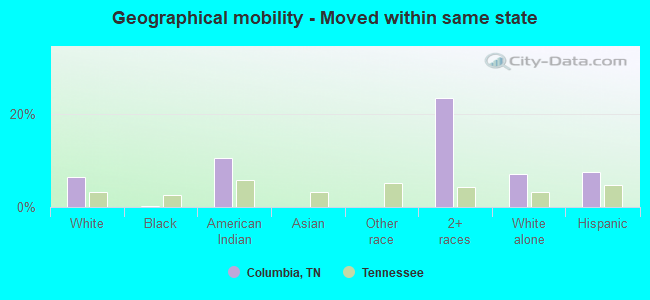
Geographical mobility - Moved from different county within same state (%)
Geographical mobility - Moved from different county within same state (%) - White
Geographical mobility - Moved from different county within same state (%) - Black or African American
Geographical mobility - Moved from different county within same state (%) - Asian
Geographical mobility - Moved from different county within same state (%) - Hispanic or Latino
Geographical mobility - Moved from different county within same state (%) - American Indian and Alaska Native
Geographical mobility - Moved from different county within same state (%) - Multirace
Geographical mobility - Moved from different county within same state (%) - Other Race
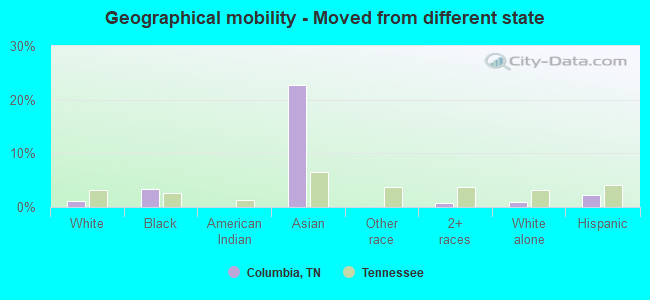
Geographical mobility - Moved from different state (%)
Geographical mobility - Moved from different state (%) - White
Geographical mobility - Moved from different state (%) - Black or African American
Geographical mobility - Moved from different state (%) - Asian
Geographical mobility - Moved from different state (%) - Hispanic or Latino
Geographical mobility - Moved from different state (%) - American Indian and Alaska Native
Geographical mobility - Moved from different state (%) - Multirace
Geographical mobility - Moved from different state (%) - Other Race
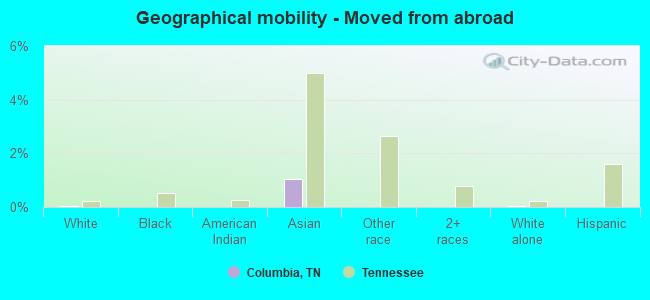
Geographical mobility - Moved from abroad (%)
Geographical mobility - Moved from abroad (%) - White
Geographical mobility - Moved from abroad (%) - Black or African American
Geographical mobility - Moved from abroad (%) - Asian
Geographical mobility - Moved from abroad (%) - Hispanic or Latino
Geographical mobility - Moved from abroad (%) - American Indian and Alaska Native
Geographical mobility - Moved from abroad (%) - Multirace
Geographical mobility - Moved from abroad (%) - Other Race
Place of birth for the foreign-born population - Ireland (%)
Place of birth for the foreign-born population - Denmark (%)
Place of birth for the foreign-born population - Norway (%)
Place of birth for the foreign-born population - Sweden (%)
Place of birth for the foreign-born population - United Kingdom (%)
Place of birth for the foreign-born population - England (%)
Place of birth for the foreign-born population - Scotland (%)
Place of birth for the foreign-born population - Other Northern Europe (%)
Place of birth for the foreign-born population - Austria (%)
Place of birth for the foreign-born population - Belgium (%)
Place of birth for the foreign-born population - France (%)
Place of birth for the foreign-born population - Germany (%)
Place of birth for the foreign-born population - Netherlands (%)
Place of birth for the foreign-born population - Switzerland (%)
Place of birth for the foreign-born population - Other Western Europe (%)
Place of birth for the foreign-born population - Greece (%)
Place of birth for the foreign-born population - Italy (%)
Place of birth for the foreign-born population - Portugal (%)
Place of birth for the foreign-born population - Spain (%)
Place of birth for the foreign-born population - Other Southern Europe (%)
Place of birth for the foreign-born population - Albania (%)
Place of birth for the foreign-born population - Belarus (%)
Place of birth for the foreign-born population - Bosnia and Herzegovina (%)
Place of birth for the foreign-born population - Bulgaria (%)
Place of birth for the foreign-born population - Croatia (%)
Place of birth for the foreign-born population - Czechoslovakia (%)
Place of birth for the foreign-born population - Hungary (%)
Place of birth for the foreign-born population - Latvia (%)
Place of birth for the foreign-born population - Lithuania (%)
Place of birth for the foreign-born population - North Macedonia (Macedonia) (%)
Place of birth for the foreign-born population - Moldova (%)
Place of birth for the foreign-born population - Poland (%)
Place of birth for the foreign-born population - Romania (%)
Place of birth for the foreign-born population - Russia (%)
Place of birth for the foreign-born population - Serbia (%)
Place of birth for the foreign-born population - Ukraine (%)
Place of birth for the foreign-born population - Other Eastern Europe (%)
Place of birth for the foreign-born population - China (%)
Place of birth for the foreign-born population - Hong Kong (%)
Place of birth for the foreign-born population - Taiwan (%)
Place of birth for the foreign-born population - Japan (%)
Place of birth for the foreign-born population - Korea (%)
Place of birth for the foreign-born population - Other Eastern Asia (%)
Place of birth for the foreign-born population - Afghanistan (%)
Place of birth for the foreign-born population - Bangladesh (%)
Place of birth for the foreign-born population - India (%)
Place of birth for the foreign-born population - Iran (%)
Place of birth for the foreign-born population - Kazakhstan (%)
Place of birth for the foreign-born population - Nepal (%)
Place of birth for the foreign-born population - Pakistan (%)
Place of birth for the foreign-born population - Sri Lanka (%)
Place of birth for the foreign-born population - Uzbekistan (%)
Place of birth for the foreign-born population - Other South Central Asia (%)
Place of birth for the foreign-born population - Burma (%)
Place of birth for the foreign-born population - Cambodia (%)
Place of birth for the foreign-born population - Indonesia (%)
Place of birth for the foreign-born population - Laos (%)
Place of birth for the foreign-born population - Malaysia (%)
Place of birth for the foreign-born population - Philippines (%)
Place of birth for the foreign-born population - Singapore (%)
Place of birth for the foreign-born population - Thailand (%)
Place of birth for the foreign-born population - Vietnam (%)
Place of birth for the foreign-born population - Other South Eastern Asia (%)
Place of birth for the foreign-born population - Armenia (%)
Place of birth for the foreign-born population - Iraq (%)
Place of birth for the foreign-born population - Israel (%)
Place of birth for the foreign-born population - Jordan (%)
Place of birth for the foreign-born population - Kuwait (%)
Place of birth for the foreign-born population - Lebanon (%)
Place of birth for the foreign-born population - Saudi Arabia (%)
Place of birth for the foreign-born population - Syria (%)
Place of birth for the foreign-born population - Turkey (%)
Place of birth for the foreign-born population - Yemen (%)
Place of birth for the foreign-born population - Other Western Asia (%)
Place of birth for the foreign-born population - Eritrea (%)
Place of birth for the foreign-born population - Ethiopia (%)
Place of birth for the foreign-born population - Kenya (%)
Place of birth for the foreign-born population - Somalia (%)
Place of birth for the foreign-born population - Uganda (%)
Place of birth for the foreign-born population - Zimbabwe (%)
Place of birth for the foreign-born population - Other Eastern Africa (%)
Place of birth for the foreign-born population - Cameroon (%)
Place of birth for the foreign-born population - Congo (%)
Place of birth for the foreign-born population - Democratic Republic of Congo (Zaire) (%)
Place of birth for the foreign-born population - Other Middle Africa (%)
Place of birth for the foreign-born population - Egypt (%)
Place of birth for the foreign-born population - Morocco (%)
Place of birth for the foreign-born population - Sudan (%)
Place of birth for the foreign-born population - Other Northern Africa (%)
Place of birth for the foreign-born population - South Africa (%)
Place of birth for the foreign-born population - Other Southern Africa (%)
Place of birth for the foreign-born population - Cabo Verde (%)
Place of birth for the foreign-born population - Ghana (%)
Place of birth for the foreign-born population - Liberia (%)
Place of birth for the foreign-born population - Nigeria (%)
Place of birth for the foreign-born population - Senegal (%)
Place of birth for the foreign-born population - Sierra Leone (%)
Place of birth for the foreign-born population - Other Western Africa (%)
Place of birth for the foreign-born population - Australia (%)
Place of birth for the foreign-born population - New Zealand (%)
Place of birth for the foreign-born population - Fiji (%)
Place of birth for the foreign-born population - Micronesia (%)
Place of birth for the foreign-born population - Bahamas (%)
Place of birth for the foreign-born population - Barbados (%)
Place of birth for the foreign-born population - Cuba (%)
Place of birth for the foreign-born population - Dominica (%)
Place of birth for the foreign-born population - Dominican Republic (%)
Place of birth for the foreign-born population - Grenada (%)
Place of birth for the foreign-born population - Haiti (%)
Place of birth for the foreign-born population - Jamaica (%)
Place of birth for the foreign-born population - St. Vincent and the Grenadines (%)
Place of birth for the foreign-born population - Trinidad and Tobago (%)
Place of birth for the foreign-born population - West Indies (%)
Place of birth for the foreign-born population - Other Caribbean (%)
Place of birth for the foreign-born population - Belize (%)
Place of birth for the foreign-born population - Costa Rica (%)
Place of birth for the foreign-born population - El Salvador (%)
Place of birth for the foreign-born population - Guatemala (%)
Place of birth for the foreign-born population - Honduras (%)
Place of birth for the foreign-born population - Mexico (%)
Place of birth for the foreign-born population - Nicaragua (%)
Place of birth for the foreign-born population - Panama (%)
Place of birth for the foreign-born population - Other Central America (%)
Place of birth for the foreign-born population - Argentina (%)
Place of birth for the foreign-born population - Bolivia (%)
Place of birth for the foreign-born population - Brazil (%)
Place of birth for the foreign-born population - Chile (%)
Place of birth for the foreign-born population - Colombia (%)
Place of birth for the foreign-born population - Ecuador (%)
Place of birth for the foreign-born population - Guyana (%)
Place of birth for the foreign-born population - Peru (%)
Place of birth for the foreign-born population - Uruguay (%)
Place of birth for the foreign-born population - Venezuela (%)
Place of birth for the foreign-born population - Other South America (%)
Place of birth for the foreign-born population - Canada (%)
Place of birth for the foreign-born population - Other Northern America (%)
Place of birth for the foreign-born population - Other (%)
Latest news about races in Columbia, TN collected exclusively by city-data.com from local newspapers, TV, and radio stations
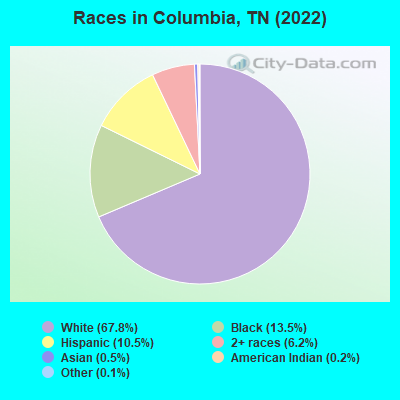
According to 2022 data, the most numerous races in Columbia, TN are White alone (30,550 residents), Black alone (6,061 residents), and Hispanic (4,734 residents). 92.9% of Columbia residents speak English at home. 3.6% of Columbia, TN residents are foreign-born (2.7% born in Latin America, 0.4% born in Asia), which is 39.8% less than the foreign-born rate of 5.0% across the entire state of Tennessee.
Race distribution in Columbia
2000 2022
4,505,930 79.2% White alone 928,204 16.3% Black alone 123,838 2.2% Hispanic 54,824 1.0% Two or more races 56,077 1.0% Asian alone 13,820 0.2% American Indian alone 4,780 0.08% Other race alone 1,810 0.03% Native Hawaiian and Other
5,070,026 71.9% White alone 1,089,738 15.5% Black alone 442,629 6.3% Hispanic 279,381 4.0% Two or more races 131,817 1.9% Asian alone 26,972 0.4% Other race alone 6,387 0.09% American Indian alone 4,389 0.06% Native Hawaiian and Other
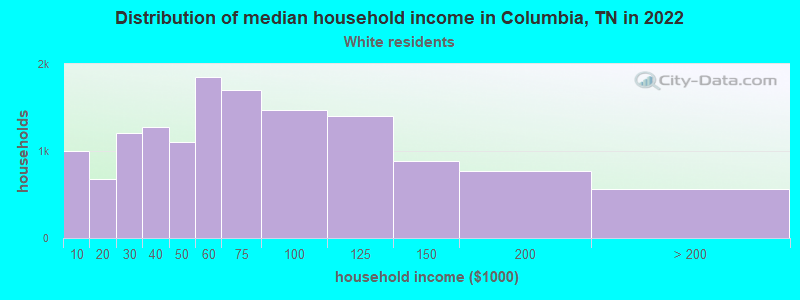
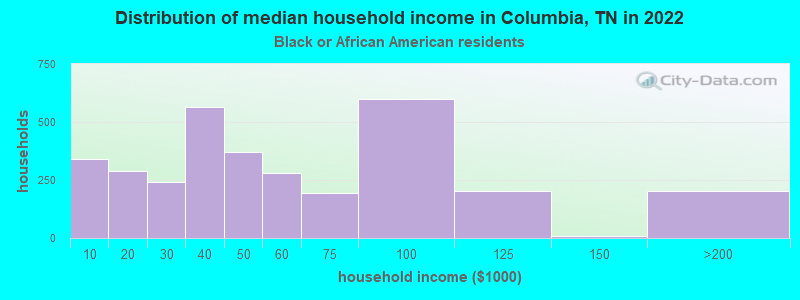
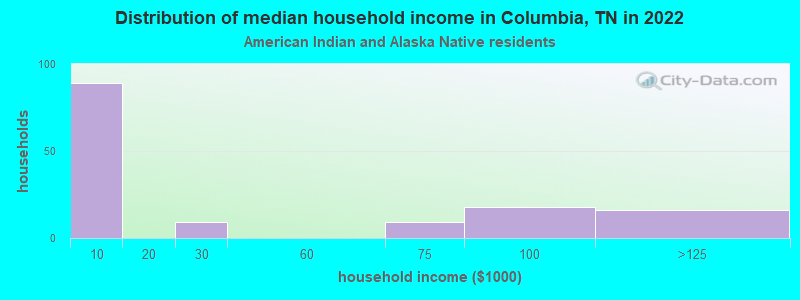
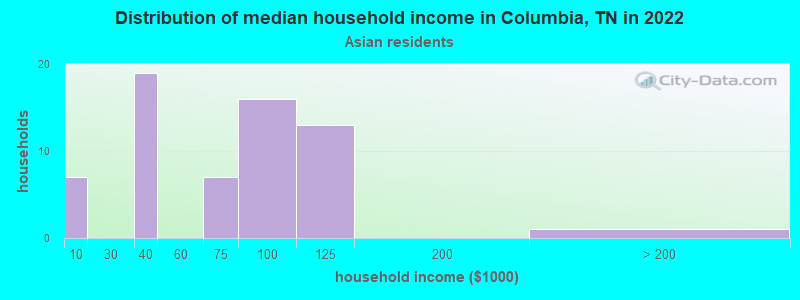
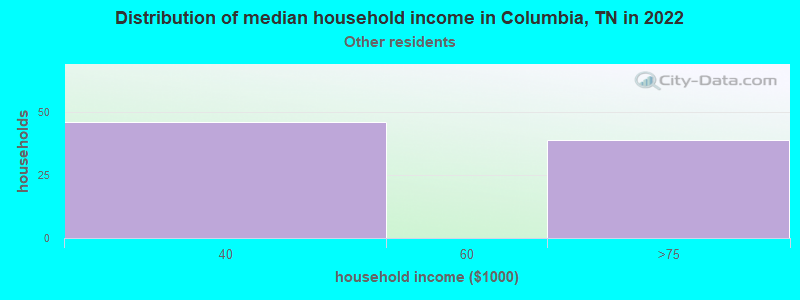
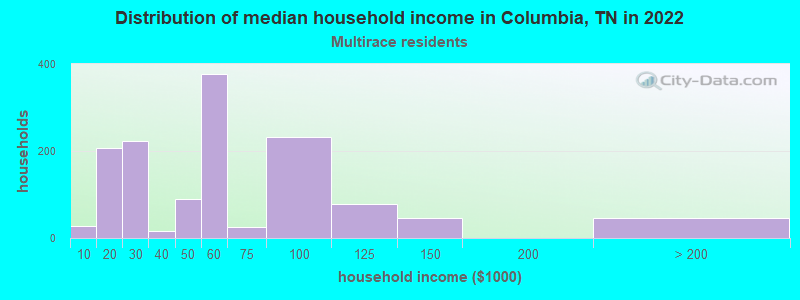
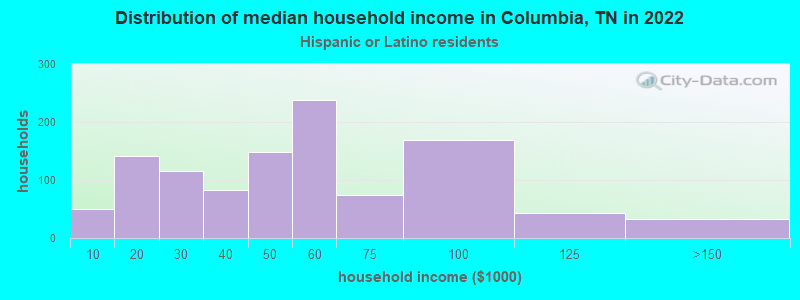
Income and house value in Columbia Median household income in 2022 $58,009 White non-Hispanic householders$42,032 Black householders$97,073 Asian householders$69,212 Two or more races householders$75,574 Hispanic or Latino race householdersMedian 2022 house value $325,727 White Non-Hispanic householders$245,261 Black or African American householders$193,257 American Indian or Alaska Native householders$404,787 Some other race householders$323,618 Two or more races householders$427,978 Hispanic or Latino householders
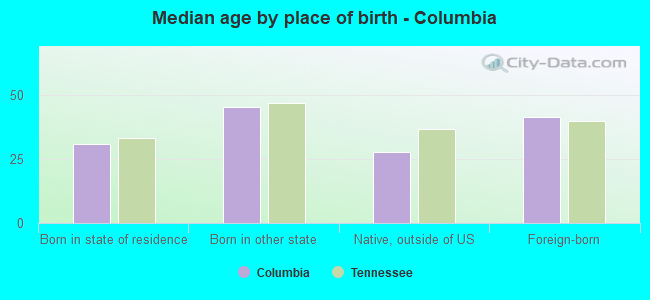
Median age by race in Columbia
37.5 Median age for White residents36.9 37.6 37.7 Median age for Black or African American residents38.8 48.3 56.5 Median age for American Indian / Alaska Native residents13.9 70.1 52.8 Median age for Asian residents74.0 39.8 -666,666,666.0 Median age for Native Hawaiian / Pacific Islander residents-666,666,666.0 -666,666,666.0 18.6 Median age for Other race residents17.7 3.2 16.9 Median age for Two or more races residents8.7 21.2 38.6 Median age for White alone residents38.1 39.2 19.5 Median age for Hispanic or Latino residents21.8 19.3
Owner/renter occupied households by race in Columbia
House owners and renters - White residents 8,797 63.8% Owner occupied4,982 36.2% Renter occupiedHouse owners and renters - Black or African American residents 1,760 65.5% Owner occupied928 34.5% Renter occupiedHouse owners and renters - American Indian / Alaska Native residents 46 37.1% Owner occupied78 62.9% Renter occupiedHouse owners and renters - Asian residents 52 73.7% Owner occupied19 26.3% Renter occupiedHouse owners and renters - Other race residents 24 34.4% Owner occupied45 65.6% Renter occupiedHouse owners and renters - Two or more races residents 887 81.4% Owner occupied202 18.6% Renter occupiedHouse owners and renters - White alone residents 8,511 63.9% Owner occupied4,817 36.1% Renter occupiedHouse owners and renters - Hispanic or Latino residents 667 65.9% Owner occupied345 34.1% Renter occupied
Language usage in Columbia
English speakers - Total 92.9% of residents of Columbia speak English at home.
6.1% of residents speak Spanish at home 1,870 76.5% Speak English very well573 23.5% Speak English less than very well0.7% of residents speak other language at home 147 50.7% Speak English very well143 49.3% Speak English less than very well
English speakers - Born in the United States 95.6% of residents of Columbia speak English at home.
3.9% of residents speak Spanish at home 523 86.3% Speak English very well83 13.7% Speak English less than very well0.2% of residents speak other language at home 15 45.5% Speak English very well18 54.5% Speak English less than very well
English speakers - Native, born elsewhere 48.3% of residents of Columbia speak English at home.
44.8% of residents speak Spanish at home 129 100.0% Speak English very well4.5% of residents speak other language at home 13 100.0% Speak English very well
English speakers - Foreign-born 17.5% of residents of Columbia speak English at home.
67.4% of residents speak Spanish at home 638 58.9% Speak English very well445 41.1% Speak English less than very well13.1% of residents speak other language at home 97 46.2% Speak English very well113 53.8% Speak English less than very well
White (Caucasian) - Speak only English Native:
97.6% (29,136)Foreign-born:
31.0% (196)
White (Caucasian) - Speak another language Native:
1.9% (572)Foreign-born:
65.2% (412)
Black or African American - Speak only English Native:
99.3% (6,655)Foreign-born:
100.0% (44)
Asian - Speak another language Native:
60.3% (32)Foreign-born:
100.0% (125)
Other race - Speak only English Native:
97.4% (303)Foreign-born:
5.1% (5)
Other race - Speak another language Native:
6.7% (21)Foreign-born:
95.7% (101)
Two or more races - Speak only English Native:
75.3% (2,090)Foreign-born:
6.8% (69)
Two or more races - Speak another language Native:
26.2% (726)Foreign-born:
93.1% (945)
White alone - Speak only English Native:
99.4% (28,196)Foreign-born:
58.0% (178)
White alone - Speak another language Native:
0.6% (160)Foreign-born:
18.3% (56)
Hispanic or Latino - Speak only English Native:
73.0% (2,594)Foreign-born:
4.9% (39)
Hispanic or Latino - Speak another language Native:
23.1% (822)Foreign-born:
91.6% (738)
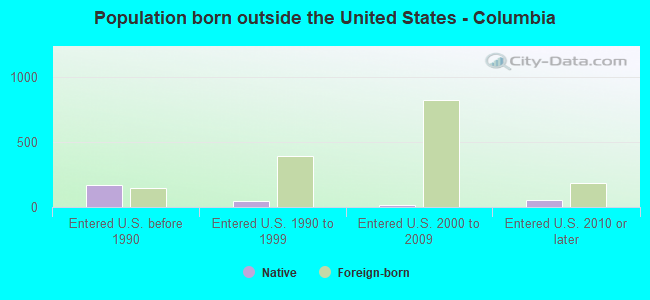
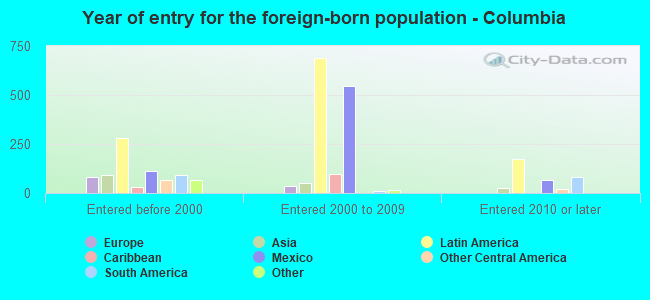
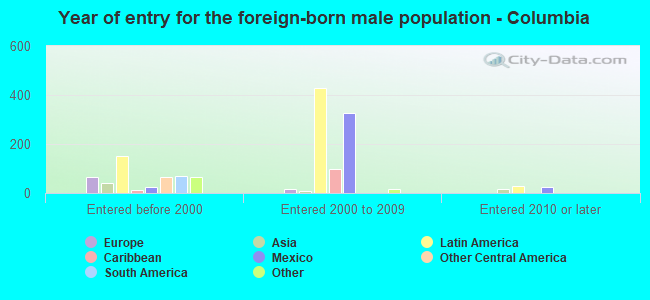
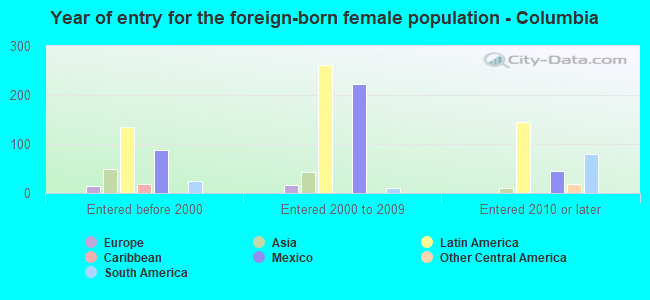
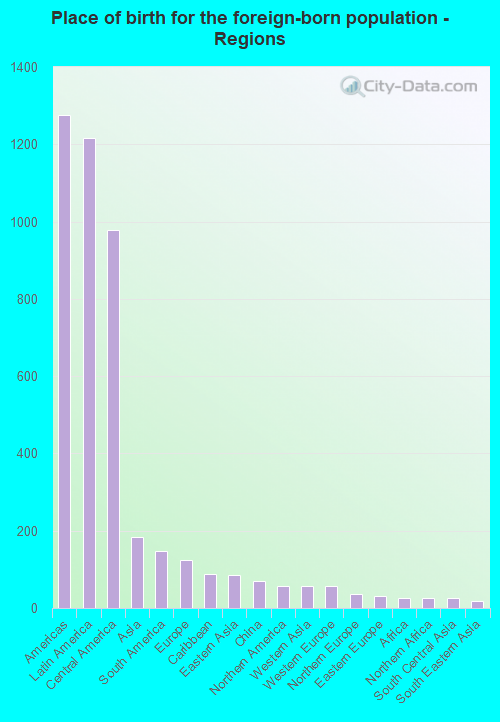
Foreign-born residents in Columbia 1,611 residents are foreign born (2.7% Latin America , 0.4% Asia ).
This city:
3.6%Tennessee:
5.4%
Marital status for residents in Columbia Marital status - White (Caucasian) population 15 years and over
Males 29.2% Never married51.5% Now married0.7% Separated4.8% Widowed13.7% DivorcedFemales 25.8% Never married44.8% Now married1.5% Separated12.1% Widowed15.8% DivorcedWomen who gave birth in the past 12 months Now married:
96.2% (213)Unmarried:
3.8% (8)
Women who did not give birth in the past 12 months Now married:
46.1% (3,726)Unmarried:
53.9% (4,348)
Marital status - Black or African American population 15 years and over
Males 64.6% Never married25.8% Now married2.1% Separated2.5% Widowed4.9% DivorcedFemales 50.9% Never married20.8% Now married2.7% Separated10.9% Widowed14.8% DivorcedWomen who did not give birth in the past 12 months Now married:
19.1% (351)Unmarried:
80.9% (1,485)
Marital status - American Indian / Alaska Native population 15 years and over
Males 53.6% Never married0.0% Now married46.4% Separated0.0% Widowed0.0% DivorcedFemales 0.0% Never married0.0% Now married56.2% Separated0.0% Widowed43.8% DivorcedWomen who did not give birth in the past 12 months Now married:
100.0% (21)Unmarried:
0.0% (0)
Marital status - Asian population 15 years and over
Males 0.0% Never married84.2% Now married0.0% Separated0.0% Widowed15.8% DivorcedFemales 43.0% Never married20.2% Now married22.8% Separated5.3% Widowed8.8% DivorcedWomen who did not give birth in the past 12 months Now married:
41.5% (41)Unmarried:
58.5% (57)
Marital status - Other race population 15 years and over
Males 50.3% Never married19.0% Now married30.6% Separated0.0% Widowed0.0% DivorcedFemales 22.8% Never married77.2% Now married0.0% Separated0.0% Widowed0.0% DivorcedWomen who gave birth in the past 12 months Now married:
0.0% (0)Unmarried:
100.0% (15)
Women who did not give birth in the past 12 months Now married:
100.0% (52)Unmarried:
0.0% (0)
Marital status - Two or more races population 15 years and over
Males 34.4% Never married52.9% Now married4.5% Separated1.2% Widowed7.0% DivorcedFemales 29.7% Never married44.3% Now married0.0% Separated2.2% Widowed23.7% DivorcedWomen who gave birth in the past 12 months Now married:
100.0% (89)Unmarried:
0.0% (0)
Women who did not give birth in the past 12 months Now married:
36.6% (387)Unmarried:
63.4% (670)
Marital status - White alone, not Hispanic / Latino population 15 years and over
Males 28.0% Never married51.8% Now married0.7% Separated5.1% Widowed14.3% DivorcedFemales 24.7% Never married44.9% Now married1.5% Separated12.7% Widowed16.2% DivorcedWomen who gave birth in the past 12 months Now married:
96.2% (213)Unmarried:
3.8% (8)
Women who did not give birth in the past 12 months Now married:
46.4% (3,458)Unmarried:
53.6% (3,990)
Marital status - Hispanic or Latino population 15 years and over
Males 44.2% Never married47.2% Now married5.2% Separated0.0% Widowed3.5% DivorcedFemales 29.1% Never married49.4% Now married2.7% Separated2.8% Widowed16.1% DivorcedWomen who gave birth in the past 12 months Now married:
82.2% (67)Unmarried:
17.8% (14)
Women who did not give birth in the past 12 months Now married:
53.2% (619)Unmarried:
46.8% (545)
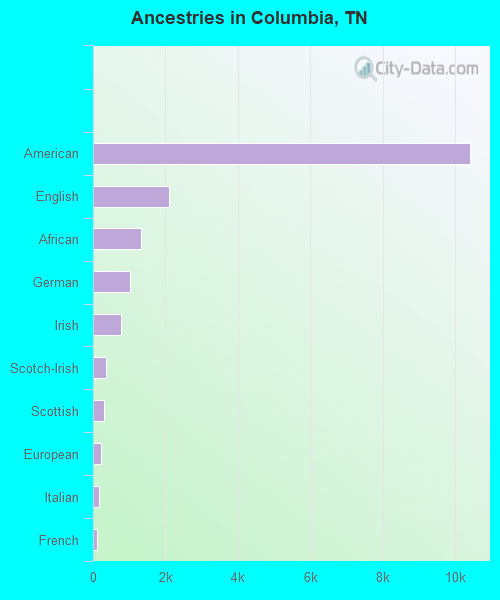
Ancestries in Columbia
10,415 39.7% American2,093 8.0% English1,334 5.1% African1,027 3.9% German765 2.9% Irish349 1.3% Scotch-Irish314 1.2% Scottish227 0.9% European176 0.7% Italian98 0.4% French85 0.3% Scandinavian77 0.3% Jamaican49 0.2% French Canadian35 0.1% Dutch31 0.1% Polish29 0.1% British29 0.1% Canadian28 0.1% Norwegian28 0.1% Ukrainian26 0.10% Hungarian22 0.08% Egyptian22 0.08% Lebanese17 0.06% Danish11 0.04% Portuguese9 0.03% Swedish8 0.03% Slovak7 0.03% Welsh
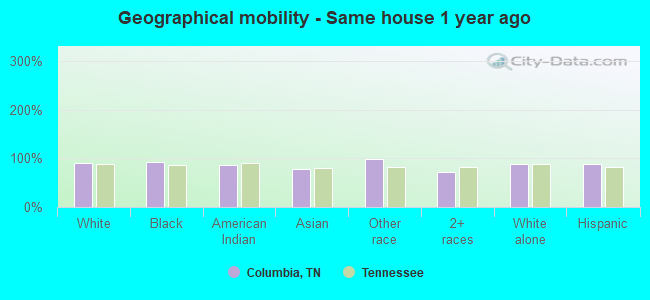
Geographical mobility in Columbia Same house 1 year ago 28,847 89.7% White (Caucasian)6,497 91.8% Black or African American194 86.3% American Indian / Alaska Native141 78.6% Asian431 99.0% Other race3,467 72.4% Two or more races27,012 89.2% White alone, not Hispanic / Latino4,170 87.8% Hispanic or LatinoMoved within same county 1,013 3.2% White / Caucasian333 4.7% Black or African American29 12.8% American Indian / Alaska Native242 5.1% Two or more races959 3.2% White alone, not Hispanic / Latino57 1.2% Hispanic or LatinoMoved within same state 2,078 6.5% White / Caucasian22 0.3% Black or African American24 10.5% American Indian / Alaska Native1,119 23.4% Two or more races2,143 7.1% White alone, not Hispanic / Latino355 7.5% Hispanic or LatinoMoved from different state 334 1.0% White / Caucasian242 3.4% Black or African American41 22.8% Asian40 0.8% Two or more races305 1.0% White alone, not Hispanic / Latino110 2.3% Hispanic or LatinoMoved from abroad 11 0.0% White2 1.0% Asian16 0.1% White alone, not Hispanic / Latino
Children Nativity (place of birth) in Columbia
Children under 6 years - Living with two parents Both parents native 1,838 100.0% NativeBoth parents foreign-born 14 100.0% NativeOne native, one foreign-born parent 139 100.0% NativeChildren under 6 years - Living with one parent Native parent 1,235 100.0% Native0 0.0% Foreign-bornForeign-born parent 166 99.5% Native1 0.5% Foreign-bornChildren 6 to 17 years - Living with two parents Both parents native 3,391 100.0% NativeBoth parents foreign-born 346 100.0% NativeOne native, one foreign-born parent 114 100.0% NativeChildren 6 to 17 years - Living with one parent Native parent 2,580 100.0% NativeForeign-born parent 341 52.9% Native304 47.1% Foreign-born
Grandparents responsible for own grandchildren in Columbia
Grandparents (30 to 59 years) White / Caucasian 80 59.8% Responsible for grandchildren54 40.2% Not responsible for grandchildrenBlack or African American 3 11.0% Responsible for grandchildren23 89.0% Not responsible for grandchildrenTwo or more races 21 100.0% Responsible for grandchildrenWhite alone, not Hispanic / Latino 80 59.2% Responsible for grandchildren55 40.8% Not responsible for grandchildrenGrandparents (60 years and over) White / Caucasian 47 28.7% Responsible for grandchildren117 71.3% Not responsible for grandchildrenBlack or African American 46 100.0% Responsible for grandchildrenWhite alone, not Hispanic / Latino 47 28.8% Responsible for grandchildren117 71.2% Not responsible for grandchildren