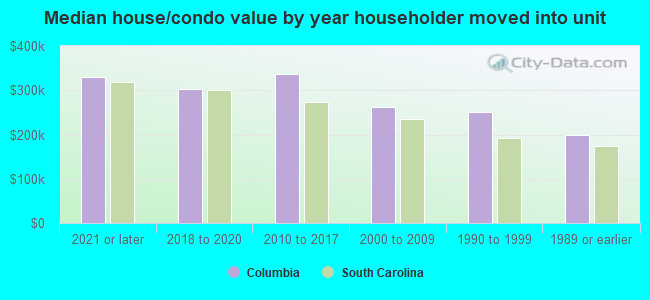
Columbia, SC (South Carolina) Houses and Residents
| Columbia: | $286,200 |
| South Carolina: | $254,600 |
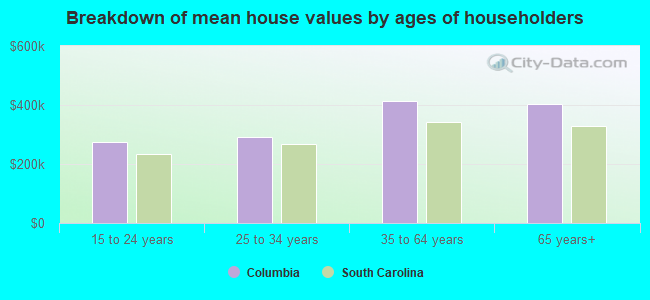
Mean price in 2022:
Detached houses: $380,451
Here: $380,451 State: $368,255 Townhouses or other attached units: $166,920
Here: $166,920 State: $292,023 In 2-unit structures: $316,224
Here: $316,224 State: $358,283 In 3-to-4-unit structures: $298,747
Here: $298,747 State: $230,702 In 5-or-more-unit structures: $368,184
Here: $368,184 State: $326,361 Mobile homes: $95,380
Here: $95,380 State: $102,531
Total population: 132,067 (Urban population: 115,006, Rural population: 988 (all nonfarm))
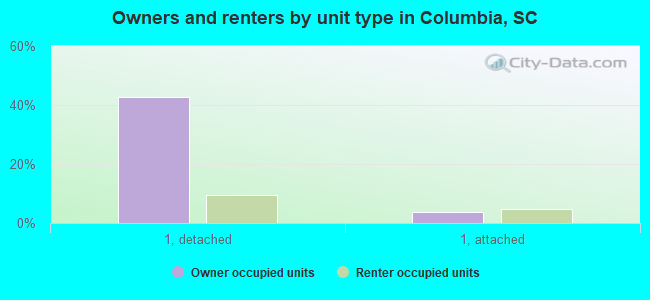
Houses: 62,487 (54,570 occupied: 25,602 owner occupied, 28,968 renter occupied)
| % of renters here: | 53% |
| State: | 28% |
Housing density: 499 houses/condos per square mile
Median price asked for vacant for-sale houses and condos in 2022: $237,742.
Median contract rent in 2022: $974 (lower quartile is $715, upper quartile is $1,218)
Median rent asked for vacant for-rent units in 2022: $2,159
Median gross rent in Columbia, SC in 2022: $1,130
Housing units in Columbia with a mortgage: 17,292 (1,084 second mortgage, 22 home equity loan, 929 both second mortgage and home equity loan)
Houses without a mortgage: 425
Median household income for houses/condos with a mortgage: $102,204
Median household income for apartments without a mortgage: $70,863
Median monthly housing costs: $1,147
Compare current foreclosures in Columbia, SC:
| Photo | Address | Area | Beds / Baths | Price | Details |
|---|---|---|---|---|---|

|
#1
Brookview Rd
Columbia, SC 29212
|
1,721 sq. feet
|
2 baths 3 beds |
$275,000
|
show details |

|
#2
Ashley St
Columbia, SC 29203
|
875 sq. feet
|
1 baths 2 beds |
show details | |

|
#3
Madera Dr
Columbia, SC 29203
|
1,751 sq. feet
|
1 baths 3 beds |
show details | |

|
#4
Frasier Fir Ln
Columbia, SC 29229
|
2,590 sq. feet
|
2 baths 4 beds |
show details | |

|
#5
Holmes Ave
Columbia, SC 29203
|
1,200 sq. feet
|
1 baths 3 beds |
show details | |

|
#6
Seabury St
Columbia, SC 29203
|
900 sq. feet
|
1 baths 3 beds |
show details | |

|
#7
Bentwood Ln
Columbia, SC 29229
|
3,171 sq. feet
|
3 baths 3 beds |
show details | |

|
#8
Chesnee Dr
Columbia, SC 29203
|
1,191 sq. feet
|
1 baths 3 beds |
show details | |

|
#9
Chadwell Rd
Columbia, SC 29223
|
950 sq. feet
|
1 baths 3 beds |
show details | |

|
#10
Coralbean Way
Columbia, SC 29229
|
2,360 sq. feet
|
3 baths 4 beds |
show details |
| Photo | Address | Area | Beds / Baths | Price | Details |
|---|---|---|---|---|---|

|
#11
Fox Squirrel Cir
Columbia, SC 29209
|
1,693 sq. feet
|
2 baths 3 beds |
show details | |

|
#12
Ambergate Ln
Columbia, SC 29229
|
2,448 sq. feet
|
3 baths 5 beds |
show details | |

|
#13
Lou Ln
Columbia, SC 29203
|
1,056 sq. feet
|
2 baths 3 beds |
show details | |

|
#14
N Hillock Ct
Columbia, SC 29223
|
1,692 sq. feet
|
2 baths 3 beds |
show details | |

|
#15
Willow Winds Dr
Columbia, SC 29210
|
1,658 sq. feet
|
2 baths 2 beds |
show details | |

|
#16
Gardenhill Dr
Columbia, SC 29229
|
2,074 sq. feet
|
2 baths 3 beds |
show details | |

|
#17
Montreat Ct
Columbia, SC 29209
|
1,456 sq. feet
|
1 baths 3 beds |
show details | |

|
#18
Coldstream Ct
Columbia, SC 29212
|
2,476 sq. feet
|
2 baths 3 beds |
show details | |

|
#19
Indigo Springs Dr
Columbia, SC 29229
|
3,148 sq. feet
|
3 baths 4 beds |
show details | |

|
#20
Wilmette Rd
Columbia, SC 29203
|
1,161 sq. feet
|
2 baths 3 beds |
show details |
| Photo | Address | Area | Beds / Baths | Price | Details |
|---|---|---|---|---|---|

|
#21
Schofield Ln
Columbia, SC 29229
|
2,240 sq. feet
|
2 baths 4 beds |
show details | |

|
#22
Goldstone Dr
Columbia, SC 29212
|
1,929 sq. feet
|
2 baths 4 beds |
show details | |

|
#23
Arcadia Woods Rd
Columbia, SC 29206
|
1,841 sq. feet
|
2 baths 3 beds |
show details | |

|
#24
Marion St
Columbia, SC 29201
|
1,972 sq. feet
|
3 baths 3 beds |
show details | |

|
#25
Seehorne Ct
Columbia, SC 29229
|
1,393 sq. feet
|
2 baths 3 beds |
show details | |

|
#26
Palmland Dr
Columbia, SC 29209
|
990 sq. feet
|
1 baths 3 beds |
show details | |

|
#27
Forestview Cir
Columbia, SC 29212
|
1,560 sq. feet
|
2 baths 3 beds |
show details | |

|
#28
Grinders Mill Rd
Columbia, SC 29223
|
2,065 sq. feet
|
2 baths 4 beds |
show details | |

|
#29
Great North Rd
Columbia, SC 29223
|
1,940 sq. feet
|
2 baths 4 beds |
show details | |

|
#30
Edgecliff Way
Columbia, SC 29229
|
1,794 sq. feet
|
2 baths 3 beds |
show details |
| Photo | Address | Area | Beds / Baths | Price | Details |
|---|---|---|---|---|---|

|
#31
Nottingham Ct
Columbia, SC 29209
|
2,326 sq. feet
|
2 baths 4 beds |
show details | |

|
#32
Brandon Hall Rd
Columbia, SC 29229
|
1,841 sq. feet
|
2 baths 3 beds |
show details | |

|
#33
Pine Belt Rd
Columbia, SC 29204
|
2,272 sq. feet
|
2 baths 4 beds |
show details | |

|
#34
Peachwood Dr
Columbia, SC 29203
|
950 sq. feet
|
1 baths 3 beds |
show details | |

|
#35
Bent Bough Cir
Columbia, SC 29212
|
1,540 sq. feet
|
2 baths 3 beds |
show details | |

|
#36
Chevis St
Columbia, SC 29205
|
1,334 sq. feet
|
2 baths 3 beds |
show details | |

|
#37
Willow Hurst Ct
Columbia, SC 29209
|
2,532 sq. feet
|
2 baths 4 beds |
show details | |

|
#38
W Beltline Blvd
Columbia, SC 29203
|
1,209 sq. feet
|
2 baths 3 beds |
show details | |

|
#39
Parkview Dr
Columbia, SC 29223
|
1,569 sq. feet
|
2 baths 3 beds |
show details | |

|
#40
Gauley Dr
Columbia, SC 29212
|
2,414 sq. feet
|
2 baths 4 beds |
show details |
| Photo | Address | Area | Beds / Baths | Price | Details |
|---|---|---|---|---|---|

|
#41
Dulaney Bnd
Columbia, SC 29229
|
3,468 sq. feet
|
3 baths 4 beds |
show details | |

|
#42
Newnham Dr
Columbia, SC 29210
|
1,324 sq. feet
|
2 baths 3 beds |
show details | |

|
#43
Sandmyrtle Cir
Columbia, SC 29229
|
1,220 sq. feet
|
2 baths 2 beds |
show details | |

|
#44
Newcourt Pl
Columbia, SC 29229
|
1,935 sq. feet
|
2 baths 4 beds |
show details | |

|
#45
Hileah Dr
Columbia, SC 29209
|
1,014 sq. feet
|
1 baths 3 beds |
show details | |

|
#46
Hatcher Dr
Columbia, SC 29203
|
909 sq. feet
|
1 baths 3 beds |
show details | |

|
#47
Delverton Rd
Columbia, SC 29203
|
1,772 sq. feet
|
1 baths 3 beds |
show details | |

|
#48
Ashley Crest Dr
Columbia, SC 29229
|
1,921 sq. feet
|
2 baths 3 beds |
show details | |

|
#49
White Gables Dr
Columbia, SC 29229
|
1,305 sq. feet
|
2 baths 3 beds |
show details | |

|
Check over 1 million property listings on Foreclosure.com!
|
browse all offers | |||

Latest news about housing in Columbia, SC collected exclusively by city-data.com from local newspapers, TV, and radio stations

 | Visiting Columbia area next weekend to check out apartments (9 replies) |
| Apartment/Condo Rental & Nightlife Options (7 replies) |
| Best apartments/places to rent in Columbia (0 replies) |
| Potential Move to Columbia-Apartments? (11 replies) |
| Are There Any Old Houses In Columbia For Rent (3 replies) |
| What's the best timeline for looking at apartments to rent? (9 replies) |
Median year apartment built: 1987
Household type by relationship:
Households: 139,343- Male householders: 26,183 (11,246 living alone), Female householders: 28,387 (11,325 living alone)
14,987 spouses (14,717 opposite-sex spouses), 4,922 unmarried partners, (4,789 opposite-sex unmarried partners), 27,689 children (25,168 natural, 1,582 adopted, 939 stepchildren), 2,191 grandchildren, 2,536 brothers or sisters, 336 parents, 0 foster children, 2,414 other relatives, 6,889 non-relatives
- In group quarters: 22,809
Size of family households: 11,947 2-persons, 6,829 3-persons, 3,711 4-persons, 1,635 5-persons, 619 6-persons, 355 7-or-more-persons.
Size of nonfamily households: 22,571 1-person, 4,783 2-persons, 2,056 3-persons, 64 4-persons.
12,519 married couples with children.
8,193 single-parent households (1,815 men, 6,378 women).
91.4% of residents of Columbia speak English at home.
3.8% of residents speak Spanish at home (77% speak English very well, 16% speak English well, 6% speak English not well, 1% don't speak English at all).
2.3% of residents speak other Indo-European language at home (81% speak English very well, 11% speak English well, 8% speak English not well).
1.5% of residents speak Asian or Pacific Island language at home (76% speak English very well, 15% speak English well, 8% speak English not well).
0.8% of residents speak other language at home (89% speak English very well, 7% speak English well, 4% speak English not well).
Foreign born population: 6,385 (4.6%)
(38.4% of them are naturalized citizens)
| Here: | 6.9 |
| State: | 6.4 |
| Here: | 4.4 |
| State: | 4.5 |
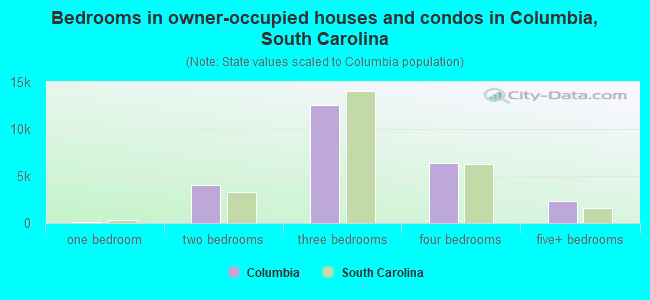
- Bedrooms in owner-occupied houses and condos in Columbia, South Carolina
- 68no bedroom
- 1591 bedroom
- 4,0732 bedrooms
- 12,6003 bedrooms
- 6,3784 bedrooms
- 2,3245+ bedrooms
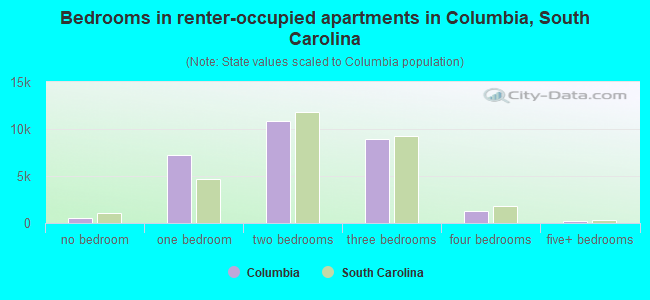
- Bedrooms in renter-occupied apartments in Columbia, South Carolina
- 551no bedroom
- 7,1951 bedroom
- 10,8262 bedrooms
- 8,8873 bedrooms
- 1,3054 bedrooms
- 2045+ bedrooms
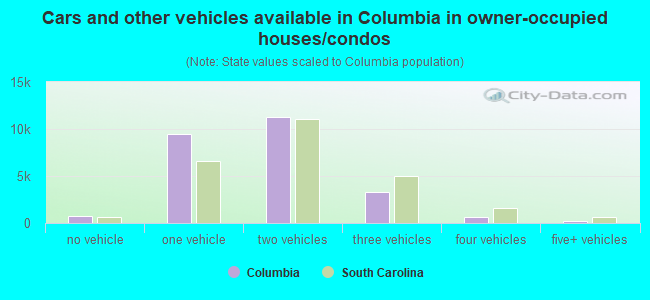
- Cars and other vehicles available in Columbia in owner-occupied houses/condos
- 720no vehicle
- 9,4161 vehicle
- 11,2962 vehicles
- 3,2453 vehicles
- 6714 vehicles
- 2545+ vehicles
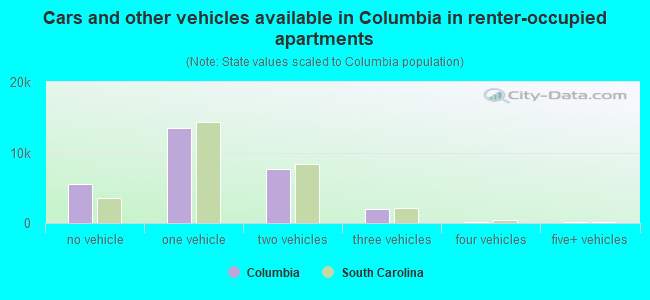
- Cars and other vehicles available in Columbia in renter-occupied apartments
- 5,494no vehicle
- 13,4631 vehicle
- 7,6182 vehicles
- 2,0453 vehicles
- 1944 vehicles
- 1545+ vehicles
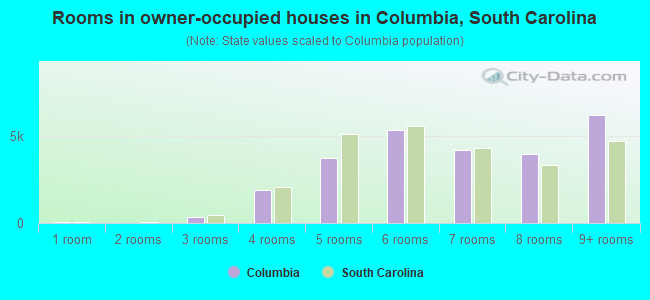
- Rooms in owner-occupied houses in Columbia, South Carolina
- 681 room
- 02 rooms
- 3503 rooms
- 1,8724 rooms
- 3,7155 rooms
- 5,3036 rooms
- 4,1707 rooms
- 3,9388 rooms
- 6,1869+ rooms
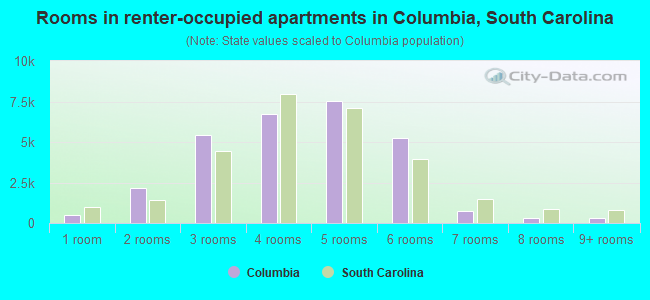
- Rooms in renter-occupied apartments in Columbia, South Carolina
- 4701 room
- 2,1862 rooms
- 5,4553 rooms
- 6,7134 rooms
- 7,5145 rooms
- 5,2316 rooms
- 7597 rooms
- 3188 rooms
- 3229+ rooms
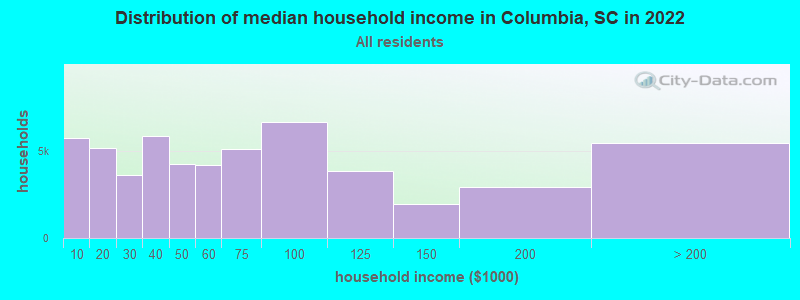
Columbia, SC household income distribution

- 5,705Less than $10,000
- 5,165$10,000 to $19,999
- 3,594$20,000 to $29,999
- 5,829$30,000 to $39,999
- 4,216$40,000 to $49,999
- 4,173$50,000 to $59,999
- 5,102$60,000 to $74,999
- 6,642$75,000 to $99,999
- 3,824$100,000 to $124,999
- 1,960$125,000 to $149,999
- 2,912$150,000 to $199,999
- 5,448$200,000 or more
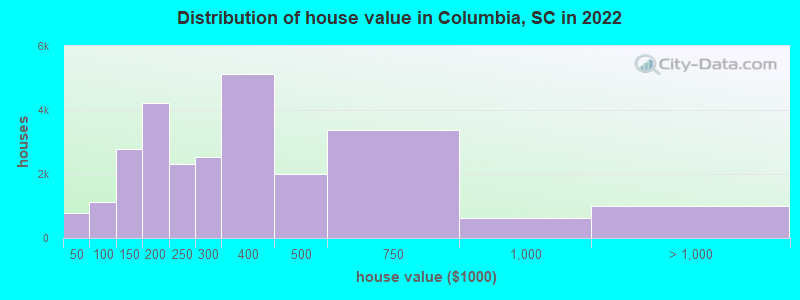
Home value of owner - occupied houses in 2022 in Columbia, SC
-
- 73Less than $10,000
- 166$10,000 to $14,999
- 279$15,000 to $19,999
- 32$20,000 to $24,999
- 245$40,000 to $49,999
- 47$50,000 to $59,999
- 72$60,000 to $69,999
- 483$80,000 to $89,999
- 265$90,000 to $99,999
- 1,616$100,000 to $124,999
- 1,154$125,000 to $149,999
- 2,994$150,000 to $174,999
- 1,229$175,000 to $199,999
- 2,306$200,000 to $249,999
- 2,538$250,000 to $299,999
- 5,117$300,000 to $399,999
- 1,987$400,000 to $499,999
- 3,366$500,000 to $749,999
- 628$750,000 to $999,999
- 554$1,000,000 to $1,499,999
- 108$1,500,000 to $1,999,999
- 343$2,000,000 or more
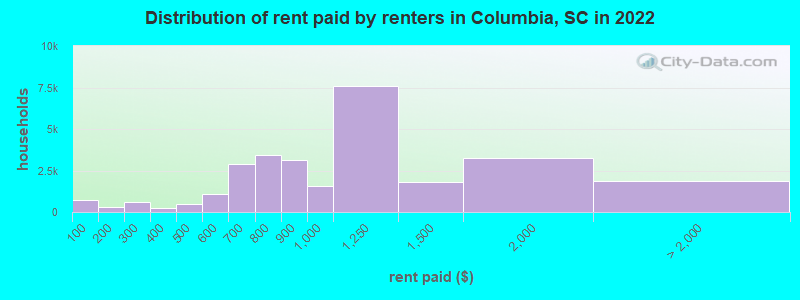
Rent paid by renters in 2022 in Columbia, SC
-
- 736Less than $100
- 110$100 to $149
- 167$150 to $199
- 207$200 to $249
- 409$250 to $299
- 118$300 to $349
- 93$350 to $399
- 183$400 to $449
- 321$450 to $499
- 741$500 to $549
- 356$550 to $599
- 1,548$600 to $649
- 1,319$650 to $699
- 2,324$700 to $749
- 1,126$750 to $799
- 3,110$800 to $899
- 1,560$900 to $999
- 7,597$1,000 to $1,249
- 1,781$1,250 to $1,499
- 3,272$1,500 to $1,999
- 946$2,000 to $2,499
- 32$2,500 to $2,999
- 27$3,000 to $3,499
- 885No cash rent
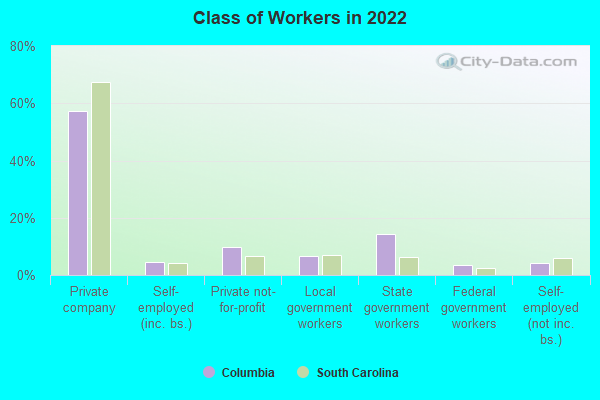
Percentage of workers working in this county: 81.6%
Number of people working at home: 7,913 (11.2% of all workers)
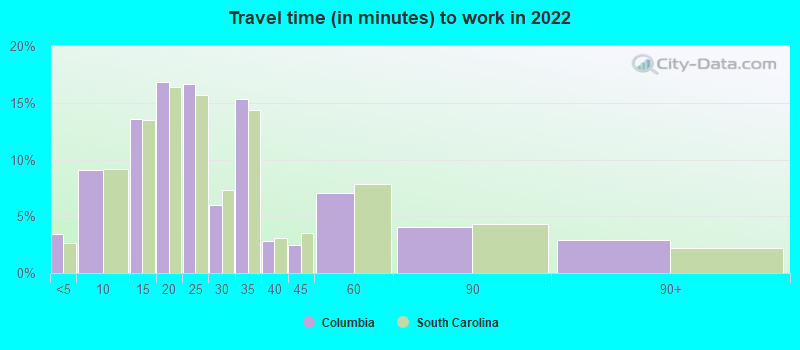
Travel time to work (commute)
- Less than 5 minutes: 4,587
- 5 to 9 minutes: 9,950
- 10 to 14 minutes: 12,601
- 15 to 19 minutes: 13,165
- 20 to 24 minutes: 8,773
- 25 to 29 minutes: 2,835
- 30 to 34 minutes: 4,143
- 35 to 39 minutes: 2,492
- 40 to 44 minutes: 447
- 45 to 59 minutes: 2,922
- 60 to 89 minutes: 631
- 90 or more minutes: 1,357
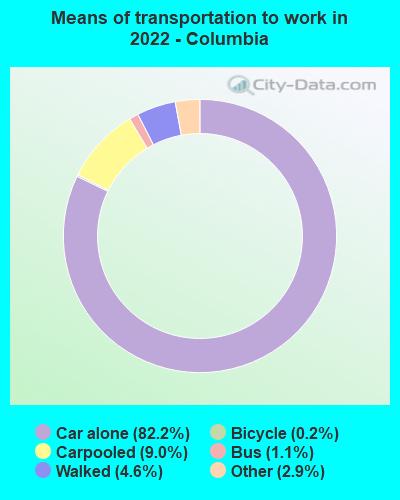
Means of transportation to work:
- Drove a car alone: 109,637 (77.4%)
- Carpooled: 11,968 (8.4%)
- Bus: 1,511 (1.1%)
- Taxi: 3,933 (2.8%)
- Bicycle: 240 (0.2%)
- Walked: 6,143 (4.3%)
- Worked at home: 8,226 (5.8%)
- Unemployment by race in 2022
- Unemployment rate for White non-Hispanic residents
- 4.3%Males
- 4.2%Females
- Unemployment rate for Black residents
- 12.4%Males
- 15.4%Females
- Unemployment rate for American Indian and Alaska Native residents
- 1.9%Males
- Unemployment rate for Asian residents
- 6.2%Females
- Unemployment rate for other race residents
- 6.1%Males
- 7.6%Females
- Unemployment rate for two or more race residents
- 0.9%Males
- 3.2%Females
- Unemployment rate for Hispanic or Latino residents
- 3.5%Males
- 2.5%Females
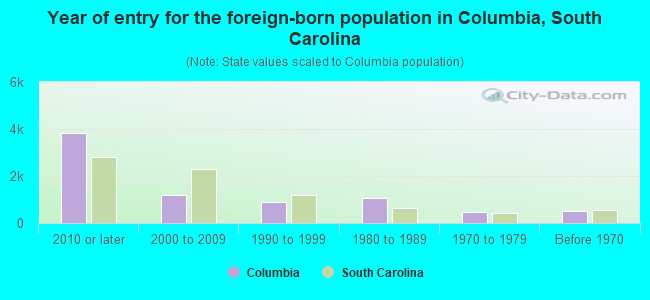
- Year of entry for the foreign-born population in Columbia, South Carolina
- 3,8192010 or later
- 1,1712000 to 2009
- 8871990 to 1999
- 1,0731980 to 1989
- 4501970 to 1979
- 492Before 1970
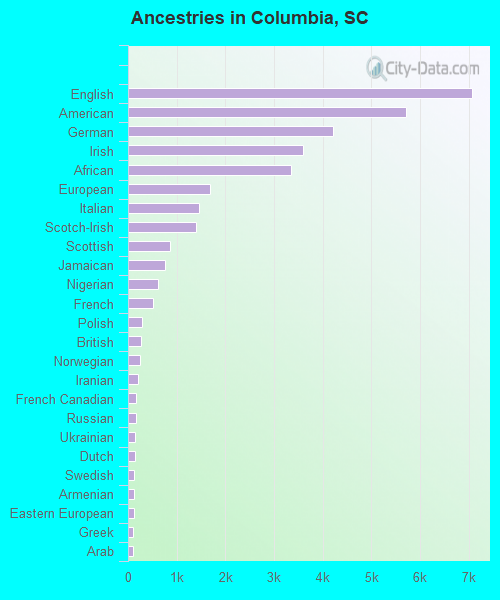
First ancestries reported:
- English: 7,067 (9.0%)
- American: 5,713 (7.3%)
- German: 4,209 (5.4%)
- Irish: 3,595 (4.6%)
- African: 3,353 (4.3%)
- European: 1,681 (2.1%)
- Italian: 1,462 (1.9%)
- Scotch-Irish: 1,393 (1.8%)
- Scottish: 871 (1.1%)
- Jamaican: 755 (1.0%)
- Nigerian: 613 (0.8%)
- French: 518 (0.7%)
- Polish: 294 (0.4%)
- British: 270 (0.3%)
- Norwegian: 250 (0.3%)
- Iranian: 210 (0.3%)
- French Canadian: 171 (0.2%)
- Russian: 170 (0.2%)
- Ukrainian: 153 (0.2%)
- Dutch: 147 (0.2%)
- Swedish: 128 (0.2%)
- Armenian: 123 (0.2%)
- Eastern European: 115 (0.1%)
- Greek: 106 (0.1%)
- Arab: 93 (0.1%)
- Lebanese: 90 (0.1%)
- Celtic: 89 (0.1%)
- Croatian: 88 (0.1%)
- Welsh: 88 (0.1%)
- Northern European: 82 (0.1%)
- Scandinavian: 76 (0.10%)
- Sudanese: 74 (0.09%)
- Bahamian: 74 (0.09%)
- Hungarian: 72 (0.09%)
- Ugandan: 72 (0.09%)
- Canadian: 69 (0.09%)
- Trinidadian and Tobagonian: 64 (0.08%)
- Romanian: 56 (0.07%)
- Swiss: 54 (0.07%)
- South African: 52 (0.07%)
- Cajun: 47 (0.06%)
- Ethiopian: 46 (0.06%)
- Czech: 46 (0.06%)
- Czechoslovakian: 46 (0.06%)
- Latvian: 44 (0.06%)
- Slovak: 43 (0.05%)
- Finnish: 40 (0.05%)
- Yugoslavian: 39 (0.05%)
- Palestinian: 38 (0.05%)
- Portuguese: 34 (0.04%)
- Haitian: 33 (0.04%)
- Turkish: 31 (0.04%)
- Danish: 28 (0.04%)
- Egyptian: 25 (0.03%)
- Cape Verdean: 24 (0.03%)
- Slovene: 24 (0.03%)
- Bulgarian: 20 (0.03%)
- Ghanaian: 18 (0.02%)
- British West Indian: 18 (0.02%)
- Moroccan: 16 (0.02%)
- Israeli: 15 (0.02%)
- Maltese: 13 (0.02%)
- Serbian: 11 (0.01%)
- Iraqi: 9 (0.01%)
- Belgian: 8 (0.01%)
- Albanian: 5 (0.01%)
- Belizean: 4 (0.01%)
Most common places of birth for foreign-born residents (%):
| Columbia: | 11.3% (727) |
| South Carolina: | 6.8% (18,307) |
| Columbia: | 7.8% (500) |
| South Carolina: | 2.6% (7,073) |
| Columbia: | 5.9% (381) |
| South Carolina: | 4.3% (11,533) |
| Columbia: | 5.8% (374) |
| South Carolina: | 3.2% (8,721) |
| Columbia: | 4.6% (296) |
| South Carolina: | 4.1% (11,031) |
| Columbia: | 4.3% (277) |
| South Carolina: | 22.5% (60,774) |
| Columbia: | 3.8% (245) |
| South Carolina: | 0.5% (1,270) |
| Columbia: | 3.7% (236) |
| South Carolina: | 3.0% (8,193) |
| Columbia: | 3.3% (214) |
| South Carolina: | 0.1% (348) |
| Columbia: | 3.3% (211) |
| South Carolina: | 0.9% (2,357) |
| Columbia: | 2.7% (173) |
| South Carolina: | 0.6% (1,652) |
| Columbia: | 2.4% (155) |
| South Carolina: | 3.7% (9,982) |
| Columbia: | 2.2% (139) |
| South Carolina: | 0.2% (445) |
| Columbia: | 1.7% (112) |
| South Carolina: | 0.2% (628) |
| Columbia: | 1.7% (110) |
| South Carolina: | 1.7% (4,513) |
| Columbia: | 1.7% (110) |
| South Carolina: | 0.5% (1,273) |
| Columbia: | 1.7% (108) |
| South Carolina: | 1.2% (3,296) |
Place of birth for U.S.-born residents:
- This state: 74,053
- Other state: 55,864
- Northeast: 13,149
- Midwest: 9,194
- South: 29,364
- West: 4,157
69.5% of Columbia residents lived in the same house 1 years ago.
Out of people who lived in different houses, 27.4% lived in this county.
Out of people who lived in different counties, 46.7% lived in South Carolina.
| Columbia: | 69.5% |
| State average: | 86.5% |
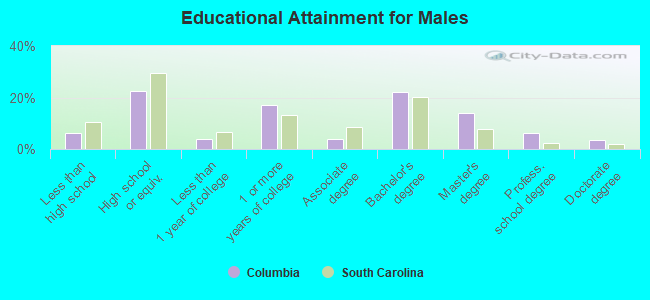
Education attainment for males 25 years and older:
- No schooling: 172
- Nursery to 4th grade: 0
- 5th and 6th grade: 76
- 7th and 8th grade: 314
- 9th grade: 252
- 10th grade: 381
- 11th grade: 704
- 12th grade, no diploma: 667
- High school graduate (or equivalency): 9,186
- Less than 1 year of college: 1,626
- Some college more than 1 year, no degree: 6,926
- Associate degree: 1,650
- Bachelor's degree: 9,034
- Master's degree: 5,616
- Professional school degree: 2,545
- Doctorate degree: 1,374
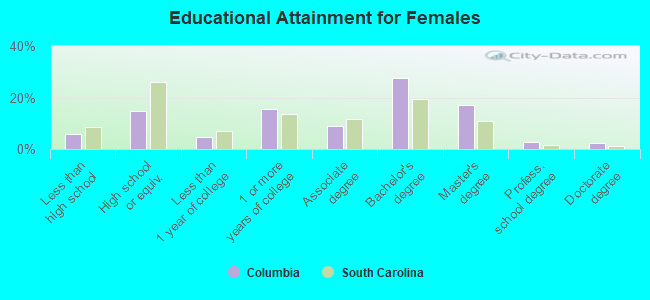
Education attainment for females 25 years and older:
- No schooling: 311
- Nursery to 4th grade: 59
- 5th and 6th grade: 219
- 7th and 8th grade: 75
- 9th grade: 191
- 10th grade: 488
- 11th grade: 444
- 12th grade, no diploma: 577
- High school graduate (or equivalency): 5,997
- Less than 1 year of college: 1,841
- Some college more than 1 year, no degree: 6,295
- Associate degree: 3,612
- Bachelor's degree: 11,105
- Master's degree: 6,920
- Professional school degree: 1,015
- Doctorate degree: 959
Housing units in structures:
- One, detached: 32,977
- One, attached: 4,541
- Two: 2,175
- 3 or 4: 3,654
- 5 to 9: 3,181
- 10 to 19: 4,427
- 20 to 49: 4,448
- 50 or more: 6,432
- Mobile homes: 652
Housing units lacking complete kitchen facilities in 2022: 0.9%
House/condo owner moved in on average 9 years ago
Renter moved in on average 0 years ago
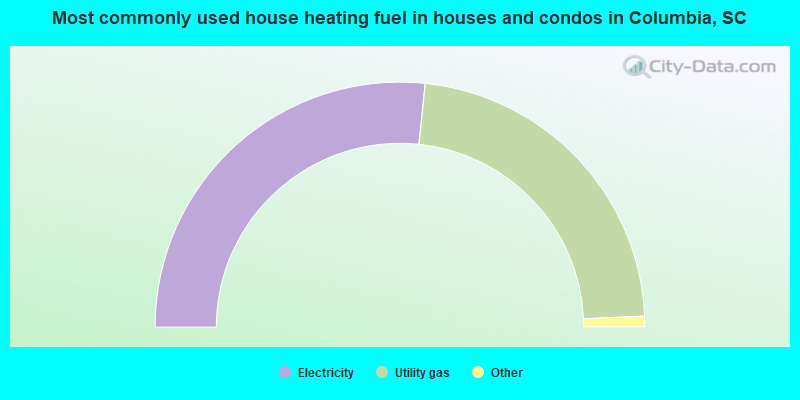
- 53.3%Electricity
- 45.3%Utility gas
- 1.0%Bottled, tank, or LP gas
- 0.2%Solar energy
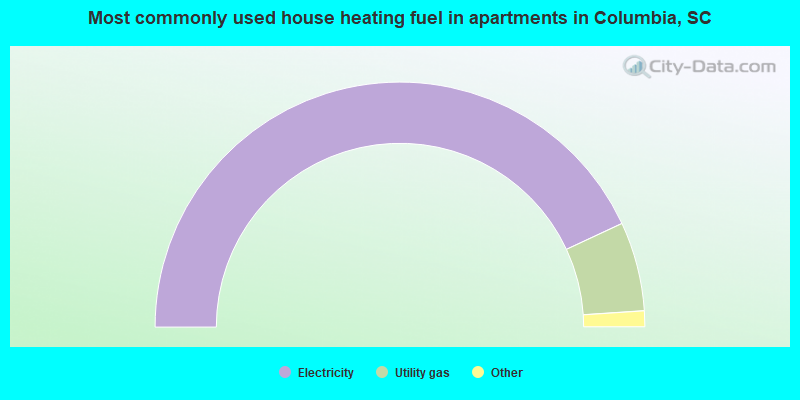
- 86.2%Electricity
- 11.8%Utility gas
- 1.1%No fuel used
- 0.7%Bottled, tank, or LP gas
- 0.2%Fuel oil, kerosene, etc.
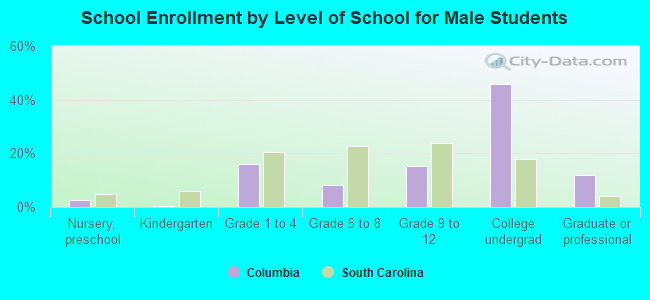
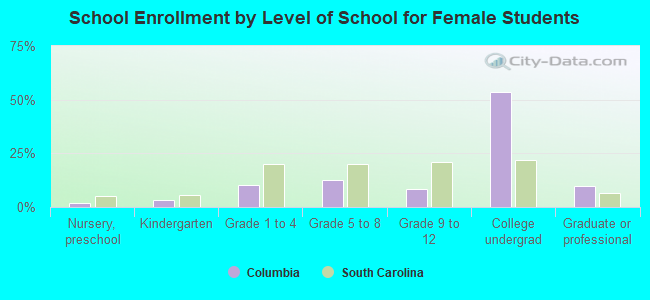
Private vs. public school enrollment:
| Here: | 28.0% |
| South Carolina: | 14.4% |
| Here: | 11.2% |
| South Carolina: | 11.1% |
| Here: | 12.7% |
| South Carolina: | 21.9% |