Cleburne, TX (Texas) Houses and Residents
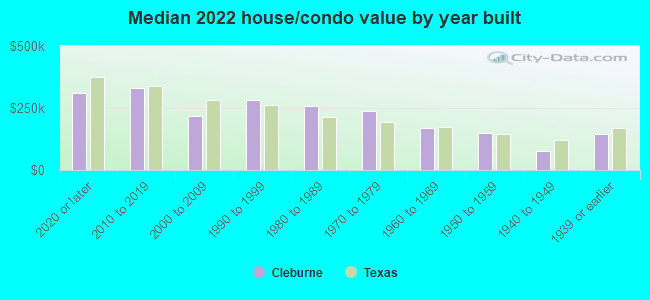
| Cleburne: | $217,232 |
| Texas: | $275,400 |
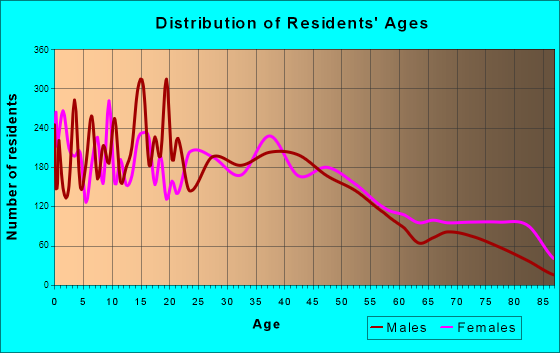
Total population: 29,848 (Urban population: 25,031 (all inside urban clusters), Rural population: 1,173 (17 farm, 1,156 nonfarm))
Houses: 12,731 (11,958 occupied: 7,188 owner occupied, 4,863 renter occupied)
| % of renters here: | 40% |
| State: | 38% |
Housing density: 458 houses/condos per square mile
Median price asked for vacant for-sale houses and condos in 2022: $166,237.
Median contract rent in 2022: $995 (lower quartile is $820, upper quartile is $1,128)
Median rent asked for vacant for-rent units in 2022: $742
Median gross rent in Cleburne, TX in 2022: $1,231
Housing units in Cleburne with a mortgage: 3,945 (244 second mortgage, 14 home equity loan, 123 both second mortgage and home equity loan)
Houses without a mortgage: 13
Median household income for houses/condos with a mortgage: $87,566
Median household income for apartments without a mortgage: $56,129
Median monthly housing costs: $1,202
Compare current foreclosures in Cleburne, TX:
| Photo | Address | Area | Beds / Baths | Price | Details |
|---|---|---|---|---|---|

|
#1
Downing Ln
Cleburne, TX 76031
|
3,661 sq. feet
|
3 baths 5 beds |
show details | |

|
#2
Spring Branch Dr
Cleburne, TX 76033
|
1,513 sq. feet
|
2 baths 3 beds |
show details | |

|
#3
Ridge Dr N
Cleburne, TX 76033
|
2,128 sq. feet
|
2 baths 4 beds |
show details | |

|
#4
Christine St
Cleburne, TX 76031
|
1,477 sq. feet
|
- baths - beds |
show details | |

|
#5
El Cerrito Ln
Cleburne, TX 76033
|
- sq. feet
|
- baths - beds |
show details | |

|
#6
County Road 1115
Cleburne, TX 76033
|
- sq. feet
|
- baths - beds |
show details | |

|
#7
County Road 414
Cleburne, TX 76031
|
- sq. feet
|
- baths - beds |
show details | |

|
#8
N Buffalo Ave
Cleburne, TX 76033
|
- sq. feet
|
- baths - beds |
show details | |

|
#9
E Highway 67, Lot 27
Cleburne, TX 76031
|
7,634 sq. feet
|
- baths - beds |
show details | |

|
#10
Dixon St
Cleburne, TX 76033
|
- sq. feet
|
- baths - beds |
show details |
| Photo | Address | Area | Beds / Baths | Price | Details |
|---|---|---|---|---|---|

|
#11
Briarwood Dr
Cleburne, TX 76033
|
1,615 sq. feet
|
- baths - beds |
show details | |

|
#12
Miss Mary Rd
Cleburne, TX 76031
|
- sq. feet
|
- baths - beds |
show details | |

|
#13
S Caddo St Apt B
Cleburne, TX 76031
|
- sq. feet
|
- baths - beds |
show details | |

|
#14
Creekwood Dr
Cleburne, TX 76033
|
- sq. feet
|
- baths - beds |
show details | |

|
#15
Featherston St
Cleburne, TX 76033
|
- sq. feet
|
- baths - beds |
show details | |

|
#16
N Pendell Ave
Cleburne, TX 76033
|
- sq. feet
|
- baths - beds |
show details | |

|
#17
Woodard Ave Apt 1414
Cleburne, TX 76033
|
- sq. feet
|
- baths - beds |
show details | |

|
#18
Bellevue Dr
Cleburne, TX 76033
|
- sq. feet
|
- baths - beds |
show details | |

|
#19
S Pendell Ave
Cleburne, TX 76033
|
1,132 sq. feet
|
- baths - beds |
show details | |

|
#20
County Road 425a
Cleburne, TX 76031
|
2,432 sq. feet
|
- baths - beds |
show details |
| Photo | Address | Area | Beds / Baths | Price | Details |
|---|---|---|---|---|---|

|
#21
Dublin Dr
Cleburne, TX 76033
|
- sq. feet
|
- baths - beds |
show details | |

|
#22
Nolan Ridge Dr
Cleburne, TX 76033
|
1,456 sq. feet
|
- baths - beds |
show details | |

|
#23
N Caddo St, Pmb 137
Cleburne, TX 76031
|
- sq. feet
|
- baths - beds |
show details | |

|
#24
County Road 417a
Cleburne, TX 76031
|
728 sq. feet
|
- baths - beds |
show details | |

|
#25
E Fm 916
Cleburne, TX 76031
|
1,468 sq. feet
|
- baths - beds |
show details | |

|
#26
Sausalito Trl
Cleburne, TX 76033
|
- sq. feet
|
- baths - beds |
show details | |

|
#27
County Road 801c # 111
Cleburne, TX 76031
|
- sq. feet
|
- baths - beds |
show details | |

|
#28
County Road 426
Cleburne, TX 76031
|
- sq. feet
|
- baths - beds |
show details | |

|
#29
N Caddo St, Pmb 137
Cleburne, TX 76031
|
- sq. feet
|
- baths - beds |
show details | |

|
#30
Mimosa St
Cleburne, TX 76033
|
- sq. feet
|
- baths - beds |
show details |
| Photo | Address | Area | Beds / Baths | Price | Details |
|---|---|---|---|---|---|

|
#31
County Road 415
Cleburne, TX 76031
|
2,794 sq. feet
|
- baths - beds |
show details | |

|
#32
County Road 1117
Cleburne, TX 76033
|
1,904 sq. feet
|
- baths - beds |
show details | |

|
#33
N Nolan River Rd Apt A
Cleburne, TX 76033
|
- sq. feet
|
- baths - beds |
show details | |

|
#34
Sausalito Trl
Cleburne, TX 76033
|
- sq. feet
|
- baths - beds |
show details | |

|
#35
Westcourt Dr
Cleburne, TX 76033
|
- sq. feet
|
- baths - beds |
show details | |

|
#36
County Road 1104
Cleburne, TX 76031
|
- sq. feet
|
- baths - beds |
show details | |

|
#37
Mimosa St
Cleburne, TX 76033
|
1,580 sq. feet
|
- baths - beds |
show details | |

|
#38
Peighton Dr
Cleburne, TX 76033
|
- sq. feet
|
- baths - beds |
show details | |

|
#39
Fremont Trl
Cleburne, TX 76033
|
- sq. feet
|
- baths - beds |
show details | |

|
#40
Davis St
Cleburne, TX 76033
|
1,512 sq. feet
|
- baths - beds |
show details |
| Photo | Address | Area | Beds / Baths | Price | Details |
|---|---|---|---|---|---|

|
#41
N Anglin St
Cleburne, TX 76031
|
- sq. feet
|
- baths - beds |
show details | |

|
#42
Jenny Dr
Cleburne, TX 76031
|
- sq. feet
|
- baths - beds |
show details | |

|
#43
Mansfield Rd
Cleburne, TX 76031
|
- sq. feet
|
- baths - beds |
show details | |

|
Check over 1 million property listings on Foreclosure.com!
|
browse all offers | |||

Latest news about housing in Cleburne, TX collected exclusively by city-data.com from local newspapers, TV, and radio stations

 | Moving to FW in 500k home range possibly? (8 replies) |
| Houston CORE developments thread (733 replies) |
| Short-term Rental Properties and/ or Apartments in Mansfield ISD (12 replies) |
| Seeking Affordable Alternatives to DFW Texas: Where are people moving? (47 replies) |
| People commuting from rural areas (49 replies) |
| Future of Southern and Eastern Suburbs? (43 replies) |
Median year apartment built: 1990
Household type by relationship:
Households: 34,083- Male householders: 6,037 (1,408 living alone), Female householders: 6,009 (1,667 living alone)
6,337 spouses (6,298 opposite-sex spouses), 709 unmarried partners, (695 opposite-sex unmarried partners), 10,616 children (9,410 natural, 646 adopted, 559 stepchildren), 1,041 grandchildren, 388 brothers or sisters, 682 parents, 22 foster children, 621 other relatives, 634 non-relatives
- In group quarters: 980
Size of family households: 3,143 2-persons, 2,017 3-persons, 1,488 4-persons, 827 5-persons, 594 6-persons, 152 7-or-more-persons.
Size of nonfamily households: 3,517 1-person, 369 2-persons, 44 3-persons, 26 4-persons.
6,035 married couples with children.
1,548 single-parent households (323 men, 1,225 women).
78.5% of residents of Cleburne speak English at home.
18.4% of residents speak Spanish at home (55% speak English very well, 25% speak English well, 16% speak English not well, 4% don't speak English at all).
0.2% of residents speak other Indo-European language at home (78% speak English very well, 22% speak English not well).
2.6% of residents speak Asian or Pacific Island language at home (50% speak English very well, 44% speak English well, 6% speak English not well).
Foreign born population: 2,868 (8.4%)
(35.3% of them are naturalized citizens)
| Here: | 5.9 |
| State: | 6.3 |
| Here: | 4.1 |
| State: | 4.0 |
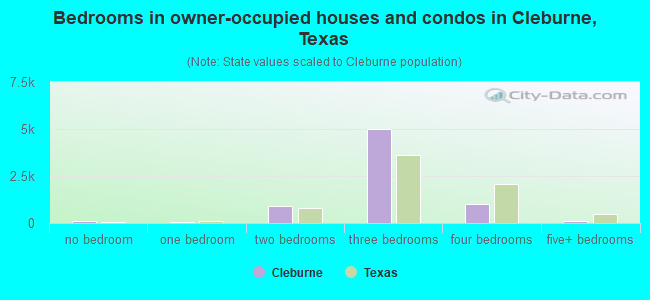
- Bedrooms in owner-occupied houses and condos in Cleburne, Texas
- 88no bedroom
- 431 bedroom
- 9282 bedrooms
- 5,0023 bedrooms
- 1,0064 bedrooms
- 1215+ bedrooms
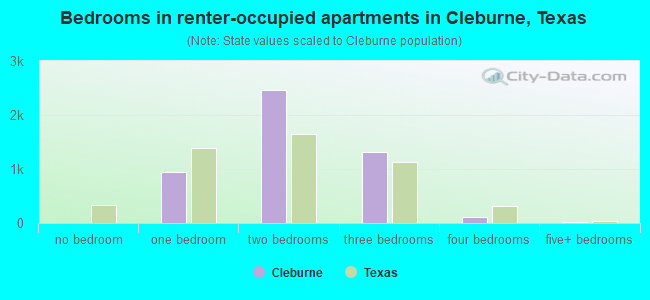
- Bedrooms in renter-occupied apartments in Cleburne, Texas
- 5no bedroom
- 9381 bedroom
- 2,4702 bedrooms
- 1,3173 bedrooms
- 1174 bedrooms
- 175+ bedrooms
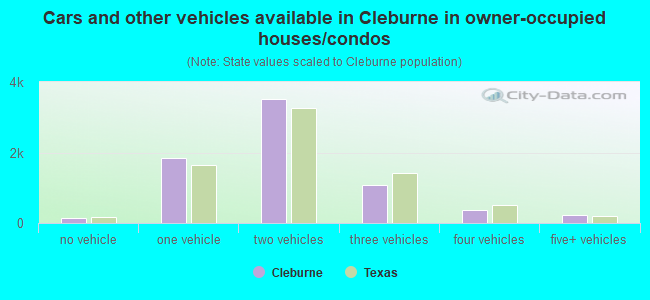
- Cars and other vehicles available in Cleburne in owner-occupied houses/condos
- 154no vehicle
- 1,8441 vehicle
- 3,5182 vehicles
- 1,0673 vehicles
- 3804 vehicles
- 2255+ vehicles
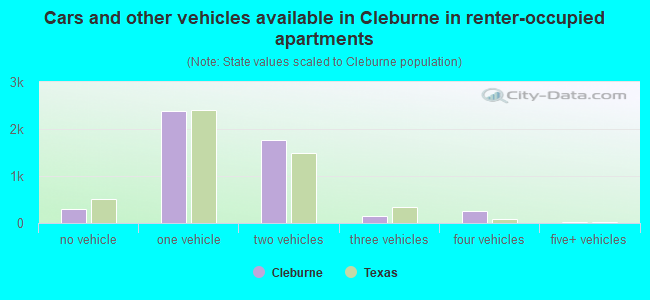
- Cars and other vehicles available in Cleburne in renter-occupied apartments
- 290no vehicle
- 2,3901 vehicle
- 1,7572 vehicles
- 1473 vehicles
- 2624 vehicles
- 175+ vehicles
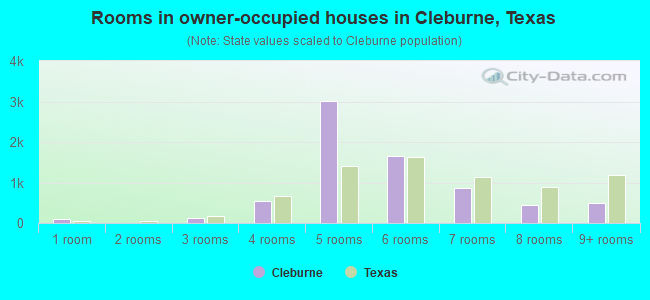
- Rooms in owner-occupied houses in Cleburne, Texas
- 881 room
- 02 rooms
- 1173 rooms
- 5464 rooms
- 3,0065 rooms
- 1,6446 rooms
- 8577 rooms
- 4438 rooms
- 4879+ rooms
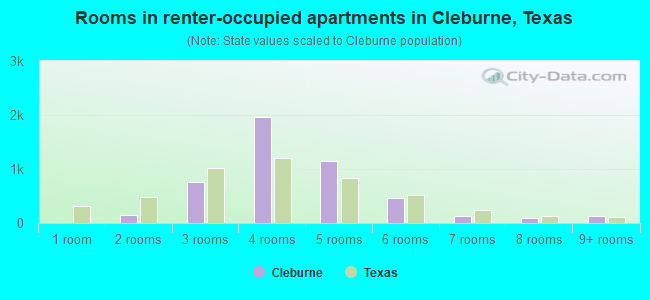
- Rooms in renter-occupied apartments in Cleburne, Texas
- 51 room
- 1482 rooms
- 7663 rooms
- 1,9724 rooms
- 1,1535 rooms
- 4726 rooms
- 1317 rooms
- 888 rooms
- 1289+ rooms
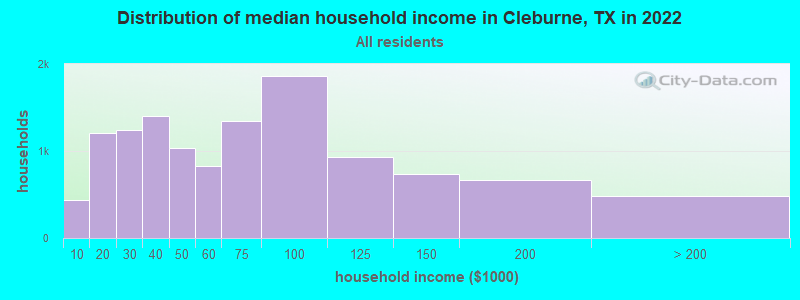
Cleburne, TX household income distribution

- 442Less than $10,000
- 1,210$10,000 to $19,999
- 1,245$20,000 to $29,999
- 1,401$30,000 to $39,999
- 1,032$40,000 to $49,999
- 824$50,000 to $59,999
- 1,345$60,000 to $74,999
- 1,860$75,000 to $99,999
- 927$100,000 to $124,999
- 733$125,000 to $149,999
- 667$150,000 to $199,999
- 488$200,000 or more
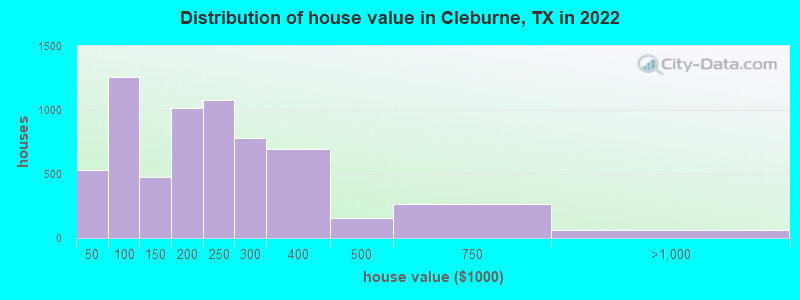
Home value of owner - occupied houses in 2022 in Cleburne, TX
-
- 223Less than $10,000
- 12$10,000 to $14,999
- 21$15,000 to $19,999
- 77$20,000 to $24,999
- 48$25,000 to $29,999
- 8$30,000 to $34,999
- 48$35,000 to $39,999
- 88$40,000 to $49,999
- 131$50,000 to $59,999
- 337$60,000 to $69,999
- 309$70,000 to $79,999
- 229$80,000 to $89,999
- 157$90,000 to $99,999
- 262$100,000 to $124,999
- 211$125,000 to $149,999
- 744$150,000 to $174,999
- 272$175,000 to $199,999
- 1,081$200,000 to $249,999
- 784$250,000 to $299,999
- 699$300,000 to $399,999
- 155$400,000 to $499,999
- 266$500,000 to $749,999
- 61$750,000 to $999,999
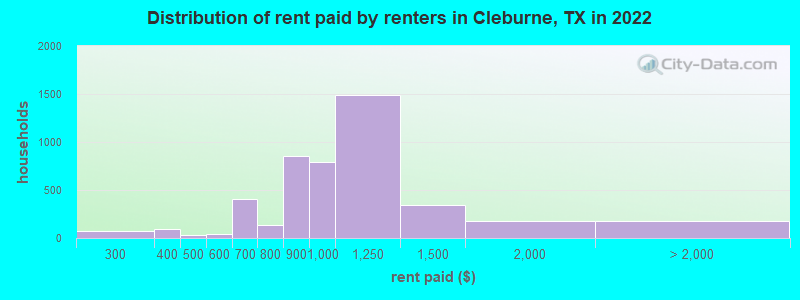
Rent paid by renters in 2022 in Cleburne, TX
-
- 13Less than $100
- 23$200 to $249
- 50$250 to $299
- 71$300 to $349
- 26$350 to $399
- 31$450 to $499
- 9$500 to $549
- 28$550 to $599
- 144$600 to $649
- 257$650 to $699
- 68$700 to $749
- 67$750 to $799
- 850$800 to $899
- 788$900 to $999
- 1,493$1,000 to $1,249
- 342$1,250 to $1,499
- 180$1,500 to $1,999
- 76$2,000 to $2,499
- 100No cash rent
Percentage of workers working in this county: 79.1%
Number of people working at home: 488 (3.3% of all workers)
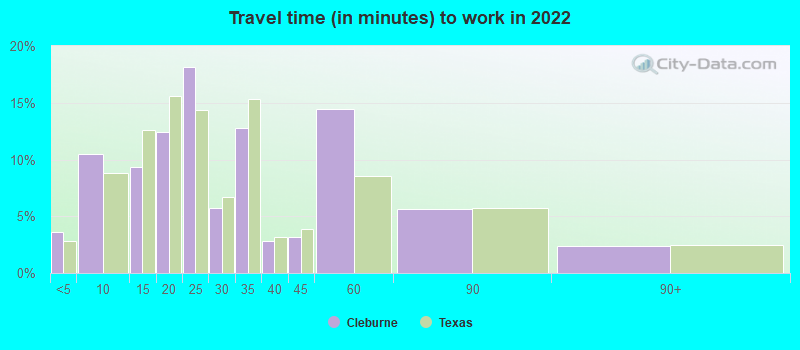
Travel time to work (commute)
- Less than 5 minutes: 668
- 5 to 9 minutes: 1,834
- 10 to 14 minutes: 1,802
- 15 to 19 minutes: 1,673
- 20 to 24 minutes: 2,639
- 25 to 29 minutes: 722
- 30 to 34 minutes: 1,630
- 35 to 39 minutes: 275
- 40 to 44 minutes: 445
- 45 to 59 minutes: 1,318
- 60 to 89 minutes: 733
- 90 or more minutes: 788
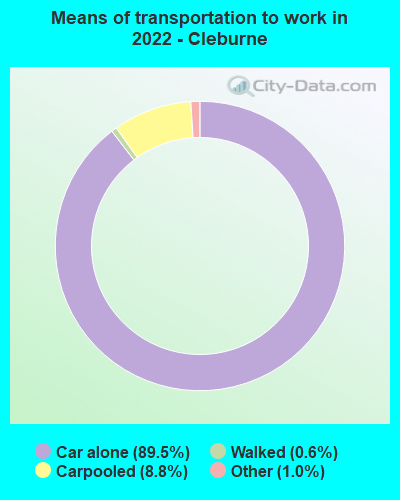
Means of transportation to work:
- Drove a car alone: 16,263 (83.3%)
- Carpooled: 1,744 (8.9%)
- Bus: 13 (0.1%)
- Taxi: 215 (1.1%)
- Bicycle: 5 (0.0%)
- Walked: 112 (0.6%)
- Worked at home: 488 (2.5%)
- Unemployment by race in 2022
- Unemployment rate for White non-Hispanic residents
- 5.0%Males
- 1.9%Females
- Unemployment rate for Black residents
- 0.1%Males
- 5.8%Females
- Unemployment rate for other race residents
- 1.5%Males
- Unemployment rate for two or more race residents
- 1.2%Females
- Unemployment rate for Hispanic or Latino residents
- 0.8%Males
- 3.8%Females
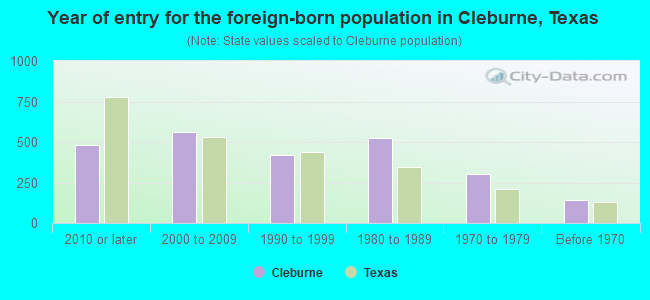
- Year of entry for the foreign-born population in Cleburne, Texas
- 4792010 or later
- 5602000 to 2009
- 4191990 to 1999
- 5261980 to 1989
- 3041970 to 1979
- 144Before 1970
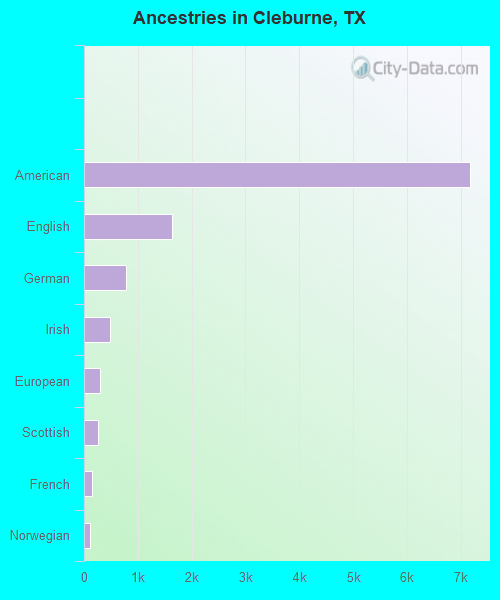
First ancestries reported:
- American: 7,167 (34.1%)
- English: 1,629 (7.7%)
- German: 787 (3.7%)
- Irish: 488 (2.3%)
- European: 305 (1.4%)
- Scottish: 253 (1.2%)
- French: 146 (0.7%)
- Norwegian: 109 (0.5%)
- African: 64 (0.3%)
- Italian: 57 (0.3%)
- Scotch-Irish: 49 (0.2%)
- Dutch: 25 (0.1%)
- French Canadian: 20 (0.10%)
- Polish: 19 (0.09%)
- Czech: 17 (0.08%)
- U.S. Virgin Islander: 17 (0.08%)
- West Indian: 17 (0.08%)
- Russian: 14 (0.07%)
- Latvian: 11 (0.05%)
- Welsh: 11 (0.05%)
- Belgian: 10 (0.05%)
- Northern European: 10 (0.05%)
- Eastern European: 9 (0.04%)
- Ukrainian: 9 (0.04%)
- Swedish: 7 (0.03%)
- Dutch West Indian: 7 (0.03%)
- Hungarian: 5 (0.02%)
- British: 4 (0.02%)
- Arab: 2 (0.01%)
Most common places of birth for foreign-born residents (%):
| Cleburne: | 71.1% (1,390) |
| Texas: | 48.4% (2,411,723) |
| Cleburne: | 4.4% (85) |
| Texas: | 0.1% (6,336) |
| Cleburne: | 4.2% (83) |
| Texas: | 3.7% (184,770) |
| Cleburne: | 2.1% (41) |
| Texas: | 0.2% (9,997) |
| Cleburne: | 2.0% (40) |
| Texas: | 0.0% (2,295) |
| Cleburne: | 1.9% (37) |
| Texas: | 0.4% (20,458) |
Place of birth for U.S.-born residents:
- This state: 23,696
- Other state: 6,920
- Northeast: 994
- Midwest: 1,152
- South: 2,826
- West: 2,053
89.1% of Cleburne residents lived in the same house 1 years ago.
Out of people who lived in different houses, 35.2% lived in this county.
Out of people who lived in different counties, 86.3% lived in Texas.
| Cleburne: | 89.1% |
| State average: | 85.7% |
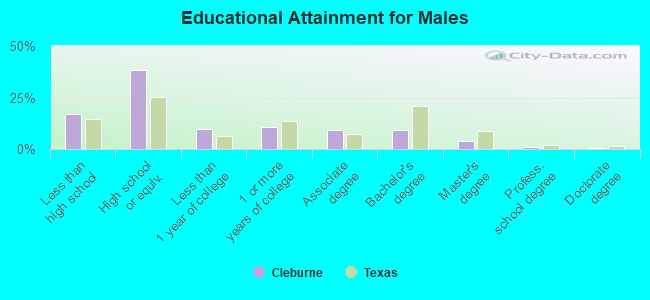
Education attainment for males 25 years and older:
- No schooling: 367
- Nursery to 4th grade: 72
- 5th and 6th grade: 125
- 7th and 8th grade: 191
- 9th grade: 121
- 10th grade: 87
- 11th grade: 430
- 12th grade, no diploma: 447
- High school graduate (or equivalency): 4,189
- Less than 1 year of college: 1,077
- Some college more than 1 year, no degree: 1,145
- Associate degree: 1,020
- Bachelor's degree: 1,015
- Master's degree: 428
- Professional school degree: 111
- Doctorate degree: 58
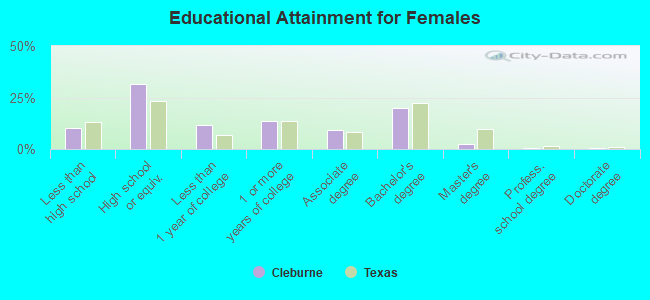
Education attainment for females 25 years and older:
- No schooling: 215
- Nursery to 4th grade: 76
- 5th and 6th grade: 78
- 7th and 8th grade: 79
- 9th grade: 204
- 10th grade: 127
- 11th grade: 138
- 12th grade, no diploma: 212
- High school graduate (or equivalency): 3,518
- Less than 1 year of college: 1,308
- Some college more than 1 year, no degree: 1,540
- Associate degree: 1,057
- Bachelor's degree: 2,252
- Master's degree: 274
- Professional school degree: 59
- Doctorate degree: 55
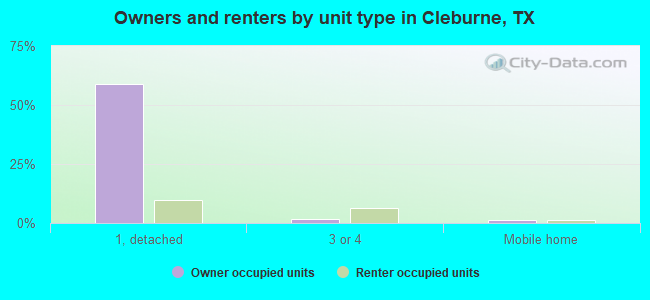
Housing units in structures:
- One, detached: 8,958
- One, attached: 315
- Two: 475
- 3 or 4: 815
- 5 to 9: 905
- 10 to 19: 373
- 20 to 49: 151
- 50 or more: 318
- Mobile homes: 351
- Boats, RVs, vans, etc.: 64
Median worth of mobile homes: $85,491
Housing units lacking complete kitchen facilities in 2022: 4.3%
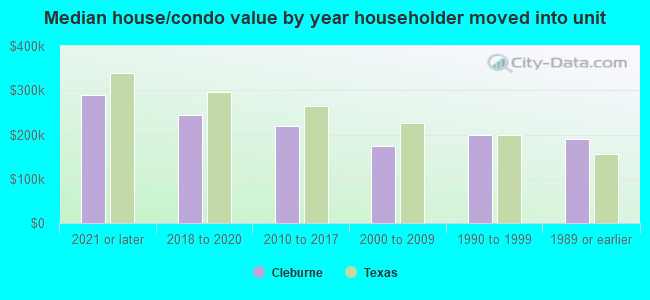
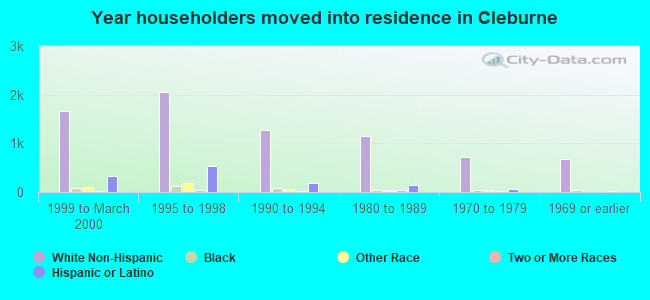
House/condo owner moved in on average 12 years ago
Renter moved in on average 4 years ago
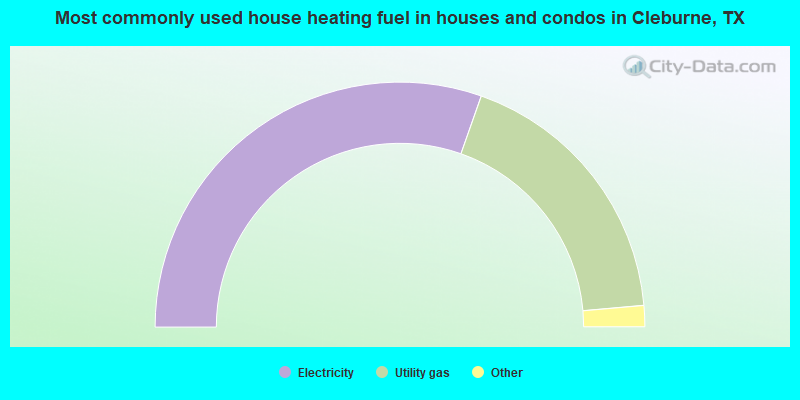
- 60.8%Electricity
- 36.4%Utility gas
- 1.1%Bottled, tank, or LP gas
- 0.7%No fuel used
- 0.6%Solar energy
- 0.3%Wood
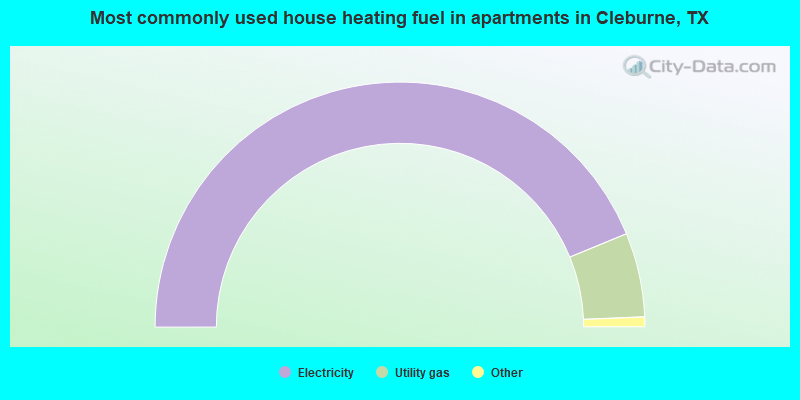
- 87.6%Electricity
- 11.1%Utility gas
- 1.1%No fuel used
- 0.2%Bottled, tank, or LP gas
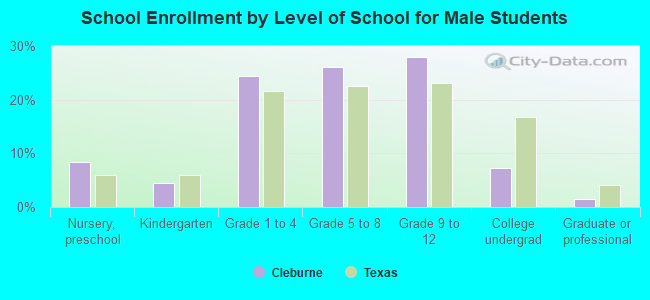
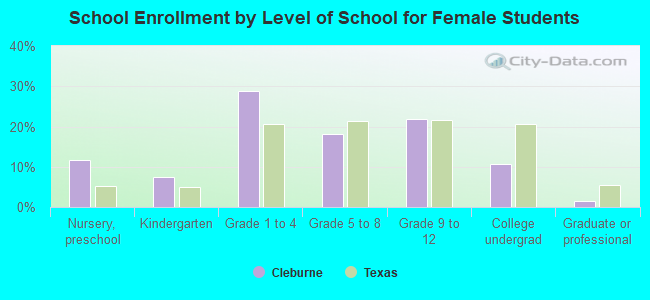
Private vs. public school enrollment:
| Here: | 16.2% |
| Texas: | 8.8% |
| Here: | 14.5% |
| Texas: | 8.0% |
| Here: | 12.1% |
| Texas: | 16.2% |