Races in Cleburne, Texas (TX) Detailed Stats
Data:
Races - White alone (%)
Races - White alone (% change since 2000)
Races - Black alone (%)
Races - Black alone (% change since 2000)
Races - American Indian alone (%)
Races - American Indian alone (% change since 2000)
Races - Asian alone (%)
Races - Asian alone (% change since 2000)
Races - Hispanic (%)
Races - Hispanic (% change since 2000)
Races - Native Hawaiian and Other Pacific Islander alone (%)
Races - Native Hawaiian and Other Pacific Islander alone (% change since 2000)
Races - Two or more races(%)
Races - Two or more races(% change since 2000)
Races - Other race alone (%)
Races - Other race alone (% change since 2000)
Racial diversity
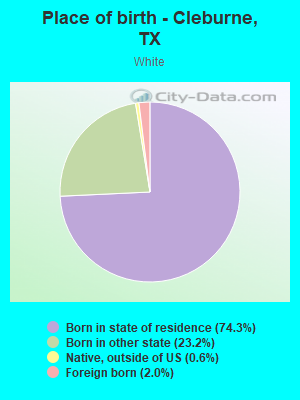
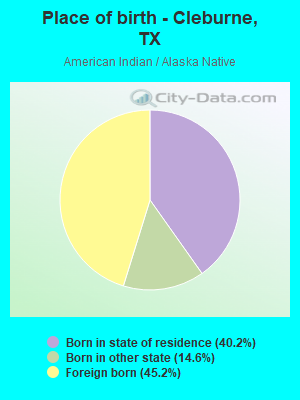
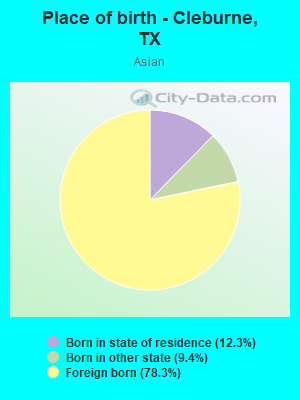
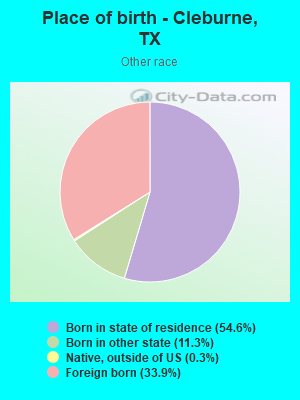
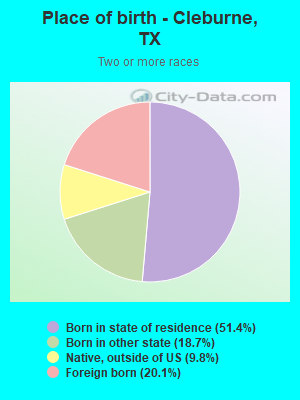
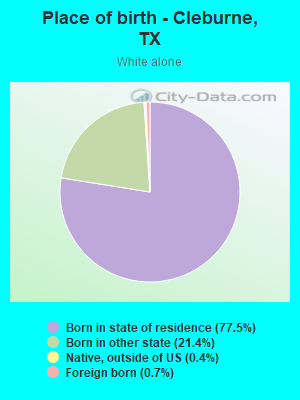
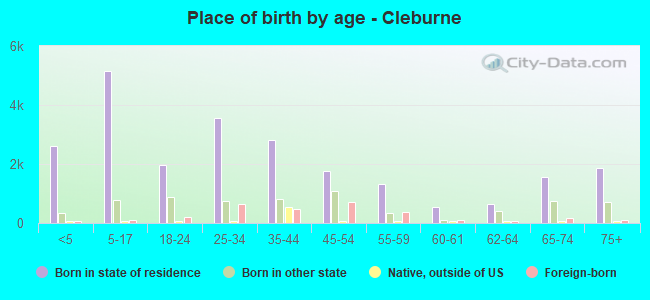
Place of birth - Born in state of residence (%)
Place of birth - Born in state of residence (%) - White
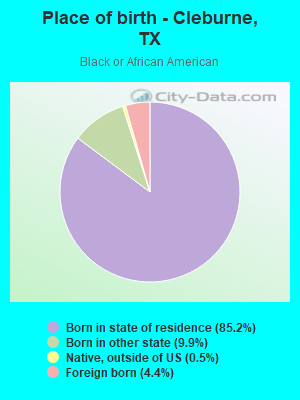
Place of birth - Born in state of residence (%) - Black or African American
Place of birth - Born in state of residence (%) - Asian
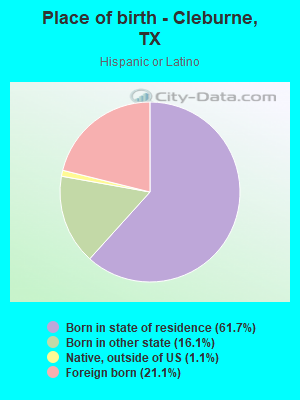
Place of birth - Born in state of residence (%) - Hispanic or Latino
Place of birth - Born in state of residence (%) - American Indian and Alaska Native
Place of birth - Born in state of residence (%) - Multirace
Place of birth - Born in state of residence (%) - Other Race
Place of birth - Born in other state (%)
Place of birth - Born in other state (%) - White
Place of birth - Born in other state (%) - Black or African American
Place of birth - Born in other state (%) - Asian
Place of birth - Born in other state (%) - Hispanic or Latino
Place of birth - Born in other state (%) - American Indian and Alaska Native
Place of birth - Born in other state (%) - Multirace
Place of birth - Born in other state (%) - Other Race
Place of birth - Native, outside of US (%)
Place of birth - Native, outside of US (%) - White
Place of birth - Native, outside of US (%) - Black or African American
Place of birth - Native, outside of US (%) - Asian
Place of birth - Native, outside of US (%) - Hispanic or Latino
Place of birth - Native, outside of US (%) - American Indian and Alaska Native
Place of birth - Native, outside of US (%) - Multirace
Place of birth - Native, outside of US (%) - Other Race
Place of birth - Foreign born (%)
Place of birth - Foreign born (%) - White
Place of birth - Foreign born (%) - Black or African American
Place of birth - Foreign born (%) - Asian
Place of birth - Foreign born (%) - Hispanic or Latino
Place of birth - Foreign born (%) - American Indian and Alaska Native
Place of birth - Foreign born (%) - Multirace
Place of birth - Foreign born (%) - Other Race
Residents speaking English at home (%)
Residents speaking English at home - Born in the United States (%)
Residents speaking English at home - Native, born elsewhere (%)
Residents speaking English at home - Foreign born (%)
Residents speaking Spanish at home (%)
Residents speaking Spanish at home - Born in the United States (%)
Residents speaking Spanish at home - Native, born elsewhere (%)
Residents speaking Spanish at home - Foreign born (%)
Residents speaking other language at home (%)
Residents speaking other language at home - Born in the United States (%)
Residents speaking other language at home - Native, born elsewhere (%)
Residents speaking other language at home - Foreign born (%)
Marital status - Never married (%)
Marital status - Now married (%)
Marital status - Separated (%)
Marital status - Widowed (%)
Marital status - Divorced (%)
Ancestries Reported - Arab (%)
Ancestries Reported - Czech (%)
Ancestries Reported - Danish (%)
Ancestries Reported - Dutch (%)
Ancestries Reported - English (%)
Ancestries Reported - French (%)
Ancestries Reported - French Canadian (%)
Ancestries Reported - German (%)
Ancestries Reported - Greek (%)
Ancestries Reported - Hungarian (%)
Ancestries Reported - Irish (%)
Ancestries Reported - Italian (%)
Ancestries Reported - Lithuanian (%)
Ancestries Reported - Norwegian (%)
Ancestries Reported - Polish (%)
Ancestries Reported - Portuguese (%)
Ancestries Reported - Russian (%)
Ancestries Reported - Scotch-Irish (%)
Ancestries Reported - Scottish (%)
Ancestries Reported - Slovak (%)
Ancestries Reported - Subsaharan African (%)
Ancestries Reported - Swedish (%)
Ancestries Reported - Swiss (%)
Ancestries Reported - Ukrainian (%)
Ancestries Reported - United States (%)
Ancestries Reported - Welsh (%)
Ancestries Reported - West Indian (%)
Ancestries Reported - Other (%)
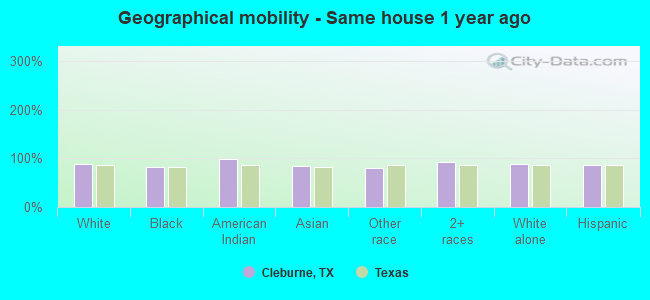
Geographical mobility - Same house 1 year ago (%)
Geographical mobility - Same house 1 year ago (%) - White
Geographical mobility - Same house 1 year ago (%) - Black or African American
Geographical mobility - Same house 1 year ago (%) - Asian
Geographical mobility - Same house 1 year ago (%) - Hispanic or Latino
Geographical mobility - Same house 1 year ago (%) - American Indian and Alaska Native
Geographical mobility - Same house 1 year ago (%) - Multirace
Geographical mobility - Same house 1 year ago (%) - Other Race
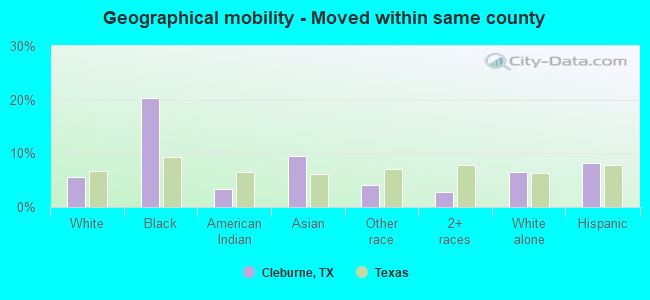
Geographical mobility - Moved within same county (%)
Geographical mobility - Moved within same county (%) - White
Geographical mobility - Moved within same county (%) - Black or African American
Geographical mobility - Moved within same county (%) - Asian
Geographical mobility - Moved within same county (%) - Hispanic or Latino
Geographical mobility - Moved within same county (%) - American Indian and Alaska Native
Geographical mobility - Moved within same county (%) - Multirace
Geographical mobility - Moved within same county (%) - Other Race
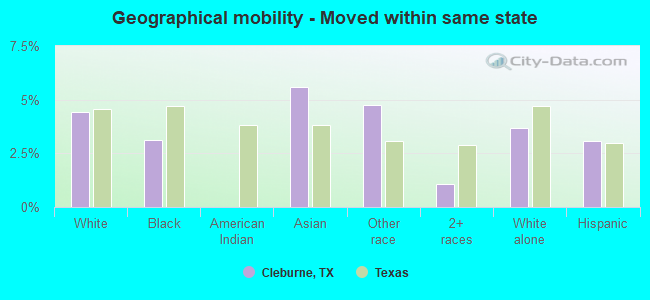
Geographical mobility - Moved from different county within same state (%)
Geographical mobility - Moved from different county within same state (%) - White
Geographical mobility - Moved from different county within same state (%) - Black or African American
Geographical mobility - Moved from different county within same state (%) - Asian
Geographical mobility - Moved from different county within same state (%) - Hispanic or Latino
Geographical mobility - Moved from different county within same state (%) - American Indian and Alaska Native
Geographical mobility - Moved from different county within same state (%) - Multirace
Geographical mobility - Moved from different county within same state (%) - Other Race
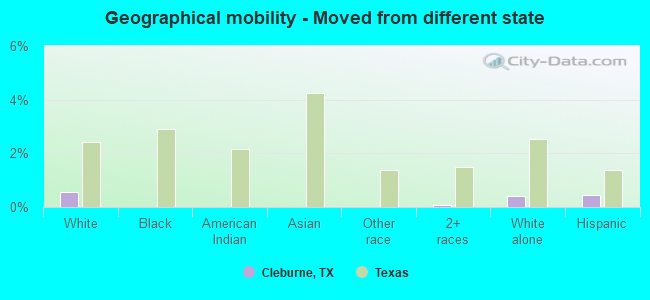
Geographical mobility - Moved from different state (%)
Geographical mobility - Moved from different state (%) - White
Geographical mobility - Moved from different state (%) - Black or African American
Geographical mobility - Moved from different state (%) - Asian
Geographical mobility - Moved from different state (%) - Hispanic or Latino
Geographical mobility - Moved from different state (%) - American Indian and Alaska Native
Geographical mobility - Moved from different state (%) - Multirace
Geographical mobility - Moved from different state (%) - Other Race
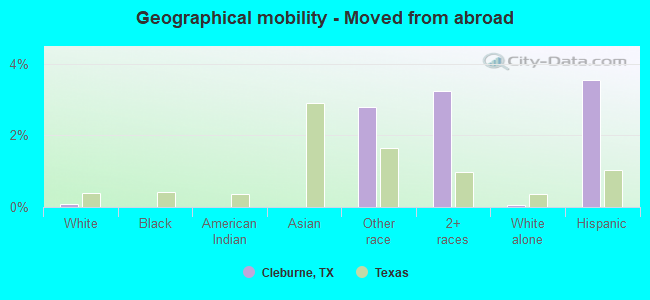
Geographical mobility - Moved from abroad (%)
Geographical mobility - Moved from abroad (%) - White
Geographical mobility - Moved from abroad (%) - Black or African American
Geographical mobility - Moved from abroad (%) - Asian
Geographical mobility - Moved from abroad (%) - Hispanic or Latino
Geographical mobility - Moved from abroad (%) - American Indian and Alaska Native
Geographical mobility - Moved from abroad (%) - Multirace
Geographical mobility - Moved from abroad (%) - Other Race
Place of birth for the foreign-born population - Ireland (%)
Place of birth for the foreign-born population - Denmark (%)
Place of birth for the foreign-born population - Norway (%)
Place of birth for the foreign-born population - Sweden (%)
Place of birth for the foreign-born population - United Kingdom (%)
Place of birth for the foreign-born population - England (%)
Place of birth for the foreign-born population - Scotland (%)
Place of birth for the foreign-born population - Other Northern Europe (%)
Place of birth for the foreign-born population - Austria (%)
Place of birth for the foreign-born population - Belgium (%)
Place of birth for the foreign-born population - France (%)
Place of birth for the foreign-born population - Germany (%)
Place of birth for the foreign-born population - Netherlands (%)
Place of birth for the foreign-born population - Switzerland (%)
Place of birth for the foreign-born population - Other Western Europe (%)
Place of birth for the foreign-born population - Greece (%)
Place of birth for the foreign-born population - Italy (%)
Place of birth for the foreign-born population - Portugal (%)
Place of birth for the foreign-born population - Spain (%)
Place of birth for the foreign-born population - Other Southern Europe (%)
Place of birth for the foreign-born population - Albania (%)
Place of birth for the foreign-born population - Belarus (%)
Place of birth for the foreign-born population - Bosnia and Herzegovina (%)
Place of birth for the foreign-born population - Bulgaria (%)
Place of birth for the foreign-born population - Croatia (%)
Place of birth for the foreign-born population - Czechoslovakia (%)
Place of birth for the foreign-born population - Hungary (%)
Place of birth for the foreign-born population - Latvia (%)
Place of birth for the foreign-born population - Lithuania (%)
Place of birth for the foreign-born population - North Macedonia (Macedonia) (%)
Place of birth for the foreign-born population - Moldova (%)
Place of birth for the foreign-born population - Poland (%)
Place of birth for the foreign-born population - Romania (%)
Place of birth for the foreign-born population - Russia (%)
Place of birth for the foreign-born population - Serbia (%)
Place of birth for the foreign-born population - Ukraine (%)
Place of birth for the foreign-born population - Other Eastern Europe (%)
Place of birth for the foreign-born population - China (%)
Place of birth for the foreign-born population - Hong Kong (%)
Place of birth for the foreign-born population - Taiwan (%)
Place of birth for the foreign-born population - Japan (%)
Place of birth for the foreign-born population - Korea (%)
Place of birth for the foreign-born population - Other Eastern Asia (%)
Place of birth for the foreign-born population - Afghanistan (%)
Place of birth for the foreign-born population - Bangladesh (%)
Place of birth for the foreign-born population - India (%)
Place of birth for the foreign-born population - Iran (%)
Place of birth for the foreign-born population - Kazakhstan (%)
Place of birth for the foreign-born population - Nepal (%)
Place of birth for the foreign-born population - Pakistan (%)
Place of birth for the foreign-born population - Sri Lanka (%)
Place of birth for the foreign-born population - Uzbekistan (%)
Place of birth for the foreign-born population - Other South Central Asia (%)
Place of birth for the foreign-born population - Burma (%)
Place of birth for the foreign-born population - Cambodia (%)
Place of birth for the foreign-born population - Indonesia (%)
Place of birth for the foreign-born population - Laos (%)
Place of birth for the foreign-born population - Malaysia (%)
Place of birth for the foreign-born population - Philippines (%)
Place of birth for the foreign-born population - Singapore (%)
Place of birth for the foreign-born population - Thailand (%)
Place of birth for the foreign-born population - Vietnam (%)
Place of birth for the foreign-born population - Other South Eastern Asia (%)
Place of birth for the foreign-born population - Armenia (%)
Place of birth for the foreign-born population - Iraq (%)
Place of birth for the foreign-born population - Israel (%)
Place of birth for the foreign-born population - Jordan (%)
Place of birth for the foreign-born population - Kuwait (%)
Place of birth for the foreign-born population - Lebanon (%)
Place of birth for the foreign-born population - Saudi Arabia (%)
Place of birth for the foreign-born population - Syria (%)
Place of birth for the foreign-born population - Turkey (%)
Place of birth for the foreign-born population - Yemen (%)
Place of birth for the foreign-born population - Other Western Asia (%)
Place of birth for the foreign-born population - Eritrea (%)
Place of birth for the foreign-born population - Ethiopia (%)
Place of birth for the foreign-born population - Kenya (%)
Place of birth for the foreign-born population - Somalia (%)
Place of birth for the foreign-born population - Uganda (%)
Place of birth for the foreign-born population - Zimbabwe (%)
Place of birth for the foreign-born population - Other Eastern Africa (%)
Place of birth for the foreign-born population - Cameroon (%)
Place of birth for the foreign-born population - Congo (%)
Place of birth for the foreign-born population - Democratic Republic of Congo (Zaire) (%)
Place of birth for the foreign-born population - Other Middle Africa (%)
Place of birth for the foreign-born population - Egypt (%)
Place of birth for the foreign-born population - Morocco (%)
Place of birth for the foreign-born population - Sudan (%)
Place of birth for the foreign-born population - Other Northern Africa (%)
Place of birth for the foreign-born population - South Africa (%)
Place of birth for the foreign-born population - Other Southern Africa (%)
Place of birth for the foreign-born population - Cabo Verde (%)
Place of birth for the foreign-born population - Ghana (%)
Place of birth for the foreign-born population - Liberia (%)
Place of birth for the foreign-born population - Nigeria (%)
Place of birth for the foreign-born population - Senegal (%)
Place of birth for the foreign-born population - Sierra Leone (%)
Place of birth for the foreign-born population - Other Western Africa (%)
Place of birth for the foreign-born population - Australia (%)
Place of birth for the foreign-born population - New Zealand (%)
Place of birth for the foreign-born population - Fiji (%)
Place of birth for the foreign-born population - Micronesia (%)
Place of birth for the foreign-born population - Bahamas (%)
Place of birth for the foreign-born population - Barbados (%)
Place of birth for the foreign-born population - Cuba (%)
Place of birth for the foreign-born population - Dominica (%)
Place of birth for the foreign-born population - Dominican Republic (%)
Place of birth for the foreign-born population - Grenada (%)
Place of birth for the foreign-born population - Haiti (%)
Place of birth for the foreign-born population - Jamaica (%)
Place of birth for the foreign-born population - St. Vincent and the Grenadines (%)
Place of birth for the foreign-born population - Trinidad and Tobago (%)
Place of birth for the foreign-born population - West Indies (%)
Place of birth for the foreign-born population - Other Caribbean (%)
Place of birth for the foreign-born population - Belize (%)
Place of birth for the foreign-born population - Costa Rica (%)
Place of birth for the foreign-born population - El Salvador (%)
Place of birth for the foreign-born population - Guatemala (%)
Place of birth for the foreign-born population - Honduras (%)
Place of birth for the foreign-born population - Mexico (%)
Place of birth for the foreign-born population - Nicaragua (%)
Place of birth for the foreign-born population - Panama (%)
Place of birth for the foreign-born population - Other Central America (%)
Place of birth for the foreign-born population - Argentina (%)
Place of birth for the foreign-born population - Bolivia (%)
Place of birth for the foreign-born population - Brazil (%)
Place of birth for the foreign-born population - Chile (%)
Place of birth for the foreign-born population - Colombia (%)
Place of birth for the foreign-born population - Ecuador (%)
Place of birth for the foreign-born population - Guyana (%)
Place of birth for the foreign-born population - Peru (%)
Place of birth for the foreign-born population - Uruguay (%)
Place of birth for the foreign-born population - Venezuela (%)
Place of birth for the foreign-born population - Other South America (%)
Place of birth for the foreign-born population - Canada (%)
Place of birth for the foreign-born population - Other Northern America (%)
Place of birth for the foreign-born population - Other (%)
Latest news about races in Cleburne, TX collected exclusively by city-data.com from local newspapers, TV, and radio stations
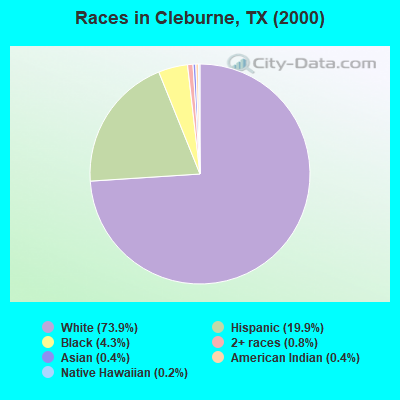
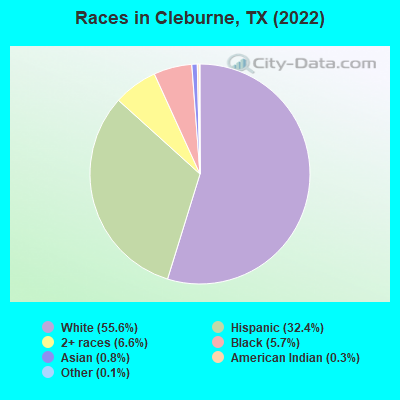
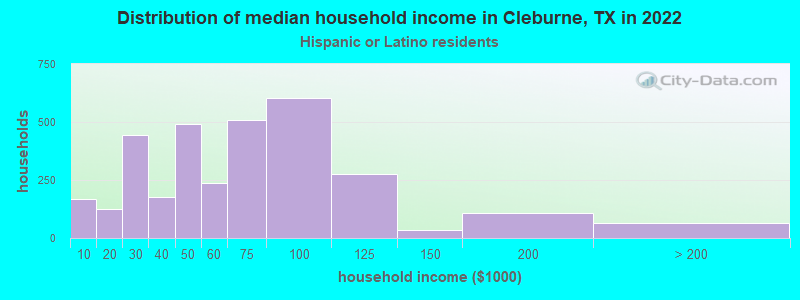
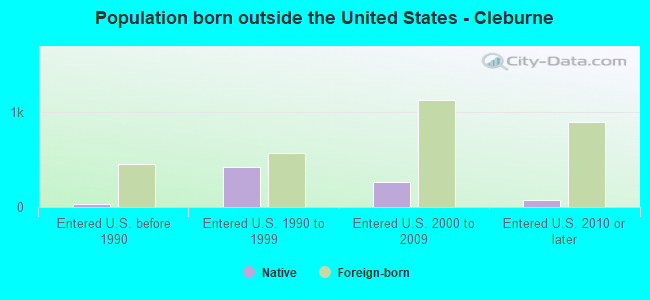
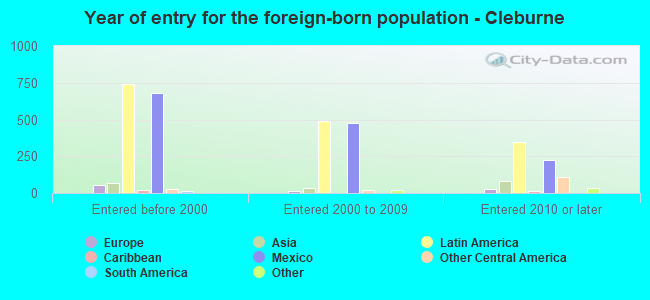
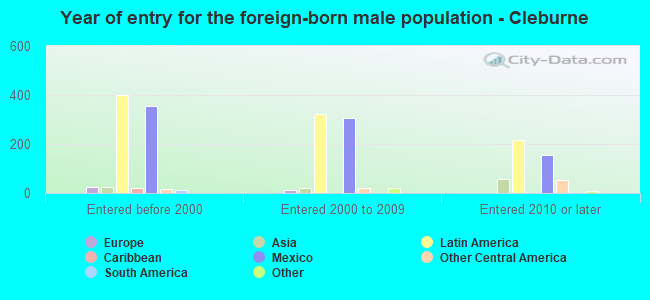
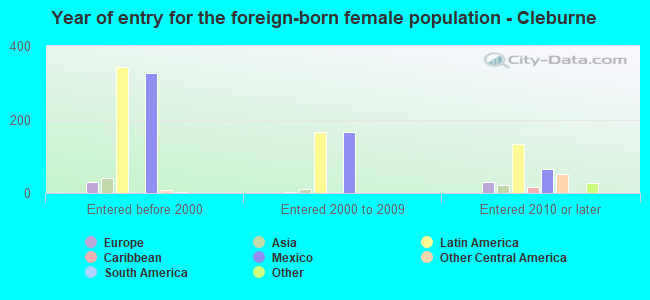
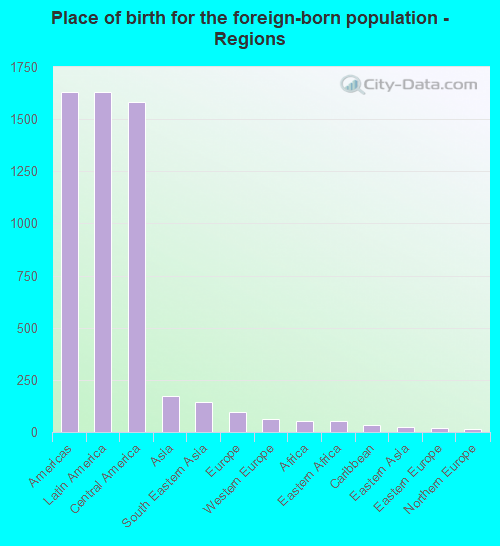
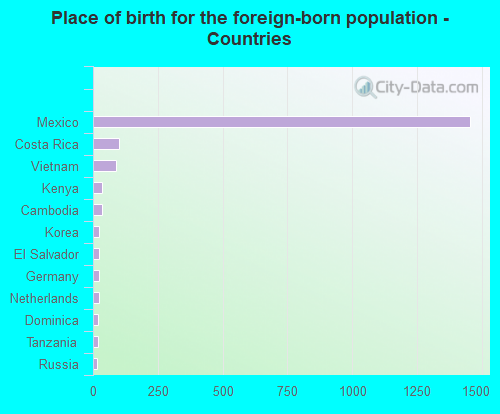
According to 2022 data, the most numerous races in Cleburne, TX are Hispanic (11,046 residents), White alone (18,952 residents), and Black alone (1,947 residents). 76.0% of Cleburne residents speak English at home. 5.7% of Cleburne, TX residents are foreign-born (4.9% born in Latin America), which is 196.5% less than the foreign-born rate of 17.0% across the entire state of Texas.
Race distribution in Cleburne
2000 2022
10,933,313 52.4% White alone 6,669,666 32.0% Hispanic 2,364,255 11.3% Black alone 554,445 2.7% Asian alone 230,567 1.1% Two or more races 68,859 0.3% American Indian alone 19,958 0.10% Other race alone 10,757 0.05% Native Hawaiian and Other
12,070,642 40.2% Hispanic 11,683,430 38.9% White alone 3,508,706 11.7% Black alone 1,608,173 5.4% Asian alone 956,560 3.2% Two or more races 125,763 0.4% Other race alone 47,023 0.2% American Indian alone 29,275 0.10% Native Hawaiian and Other
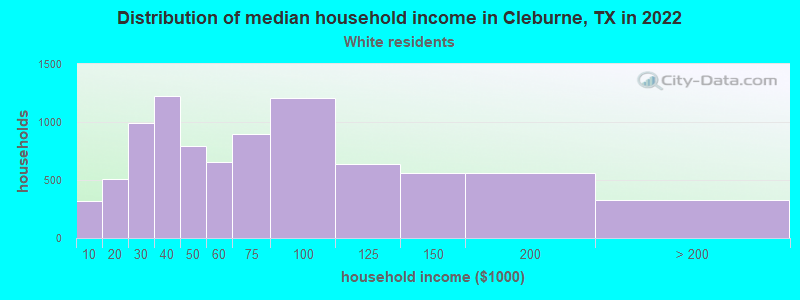
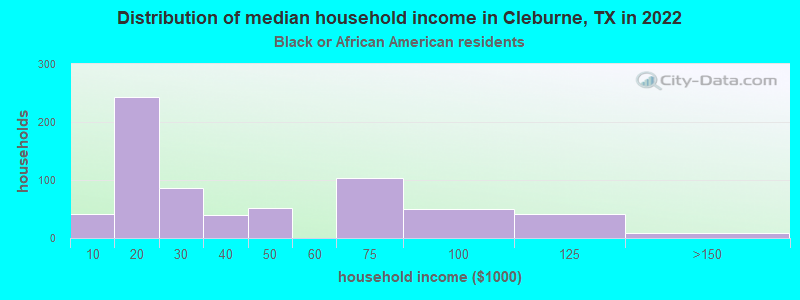
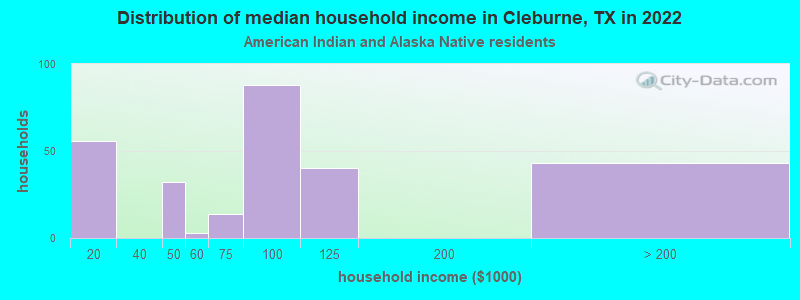
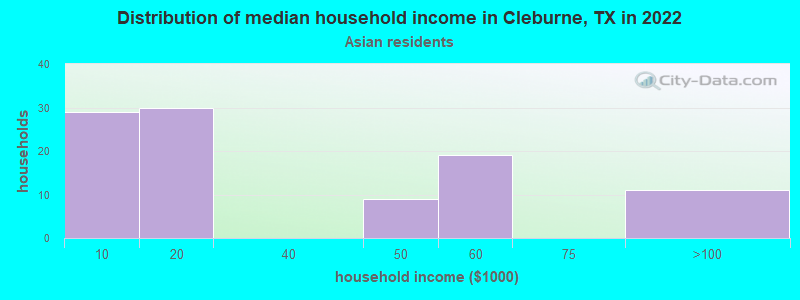
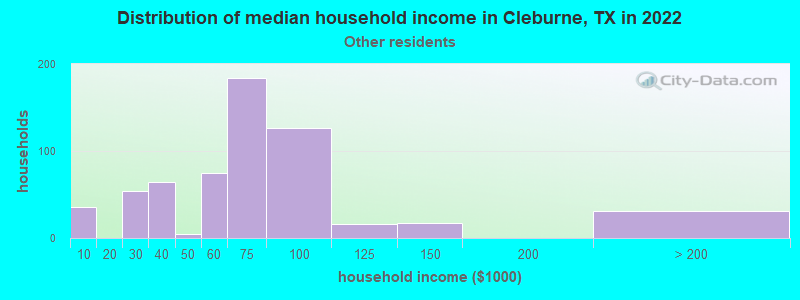
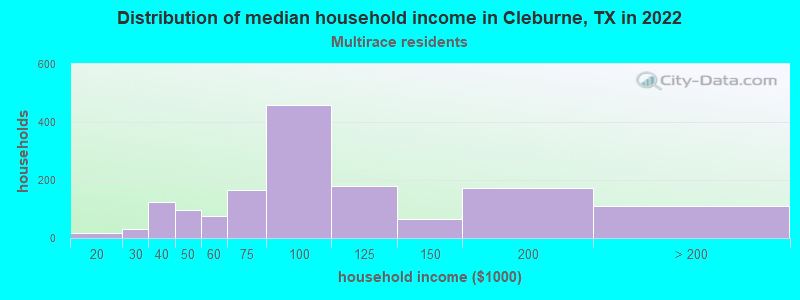
Income and house value in Cleburne Median household income in 2022 $64,263 White non-Hispanic householders$22,926 Black householders$81,073 American Indian and Alaska Native householders$61,313 Some other race householders$79,082 Two or more races householders$54,321 Hispanic or Latino race householdersMedian 2022 house value $231,624 White Non-Hispanic householders$137,568 Black or African American householders$75,311 American Indian or Alaska Native householders $110,456 Asian householders$150,622 Native Hawaiian and other Pacific Islander householders$134,891 Some other race householders$154,639 Two or more races householders$146,271 Hispanic or Latino householders
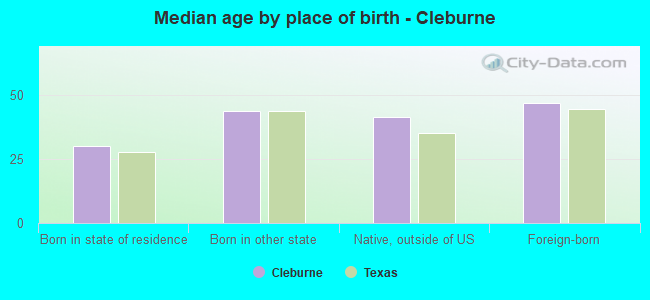
Median age by race in Cleburne
39.0 Median age for White residents35.9 43.2 37.2 Median age for Black or African American residents28.9 43.1 57.4 Median age for American Indian / Alaska Native residents48.6 87.2 27.6 Median age for Asian residents33.5 39.0 -581,560,283.1 Median age for Native Hawaiian / Pacific Islander residents-666,666,666.0 -577,777,777.2 29.6 Median age for Other race residents29.4 29.2 24.5 Median age for Two or more races residents26.9 23.4 42.3 Median age for White alone residents38.2 43.5 26.9 Median age for Hispanic or Latino residents25.3 28.1
Owner/renter occupied households by race in Cleburne
House owners and renters - White residents 5,506 64.7% Owner occupied2,998 35.3% Renter occupiedHouse owners and renters - Black or African American residents 363 36.2% Owner occupied639 63.8% Renter occupiedHouse owners and renters - American Indian / Alaska Native residents 232 84.2% Owner occupied44 15.8% Renter occupiedHouse owners and renters - Asian residents 64 69.9% Owner occupied27 30.1% Renter occupiedHouse owners and renters - Other race residents 469 66.6% Owner occupied235 33.4% Renter occupiedHouse owners and renters - Two or more races residents 738 50.2% Owner occupied731 49.8% Renter occupiedHouse owners and renters - White alone residents 4,555 62.2% Owner occupied2,764 37.8% Renter occupiedHouse owners and renters - Hispanic or Latino residents 2,016 59.9% Owner occupied1,351 40.1% Renter occupied
Language usage in Cleburne
English speakers - Total 76.0% of residents of Cleburne speak English at home.
20.2% of residents speak Spanish at home 4,259 67.8% Speak English very well2,021 32.2% Speak English less than very well4.3% of residents speak other language at home 636 47.3% Speak English very well709 52.7% Speak English less than very well
English speakers - Born in the United States 78.7% of residents of Cleburne speak English at home.
16.0% of residents speak Spanish at home 742 70.1% Speak English very well317 29.9% Speak English less than very well6.2% of residents speak other language at home 408 100.0% Speak English very well
English speakers - Native, born elsewhere 11.8% of residents of Cleburne speak English at home.
34.0% of residents speak Spanish at home 23 11.6% Speak English very well176 88.4% Speak English less than very well113.8% of residents speak other language at home 666 100.0% Speak English less than very well
English speakers - Foreign-born 8.5% of residents of Cleburne speak English at home.
75.3% of residents speak Spanish at home 1,032 47.7% Speak English very well1,130 52.3% Speak English less than very well15.8% of residents speak other language at home 298 65.5% Speak English very well157 34.5% Speak English less than very well
White (Caucasian) - Speak only English Native:
92.4% (18,750)Foreign-born:
18.7% (82)
White (Caucasian) - Speak another language Native:
7.2% (1,459)Foreign-born:
80.5% (356)
Black or African American - Speak only English Native:
98.2% (1,748)Foreign-born:
69.6% (39)
Black or African American - Speak another language Native:
1.8% (31)Foreign-born:
24.4% (14)
American Indian / Alaska Native - Speak only English Native:
70.4% (142)Foreign-born:
47.7% (79)
American Indian / Alaska Native - Speak another language Native:
22.9% (46)Foreign-born:
58.7% (97)
Asian - Speak another language Native:
34.8% (14)Foreign-born:
100.0% (270)
Other race - Speak only English Native:
30.5% (745)Foreign-born:
2.6% (21)
Other race - Speak another language Native:
31.1% (759)Foreign-born:
100.0% (809)
Two or more races - Speak only English Native:
50.2% (2,172)Foreign-born:
5.5% (74)
Two or more races - Speak another language Native:
50.6% (2,190)Foreign-born:
94.4% (1,271)
White alone - Speak only English Native:
99.7% (17,356)Foreign-born:
55.7% (73)
White alone - Speak another language Native:
0.4% (63)Foreign-born:
39.9% (52)
Hispanic or Latino - Speak only English Native:
43.1% (3,236)Foreign-born:
6.0% (138)
Hispanic or Latino - Speak another language Native:
57.0% (4,286)Foreign-born:
94.1% (2,178)
Foreign-born residents in Cleburne 1,954 residents are foreign born (4.9% Latin America ).
This city:
5.7%Texas:
17.1%
Marital status for residents in Cleburne Marital status - White (Caucasian) population 15 years and over
Males 29.6% Never married56.7% Now married1.5% Separated2.7% Widowed9.5% DivorcedFemales 19.8% Never married51.7% Now married0.6% Separated9.8% Widowed18.0% DivorcedWomen who gave birth in the past 12 months Now married:
76.8% (326)Unmarried:
23.2% (98)
Women who did not give birth in the past 12 months Now married:
54.0% (2,386)Unmarried:
46.0% (2,036)
Marital status - Black or African American population 15 years and over
Males 36.7% Never married44.5% Now married3.7% Separated0.0% Widowed15.2% DivorcedFemales 18.7% Never married40.1% Now married1.5% Separated23.4% Widowed16.3% DivorcedWomen who did not give birth in the past 12 months Now married:
51.6% (100)Unmarried:
48.4% (94)
Marital status - American Indian / Alaska Native population 15 years and over
Males 72.1% Never married27.9% Now married0.0% Separated0.0% Widowed0.0% DivorcedFemales 21.2% Never married36.4% Now married0.0% Separated0.0% Widowed42.4% DivorcedWomen who did not give birth in the past 12 months Now married:
57.9% (16)Unmarried:
42.1% (11)
Marital status - Asian population 15 years and over
Males 62.2% Never married37.8% Now married0.0% Separated0.0% Widowed0.0% DivorcedFemales 40.2% Never married59.8% Now married0.0% Separated0.0% Widowed0.0% DivorcedWomen who did not give birth in the past 12 months Now married:
71.4% (38)Unmarried:
28.6% (15)
Marital status - Other race population 15 years and over
Males 34.3% Never married44.1% Now married0.0% Separated10.7% Widowed10.9% DivorcedFemales 10.6% Never married70.8% Now married0.8% Separated3.5% Widowed14.3% DivorcedWomen who gave birth in the past 12 months Now married:
46.0% (50)Unmarried:
54.0% (59)
Women who did not give birth in the past 12 months Now married:
67.4% (426)Unmarried:
32.6% (207)
Marital status - Two or more races population 15 years and over
Males 35.1% Never married55.2% Now married2.6% Separated1.2% Widowed5.9% DivorcedFemales 26.0% Never married52.5% Now married12.6% Separated2.1% Widowed6.8% DivorcedWomen who gave birth in the past 12 months Now married:
97.7% (719)Unmarried:
2.3% (17)
Women who did not give birth in the past 12 months Now married:
33.0% (331)Unmarried:
67.0% (670)
Marital status - White alone, not Hispanic / Latino population 15 years and over
Males 26.4% Never married58.5% Now married1.0% Separated3.1% Widowed11.0% DivorcedFemales 18.3% Never married52.6% Now married0.6% Separated11.1% Widowed17.4% DivorcedWomen who gave birth in the past 12 months Now married:
73.0% (296)Unmarried:
27.0% (110)
Women who did not give birth in the past 12 months Now married:
55.6% (2,069)Unmarried:
44.4% (1,652)
Marital status - Hispanic or Latino population 15 years and over
Males 40.4% Never married48.3% Now married1.8% Separated2.8% Widowed6.6% DivorcedFemales 25.5% Never married53.7% Now married0.6% Separated3.3% Widowed16.8% DivorcedWomen who gave birth in the past 12 months Now married:
80.3% (133)Unmarried:
19.7% (33)
Women who did not give birth in the past 12 months Now married:
49.1% (1,081)Unmarried:
50.9% (1,123)
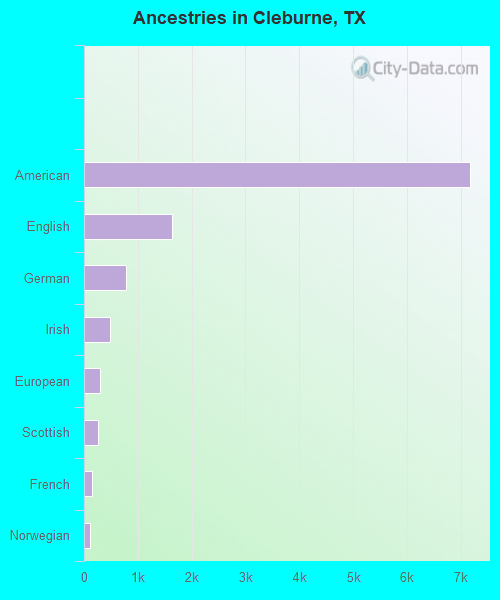
Ancestries in Cleburne
7,167 34.1% American1,629 7.7% English787 3.7% German488 2.3% Irish305 1.4% European253 1.2% Scottish146 0.7% French109 0.5% Norwegian64 0.3% African57 0.3% Italian49 0.2% Scotch-Irish25 0.1% Dutch20 0.10% French Canadian19 0.09% Polish17 0.08% Czech17 0.08% U.S. Virgin Islander17 0.08% West Indian14 0.07% Russian11 0.05% Latvian11 0.05% Welsh10 0.05% Belgian10 0.05% Northern European9 0.04% Eastern European9 0.04% Ukrainian7 0.03% Swedish7 0.03% Dutch West Indian5 0.02% Hungarian4 0.02% British2 0.01% Arab
Geographical mobility in Cleburne Same house 1 year ago 19,539 89.1% White (Caucasian)1,917 82.0% Black or African American344 98.3% American Indian / Alaska Native211 83.5% Asian2,744 80.2% Other race5,962 92.2% Two or more races16,419 88.8% White alone, not Hispanic / Latino9,318 86.3% Hispanic or LatinoMoved within same county 1,226 5.6% White / Caucasian473 20.2% Black or African American12 3.4% American Indian / Alaska Native24 9.4% Asian139 4.1% Other race182 2.8% Two or more races1,204 6.5% White alone, not Hispanic / Latino888 8.2% Hispanic or LatinoMoved within same state 967 4.4% White / Caucasian73 3.1% Black or African American14 5.6% Asian162 4.7% Other race69 1.1% Two or more races680 3.7% White alone, not Hispanic / Latino332 3.1% Hispanic or LatinoMoved from different state 123 0.6% White / Caucasian5 0.1% Two or more races77 0.4% White alone, not Hispanic / Latino49 0.5% Hispanic or LatinoMoved from abroad 17 0.1% White96 2.8% Other race209 3.2% Two or more races8 0.0% White alone, not Hispanic / Latino385 3.6% Hispanic or Latino
Children Nativity (place of birth) in Cleburne
Children under 6 years - Living with two parents Both parents native 1,991 100.0% NativeBoth parents foreign-born 40 86.9% Native6 13.1% Foreign-bornOne native, one foreign-born parent 110 100.0% NativeChildren under 6 years - Living with one parent Native parent 982 100.0% NativeForeign-born parent 92 100.0% NativeChildren 6 to 17 years - Living with two parents Both parents native 3,697 99.2% Native28 0.8% Foreign-bornBoth parents foreign-born 171 84.1% Native32 15.9% Foreign-bornOne native, one foreign-born parent 72 100.0% NativeChildren 6 to 17 years - Living with one parent Native parent 1,045 100.0% NativeForeign-born parent 198 52.5% Native179 47.5% Foreign-born
Grandparents responsible for own grandchildren in Cleburne
Grandparents (30 to 59 years) White / Caucasian 76 46.5% Responsible for grandchildren88 53.5% Not responsible for grandchildrenBlack or African American 17 100.0% Not responsible for grandchildrenOther race 22 100.0% Not responsible for grandchildrenTwo or more races 78 14.1% Responsible for grandchildren478 85.9% Not responsible for grandchildrenWhite alone, not Hispanic / Latino 67 52.5% Responsible for grandchildren61 47.5% Not responsible for grandchildrenHispanic or Latino 83 57.1% Responsible for grandchildren62 42.9% Not responsible for grandchildrenGrandparents (60 years and over) White / Caucasian 75 50.1% Responsible for grandchildren75 49.9% Not responsible for grandchildrenBlack or African American 46 100.0% Not responsible for grandchildrenOther race 203 100.0% Not responsible for grandchildrenTwo or more races 34 100.0% Not responsible for grandchildrenWhite alone, not Hispanic / Latino 78 47.5% Responsible for grandchildren86 52.5% Not responsible for grandchildrenHispanic or Latino 189 100.0% Not responsible for grandchildren