Housing density: 1,954 houses/condos per square mile
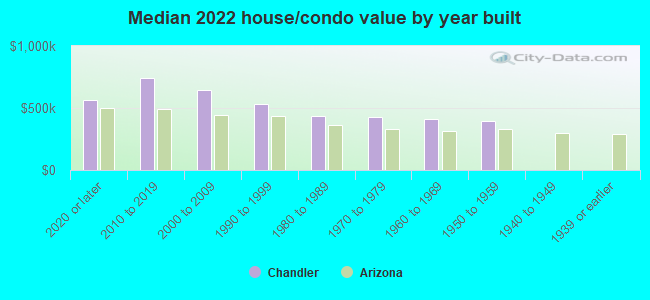
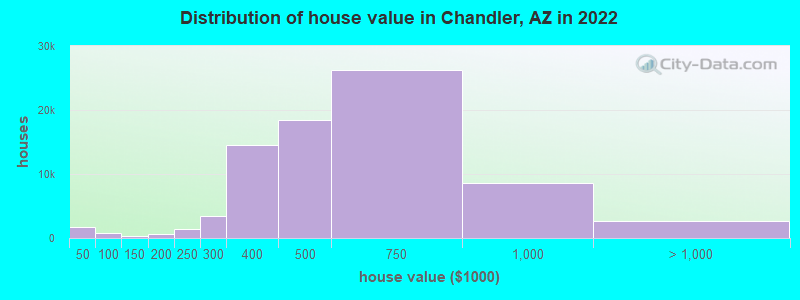
Median price asked for vacant for-sale houses and condos in 2022: $897,628.
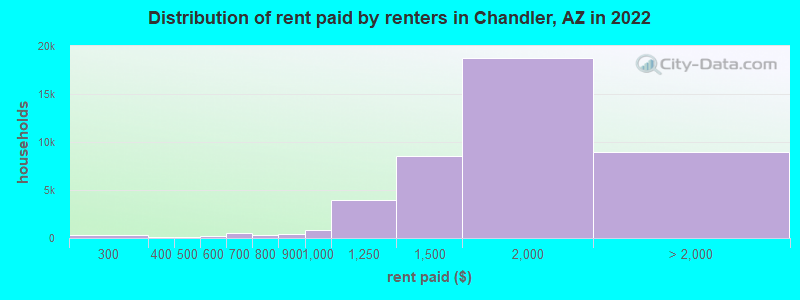
Median contract rent in 2022: $1,692 (lower quartile is $1,387, upper quartile is $1,987)
Median rent asked for vacant for-rent units in 2022: $2,357
Median gross rent in Chandler, AZ in 2022: $1,814
Housing units in Chandler with a mortgage: 50,049 (4,023 second mortgage, 89 home equity loan, 3,185 both second mortgage and home equity loan) Houses without a mortgage: 298
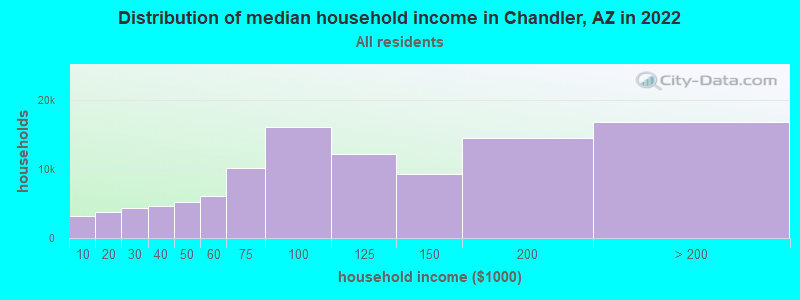
Median household income for houses/condos with a mortgage: $131,193
Median household income for apartments without a mortgage: $89,368
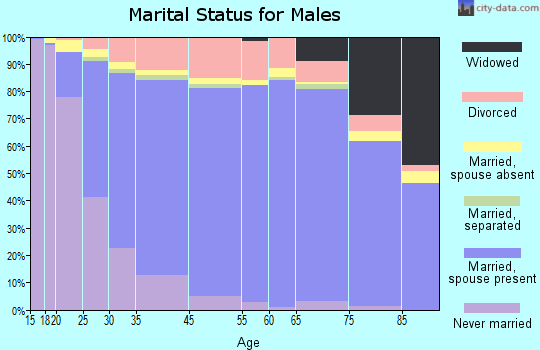
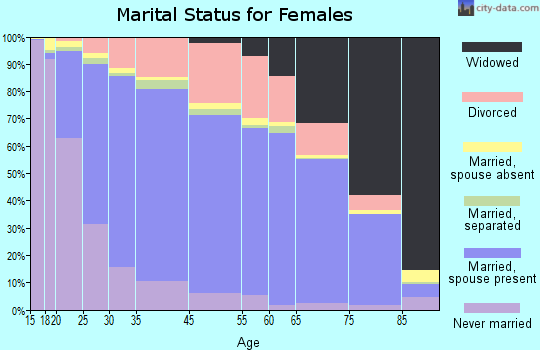
42,850 married couples with children.
19,441 single-parent households (7,481 men, 11,960 women).
74.5% of residents of Chandler speak English at home.
10.4% of residents speak Spanish at home (74% speak English very well, 10% speak English well, 8% speak English not well, 9% don't speak English at all).
4.1% of residents speak other Indo-European language at home (83% speak English very well, 12% speak English well, 4% speak English not well, 1% don't speak English at all).
9.1% of residents speak Asian or Pacific Island language at home (64% speak English very well, 24% speak English well, 9% speak English not well, 3% don't speak English at all).
1.8% of residents speak other language at home (86% speak English very well, 8% speak English well, 4% speak English not well, 2% don't speak English at all).
Foreign born population: 50,536 (18.0%)
(60.9% of them are naturalized citizens)
Percentage of workers working in this county: 98.1% Number of people working at home: 40,924 (26.6% of all workers)
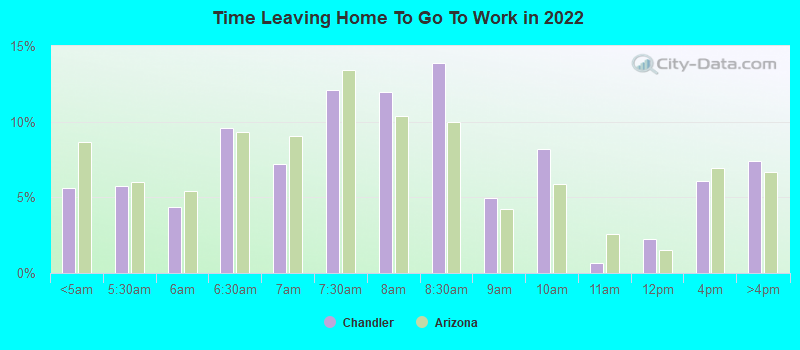
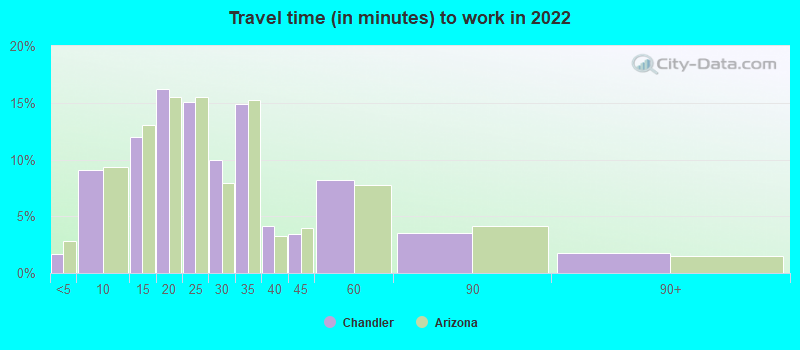
Travel time to work (commute)
Less than 5 minutes: 1,256
5 to 9 minutes: 11,138
10 to 14 minutes: 17,796
15 to 19 minutes: 18,736
20 to 24 minutes: 20,616
25 to 29 minutes: 10,533
30 to 34 minutes: 15,699
35 to 39 minutes: 2,935
40 to 44 minutes: 4,496
45 to 59 minutes: 5,788
60 to 89 minutes: 2,457
90 or more minutes: 1,489
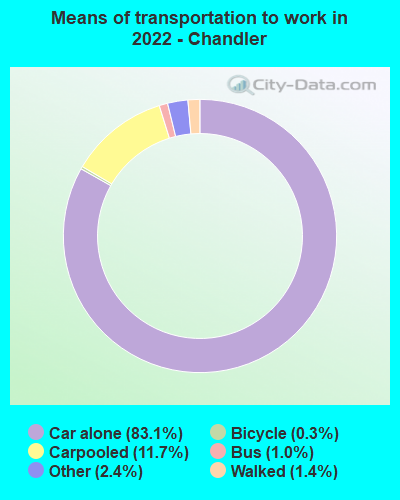
Means of transportation to work:
Drove a car alone: 109,787 (63.5%)
Carpooled: 15,490 (9.0%)
Bus: 1,347 (0.8%)
Taxi: 3,214 (1.9%)
Bicycle: 407 (0.2%)
Walked: 1,855 (1.1%)
Worked at home: 40,924 (23.7%)
Unemployment by race in 2022
Unemployment rate for White non-Hispanic residents
2.2%Males
2.2%Females
Unemployment rate for Black residents
2.7%Males
3.8%Females
Unemployment rate for American Indian and Alaska Native residents
0.8%Females
Unemployment rate for Asian residents
4.5%Males
3.4%Females
Unemployment rate for other race residents
1.7%Males
1.6%Females
Unemployment rate for two or more race residents
1.7%Males
3.4%Females
Unemployment rate for Hispanic or Latino residents
1.1%Males
4.4%Females
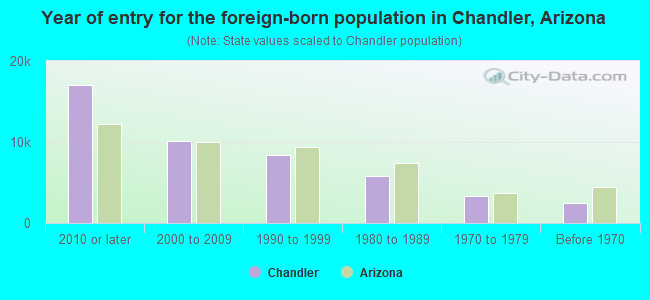
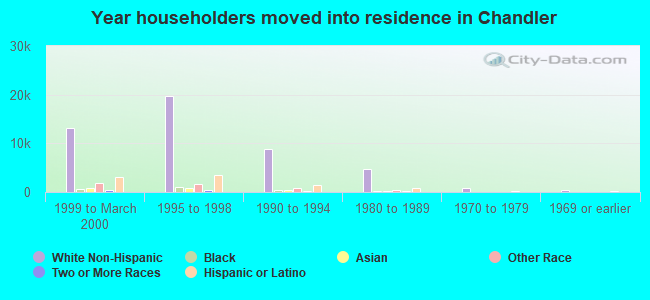
Year of entry for the foreign-born population in Chandler, Arizona
17,0912010 or later
10,1362000 to 2009
8,3691990 to 1999
5,8321980 to 1989
3,2851970 to 1979
2,465Before 1970
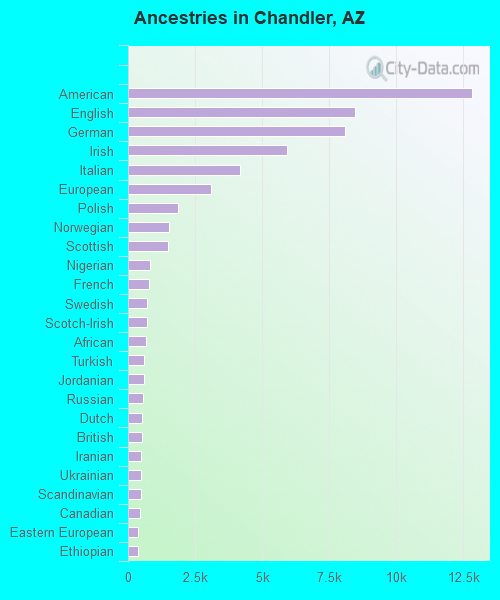
First ancestries reported:
American: 12,816 (8.8%)
English: 8,473 (5.8%)
German: 8,081 (5.6%)
Irish: 5,930 (4.1%)
Italian: 4,167 (2.9%)
European: 3,079 (2.1%)
Polish: 1,870 (1.3%)
Norwegian: 1,535 (1.1%)
Scottish: 1,475 (1.0%)
Nigerian: 827 (0.6%)
French: 767 (0.5%)
Swedish: 725 (0.5%)
Scotch-Irish: 707 (0.5%)
African: 677 (0.5%)
Turkish: 611 (0.4%)
Jordanian: 593 (0.4%)
Russian: 571 (0.4%)
Dutch: 527 (0.4%)
British: 524 (0.4%)
Iranian: 494 (0.3%)
Ukrainian: 481 (0.3%)
Scandinavian: 480 (0.3%)
Canadian: 451 (0.3%)
Eastern European: 380 (0.3%)
Ethiopian: 375 (0.3%)
Lebanese: 338 (0.2%)
French Canadian: 338 (0.2%)
Greek: 320 (0.2%)
Croatian: 308 (0.2%)
Egyptian: 284 (0.2%)
Northern European: 283 (0.2%)
Welsh: 281 (0.2%)
Assyrian: 262 (0.2%)
Armenian: 261 (0.2%)
Arab: 240 (0.2%)
Hungarian: 211 (0.1%)
Portuguese: 206 (0.1%)
Slavic: 199 (0.1%)
Finnish: 196 (0.1%)
Czech: 175 (0.1%)
Haitian: 174 (0.1%)
Danish: 168 (0.1%)
Austrian: 165 (0.1%)
Slovak: 156 (0.1%)
Romanian: 125 (0.09%)
Jamaican: 122 (0.08%)
Pennsylvania German: 119 (0.08%)
Swiss: 119 (0.08%)
Iraqi: 118 (0.08%)
Syrian: 114 (0.08%)
Lithuanian: 111 (0.08%)
Senegalese: 110 (0.08%)
Israeli: 98 (0.07%)
Albanian: 93 (0.06%)
Yugoslavian: 90 (0.06%)
Serbian: 85 (0.06%)
Trinidadian and Tobagonian: 62 (0.04%)
Bulgarian: 56 (0.04%)
Zimbabwean: 55 (0.04%)
Sudanese: 47 (0.03%)
Belgian: 42 (0.03%)
Ghanaian: 41 (0.03%)
Czechoslovakian: 38 (0.03%)
Guyanese: 32 (0.02%)
Basque: 28 (0.02%)
Afghan: 28 (0.02%)
Brazilian: 27 (0.02%)
Estonian: 23 (0.02%)
Australian: 21 (0.01%)
Bahamian: 18 (0.01%)
Macedonian: 16 (0.01%)
Kenyan: 15 (0.01%)
South African: 12 (0.01%)
Palestinian: 11 (0.01%)
Moroccan: 11 (0.01%)
Slovene: 8 (0.01%)
Cape Verdean: 8 (0.01%)
Most common places of birth for foreign-born residents (%):
Mexico
Chandler:
20.0% (8,994)
Arizona:
53.4% (500,086)
India
Chandler:
18.8% (8,478)
Arizona:
4.5% (41,719)
China, excluding Hong Kong and Taiwan
Chandler:
7.8% (3,521)
Arizona:
2.3% (21,275)
Vietnam
Chandler:
7.4% (3,321)
Arizona:
2.1% (19,199)
Philippines
Chandler:
4.8% (2,160)
Arizona:
3.2% (30,378)
Korea
Chandler:
3.8% (1,728)
Arizona:
1.2% (11,275)
Canada
Chandler:
3.3% (1,492)
Arizona:
4.3% (40,102)
Taiwan
Chandler:
2.8% (1,254)
Arizona:
0.5% (4,961)
Guatemala
Chandler:
1.6% (741)
Arizona:
1.6% (14,556)
Bangladesh
Chandler:
1.5% (686)
Arizona:
0.3% (2,425)
Japan
Chandler:
1.5% (680)
Arizona:
0.6% (6,077)
Place of birth for U.S.-born residents:
This state: 100,613
Other state: 125,206
Northeast: 18,822
Midwest: 43,634
South: 16,554
West: 46,196
87.9% of Chandler residents lived in the same house 1 years ago. Out of people who lived in different houses, 38.4% lived in this county. Out of people who lived in different counties, 9.9% lived in Arizona.
Chandler:
87.9%
State average:
86.0%
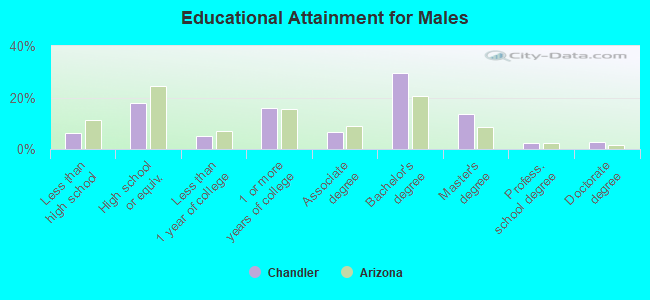
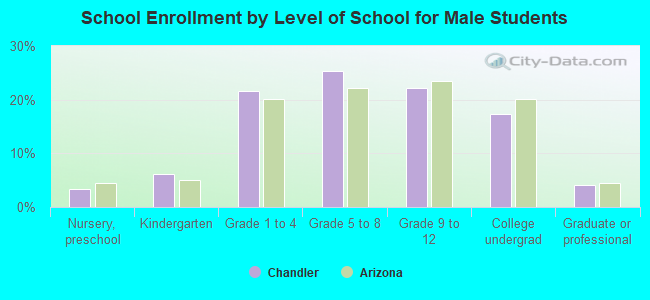
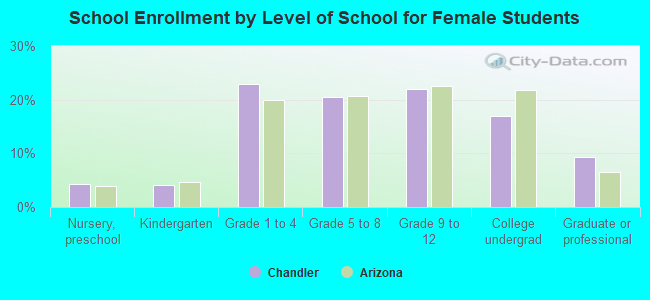
Education attainment for males 25 years and older:
No schooling: 1,950
Nursery to 4th grade: 589
5th and 6th grade: 300
7th and 8th grade: 566
9th grade: 201
10th grade: 185
11th grade: 576
12th grade, no diploma: 1,625
High school graduate (or equivalency): 16,965
Less than 1 year of college: 4,794
Some college more than 1 year, no degree: 15,030
Associate degree: 6,191
Bachelor's degree: 27,694
Master's degree: 12,906
Professional school degree: 2,127
Doctorate degree: 2,571
Education attainment for females 25 years and older:
No schooling: 1,072
Nursery to 4th grade: 940
5th and 6th grade: 1,140
7th and 8th grade: 1,336
9th grade: 96
10th grade: 354
11th grade: 349
12th grade, no diploma: 763
High school graduate (or equivalency): 18,797
Less than 1 year of college: 5,853
Some college more than 1 year, no degree: 12,957
Associate degree: 8,243
Bachelor's degree: 25,509
Master's degree: 12,961
Professional school degree: 2,710
Doctorate degree: 1,350
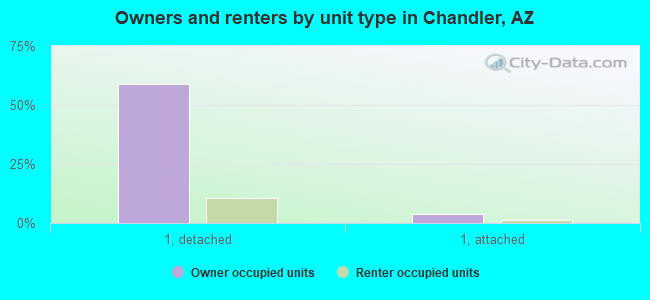
Housing units in structures:
One, detached: 78,758
One, attached: 5,202
Two: 969
3 or 4: 3,212
5 to 9: 6,738
10 to 19: 7,075
20 to 49: 3,160
50 or more: 6,799
Mobile homes: 1,125
Boats, RVs, vans, etc.: 54
Median worth of mobile homes: $33,000
Housing units lacking complete kitchen facilities in 2022: 0.5%