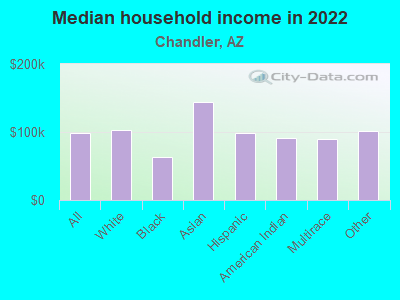
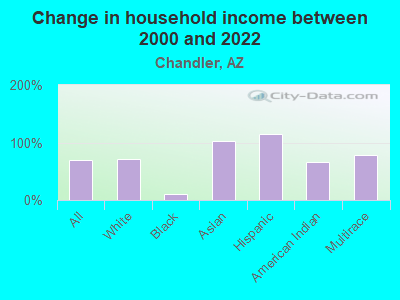
The median household income in Chandler, AZ in 2022 was $98,664, which was 24.4% greater than the median annual income of $74,568 across the entire state of Arizona. Compared to the median income of $58,416 in 2000 this represents an increase of 40.8%. The per capita income in 2022 was $50,247, which means an increase of 52.4% compared to 2000 when it was $23,904.
Whole page based on the data from 2000 / 2022 when the population of Chandler, Arizona was 176,581 / 280,684
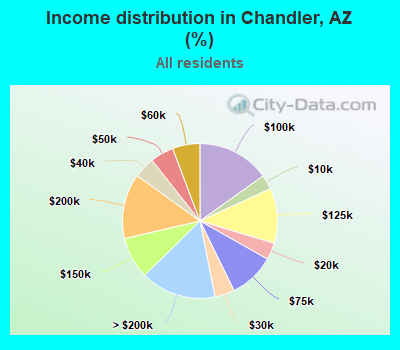
Income statistics for all residents
Median household income in Chandler, AZ in 2022:
Chandler:
$98,664
Arizona:
$74,568
Change in median household income between 2000 and 2022:
Chandler, Arizona:
+68.9%
Arizona:
+83.9%
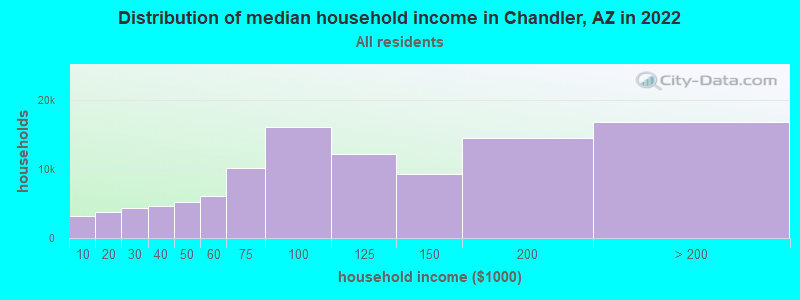
Number of households with income < $10k:
Chandler:
3.0% (3,253)
State:
5.4% (153,140)
Number of households with income $10k - 20k:
Chandler:
3.5% (3,788)
State:
6.1% (173,005)
Number of households with income $20k - 30k:
Chandler:
4.1% (4,398)
State:
6.5% (185,302)
Number of households with income $30k - 40k:
Chandler:
4.4% (4,698)
State:
7.4% (211,202)
Number of households with income $40k - 50k:
Chandler:
4.9% (5,248)
State:
7.5% (214,896)
Number of households with income $50k - 60k:
Chandler:
5.7% (6,104)
Arizona:
7.5% (214,346)
Number of households with income $60k - 75k:
Chandler:
9.6% (10,211)
State:
9.8% (280,188)
Number of households with income $75k - 100k:
Chandler:
15.1% (16,147)
State:
13.8% (392,461)
Number of households with income $100k - 125k:
Chandler:
11.5% (12,238)
State:
10.6% (301,862)
Number of households with income $125k - 150k:
Chandler:
8.7% (9,288)
State:
7.2% (204,258)
Number of households with income $150k - 200k:
Chandler:
13.6% (14,508)
Arizona:
8.6% (245,074)
Number of households with income > $200k:
Chandler:
15.8% (16,831)
State:
9.6% (274,643)
Aggregate household income in Chandler in 2022: $13,935,202,400
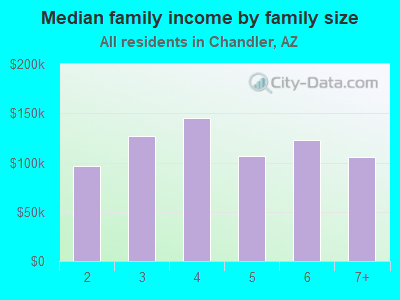
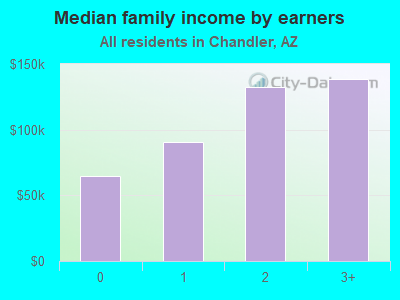
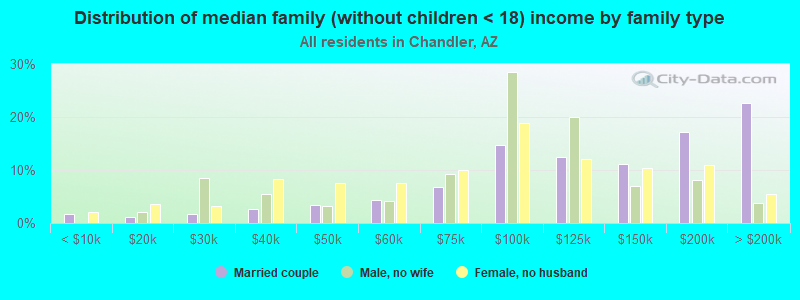
Median family income in Chandler in 2022:
Chandler:
$116,362
Arizona:
$88,679
Number of families with income < $10k:
Chandler:
3.2% (2,350)
State:
3.7% (67,434)
Number of families with income $10k - 20k:
Chandler:
1.9% (1,369)
Arizona:
3.4% (61,955)
Number of families with income $20k - 30k:
Chandler:
3.1% (2,292)
State:
4.7% (87,323)
Number of families with income $30k - 40k:
Chandler:
3.5% (2,601)
State:
6.2% (114,848)
Number of families with income $40k - 50k:
Chandler:
3.9% (2,851)
State:
6.6% (122,371)
Number of families with income $50k - 60k:
Chandler:
4.2% (3,109)
Arizona:
7.1% (131,165)
Number of families with income $60k - 75k:
Chandler:
8.1% (5,988)
State:
9.7% (179,442)
Number of families with income $75k - 100k:
Chandler:
15.2% (11,215)
State:
15.1% (278,689)
Number of families with income $100k - 125k:
Chandler:
12.3% (9,099)
Arizona:
12.2% (224,991)
Number of families with income $125k - 150k:
Chandler:
10.0% (7,396)
State:
8.6% (157,645)
Number of families with income $150k - 200k:
Chandler:
15.0% (11,116)
Arizona:
10.3% (190,652)
Number of families with income > $200k:
Chandler:
19.7% (14,613)
State:
12.3% (227,015)
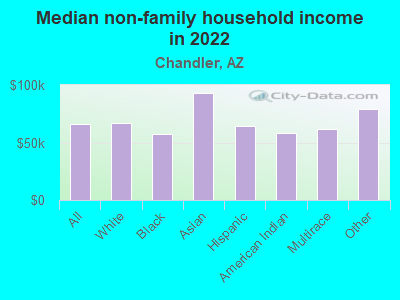
Median non-family income in Chandler in 2022:
Chandler:
$66,304
State:
$47,840
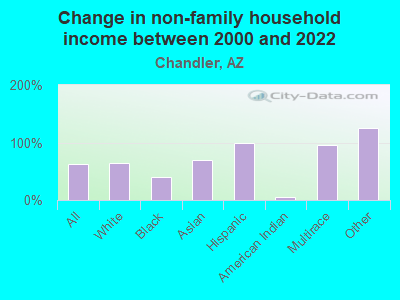
Change in median non-family income between 2000 and 2022:
Chandler, Arizona:
+62.8%
State:
+78.3%
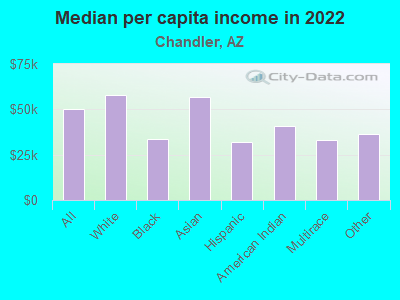
Median per capita income in Chandler in 2022:
Chandler:
$50,247
Arizona:
$39,819
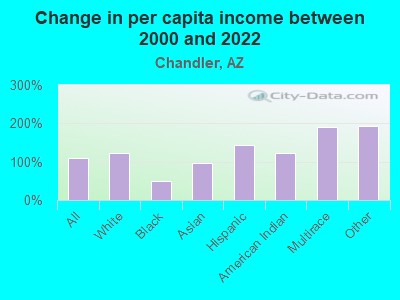
Change in median per capita income between 2000 and 2022:
Chandler, Arizona:
+110.2%
State:
+96.4%
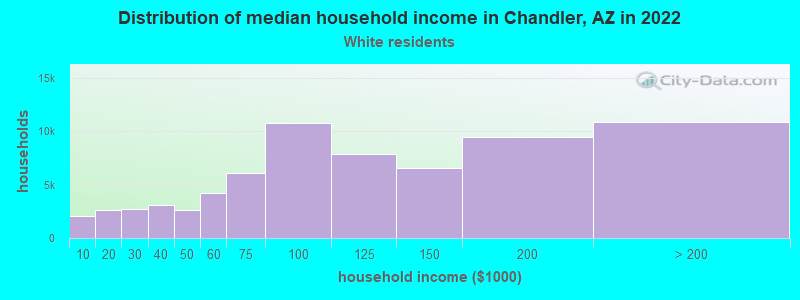
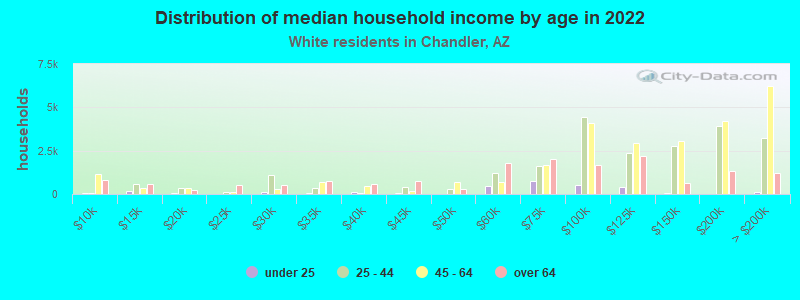
Income statistics for White residents
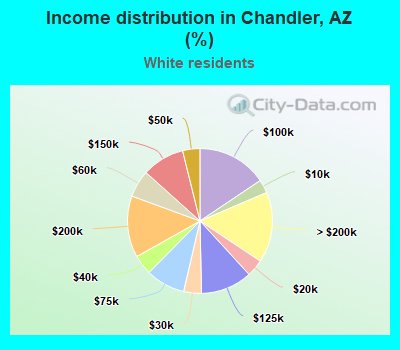
Median household income in Chandler, AZ in 2022:
Chandler:
$102,611
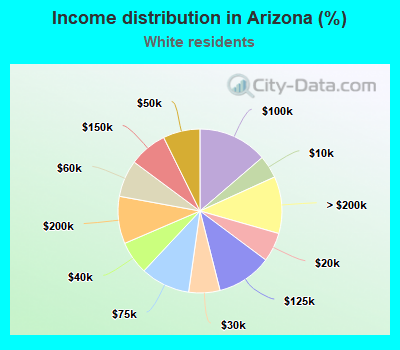
State:
$79,606
Change in median household income between 2000 and 2022:
Chandler, Arizona:
+71.6%
Arizona:
+87.5%
Number of households with income < $10k:
Chandler:
3.0% (2,061)
State:
4.5% (85,231)
Number of households with income $10k - 20k:
Chandler:
3.8% (2,631)
Arizona:
5.8% (108,780)
Number of households with income $20k - 30k:
Chandler:
4.0% (2,736)
State:
6.2% (116,475)
Number of households with income $30k - 40k:
Chandler:
4.4% (3,045)
State:
6.6% (123,902)
Number of households with income $40k - 50k:
Chandler:
3.9% (2,657)
State:
7.3% (137,849)
Number of households with income $50k - 60k:
Chandler:
6.1% (4,169)
State:
7.3% (137,827)
Number of households with income $60k - 75k:
Chandler:
8.8% (6,035)
State:
9.7% (184,136)
Number of households with income $75k - 100k:
Chandler:
15.6% (10,721)
Arizona:
13.7% (258,707)
Number of households with income $100k - 125k:
Chandler:
11.5% (7,904)
State:
10.9% (205,439)
Number of households with income $125k - 150k:
Chandler:
9.5% (6,524)
State:
7.5% (142,080)
Number of households with income $150k - 200k:
Chandler:
13.7% (9,447)
Arizona:
9.3% (176,384)
Number of households with income > $200k:
Chandler:
15.8% (10,853)
Arizona:
11.2% (212,092)
Aggregate household income in Chandler in 2022: $9,181,026,100
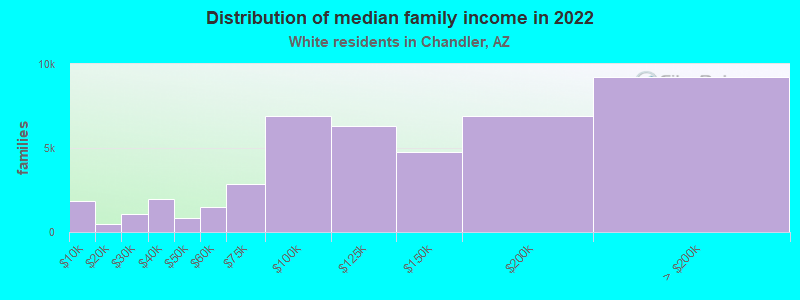
Median family income in Chandler in 2022:
Chandler:
$122,271
State:
$98,053
Number of families with income < $10k:
Chandler:
4.1% (1,832)
State:
2.5% (29,605)
Number of families with income $10k - 20k:
Chandler:
1.1% (496)
State:
2.6% (30,626)
Number of families with income $20k - 30k:
Chandler:
2.4% (1,054)
State:
3.7% (43,641)
Number of families with income $30k - 40k:
Chandler:
4.4% (1,950)
State:
5.0% (58,188)
Number of families with income $40k - 50k:
Chandler:
1.8% (817)
State:
6.0% (70,473)
Number of families with income $50k - 60k:
Chandler:
3.3% (1,492)
Arizona:
6.5% (76,495)
Number of families with income $60k - 75k:
Chandler:
6.4% (2,870)
State:
9.6% (111,805)
Number of families with income $75k - 100k:
Chandler:
15.4% (6,905)
State:
15.1% (176,263)
Number of families with income $100k - 125k:
Chandler:
14.2% (6,338)
State:
12.9% (151,124)
Number of families with income $125k - 150k:
Chandler:
10.7% (4,776)
State:
9.3% (108,356)
Number of families with income $150k - 200k:
Chandler:
15.5% (6,923)
State:
11.7% (137,270)
Number of families with income > $200k:
Chandler:
20.7% (9,255)
Arizona:
15.0% (175,055)
Median non-family income in Chandler in 2022:
Chandler:
$66,824
State:
$50,179
Change in median non-family income between 2000 and 2022:
Chandler, Arizona:
+64.2%
State:
+81.7%
Median per capita income in Chandler in 2022:
Chandler:
$57,647
Arizona:
$48,057
Change in median per capita income between 2000 and 2022:
Chandler, Arizona:
+122.2%
State:
+108.1%
Income statistics for Black or African American residents
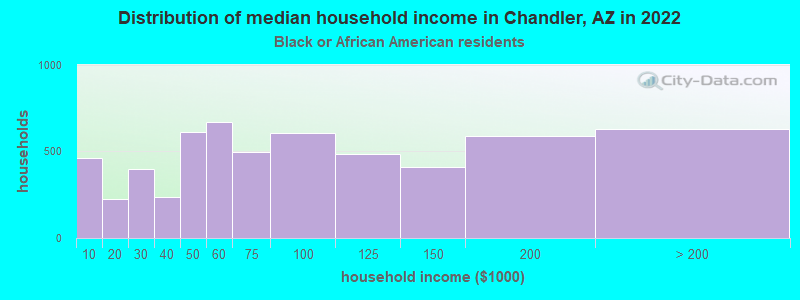
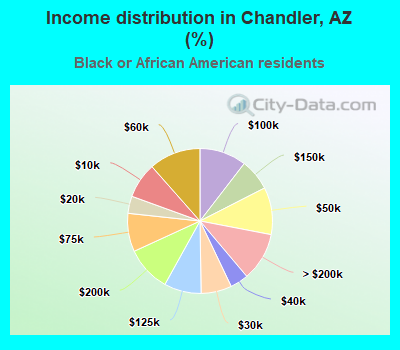
Median household income in Chandler, AZ in 2022:
Chandler:
$62,961
State:
$58,894
Change in median household income between 2000 and 2022:
Chandler, Arizona:
+10.8%
State:
+73.6%
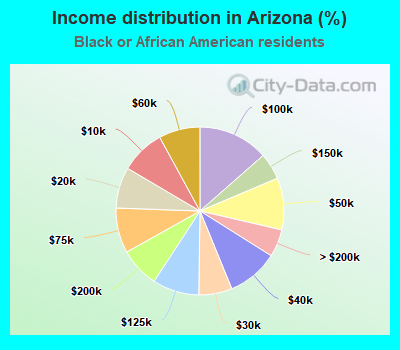
Number of households with income < $10k:
Chandler:
7.9% (462)
Arizona:
8.6% (10,466)
Number of households with income $10k - 20k:
Chandler:
3.8% (223)
State:
7.9% (9,663)
Number of households with income $20k - 30k:
Chandler:
6.8% (398)
Arizona:
6.4% (7,832)
Number of households with income $30k - 40k:
Chandler:
4.1% (237)
Arizona:
9.9% (12,071)
Number of households with income $40k - 50k:
Chandler:
10.5% (612)
State:
10.0% (12,183)
Number of households with income $50k - 60k:
Chandler:
11.5% (669)
Arizona:
7.9% (9,714)
Number of households with income $60k - 75k:
Chandler:
8.6% (498)
State:
8.7% (10,629)
Number of households with income $75k - 100k:
Chandler:
10.5% (608)
State:
13.5% (16,533)
Number of households with income $100k - 125k:
Chandler:
8.3% (482)
State:
9.0% (10,982)
Number of households with income $125k - 150k:
Chandler:
7.0% (409)
Arizona:
5.1% (6,270)
Number of households with income $150k - 200k:
Chandler:
10.1% (586)
Arizona:
7.7% (9,374)
Number of households with income > $200k:
Chandler:
10.8% (629)
Arizona:
5.3% (6,512)
Aggregate household income in Chandler in 2022: $564,770,500
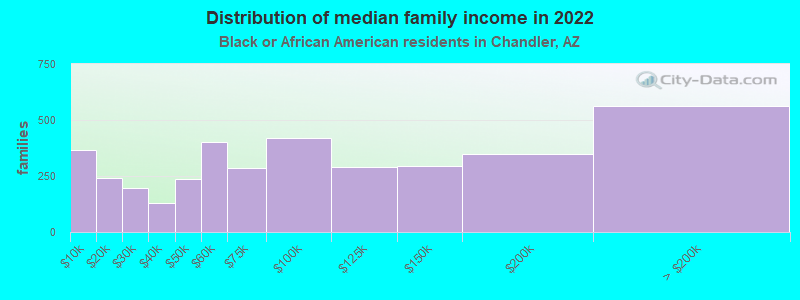
Median family income in Chandler in 2022:
Chandler:
$63,895
Arizona:
$77,650
Number of families with income < $10k:
Chandler:
9.7% (367)
State:
6.6% (4,771)
Number of families with income $10k - 20k:
Chandler:
6.3% (239)
State:
5.8% (4,180)
Number of families with income $20k - 30k:
Chandler:
5.3% (198)
State:
4.7% (3,399)
Number of families with income $30k - 40k:
Chandler:
3.4% (128)
State:
8.9% (6,411)
Number of families with income $40k - 50k:
Chandler:
6.3% (237)
State:
7.6% (5,453)
Number of families with income $50k - 60k:
Chandler:
10.7% (404)
State:
7.4% (5,322)
Number of families with income $60k - 75k:
Chandler:
7.5% (284)
State:
8.2% (5,897)
Number of families with income $75k - 100k:
Chandler:
11.1% (418)
Arizona:
15.2% (10,964)
Number of families with income $100k - 125k:
Chandler:
7.7% (289)
Arizona:
11.5% (8,237)
Number of families with income $125k - 150k:
Chandler:
7.9% (296)
State:
7.0% (4,999)
Number of families with income $150k - 200k:
Chandler:
9.3% (349)
State:
9.5% (6,857)
Number of families with income > $200k:
Chandler:
14.9% (561)
State:
7.6% (5,434)
Median non-family income in Chandler in 2022:
Chandler:
$57,738
State:
$41,983
Change in median non-family income between 2000 and 2022:
Chandler, Arizona:
+40.3%
State:
+68.7%
Median per capita income in Chandler in 2022:
Chandler:
$33,706
State:
$32,146
Change in median per capita income between 2000 and 2022:
Chandler, Arizona:
+50.1%
State:
+100.2%
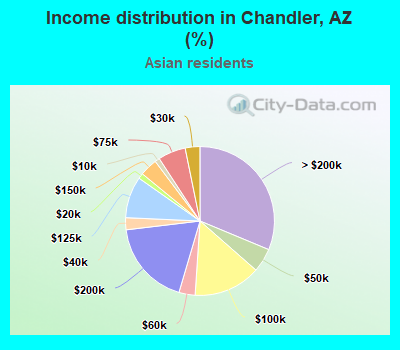
Income statistics for Asian residents
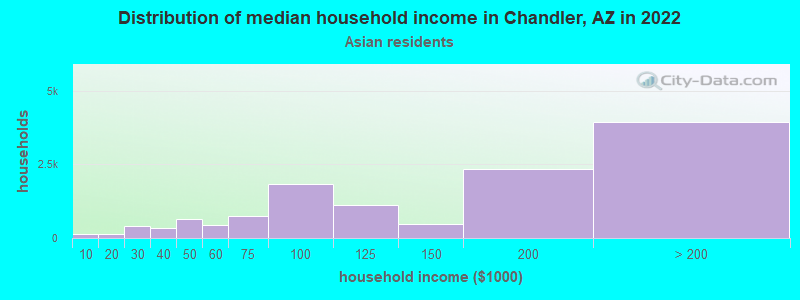
Median household income in Chandler, AZ in 2022:
Chandler:
$144,464
State:
$96,288
Change in median household income between 2000 and 2022:
Chandler, Arizona:
+101.7%
Arizona:
+110.2%
Number of households with income < $10k:
Chandler:
1.1% (133)
State:
6.1% (5,534)
Number of households with income $10k - 20k:
Chandler:
1.2% (148)
State:
5.6% (5,122)
Number of households with income $20k - 30k:
Chandler:
3.2% (402)
Arizona:
6.4% (5,834)
Number of households with income $30k - 40k:
Chandler:
2.6% (327)
State:
5.5% (5,028)
Number of households with income $40k - 50k:
Chandler:
5.2% (654)
Arizona:
4.0% (3,657)
Number of households with income $50k - 60k:
Chandler:
3.5% (441)
State:
5.2% (4,709)
Number of households with income $60k - 75k:
Chandler:
6.0% (753)
Arizona:
6.5% (5,920)
Number of households with income $75k - 100k:
Chandler:
14.6% (1,833)
Arizona:
13.1% (11,899)
Number of households with income $100k - 125k:
Chandler:
9.0% (1,135)
State:
9.7% (8,819)
Number of households with income $125k - 150k:
Chandler:
3.8% (482)
State:
7.3% (6,600)
Number of households with income $150k - 200k:
Chandler:
18.6% (2,333)
State:
11.7% (10,673)
Number of households with income > $200k:
Chandler:
31.3% (3,933)
State:
18.8% (17,101)
Aggregate household income in Chandler in 2022: $2,129,178,500
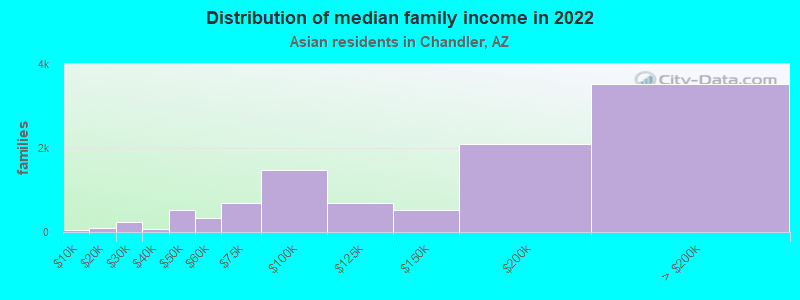
Median family income in Chandler in 2022:
Chandler:
$152,797
State:
$112,809
Number of families with income < $10k:
Chandler:
0.5% (55)
State:
2.2% (1,373)
Number of families with income $10k - 20k:
Chandler:
1.0% (100)
Arizona:
3.4% (2,170)
Number of families with income $20k - 30k:
Chandler:
2.2% (231)
Arizona:
3.9% (2,455)
Number of families with income $30k - 40k:
Chandler:
0.6% (64)
Arizona:
5.2% (3,273)
Number of families with income $40k - 50k:
Chandler:
5.1% (527)
State:
3.6% (2,254)
Number of families with income $50k - 60k:
Chandler:
3.1% (324)
Arizona:
5.0% (3,168)
Number of families with income $60k - 75k:
Chandler:
6.8% (696)
State:
6.8% (4,292)
Number of families with income $75k - 100k:
Chandler:
14.3% (1,470)
Arizona:
15.1% (9,527)
Number of families with income $100k - 125k:
Chandler:
6.7% (694)
State:
9.3% (5,879)
Number of families with income $125k - 150k:
Chandler:
5.1% (527)
State:
7.1% (4,463)
Number of families with income $150k - 200k:
Chandler:
20.2% (2,084)
State:
14.4% (9,060)
Number of families with income > $200k:
Chandler:
34.3% (3,534)
Arizona:
23.9% (15,042)
Median non-family income in Chandler in 2022:
Chandler:
$93,415
State:
$45,715
Change in median non-family income between 2000 and 2022:
Chandler, Arizona:
+69.0%
State:
+79.3%
Median per capita income in Chandler in 2022:
Chandler:
$56,569
State:
$47,443
Change in median per capita income between 2000 and 2022:
Chandler, Arizona:
+95.7%
State:
+116.9%
Income statistics for Hispanic or Latino residents
Median household income in Chandler, AZ in 2022:
Chandler:
$98,136
State:
$65,893
Change in median household income between 2000 and 2022:
Chandler, Arizona:
+115.4%
State:
+108.0%
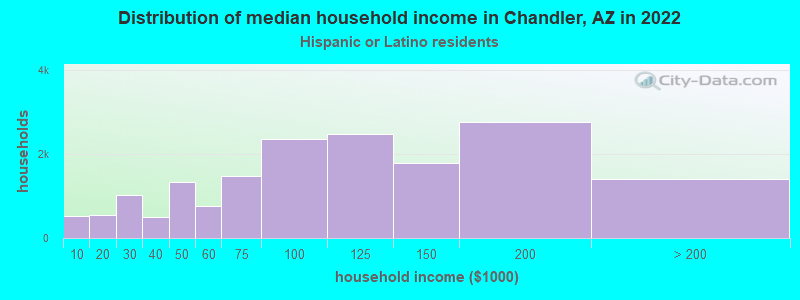
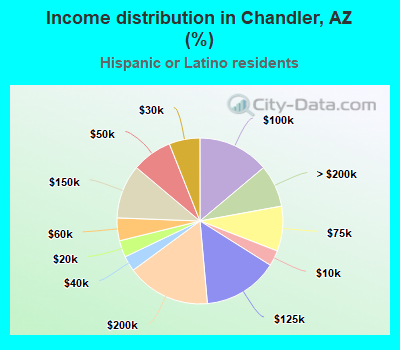
Number of households with income < $10k:
Chandler:
3.0% (514)
Arizona:
5.9% (41,793)
Number of households with income $10k - 20k:
Chandler:
3.3% (551)
State:
6.4% (45,277)
Number of households with income $20k - 30k:
Chandler:
6.0% (1,017)
State:
7.3% (51,992)
Number of households with income $30k - 40k:
Chandler:
3.0% (507)
Arizona:
9.5% (67,346)
Number of households with income $40k - 50k:
Chandler:
7.9% (1,329)
Arizona:
8.1% (57,753)
Number of households with income $50k - 60k:
Chandler:
4.4% (752)
Arizona:
8.2% (58,192)
Number of households with income $60k - 75k:
Chandler:
8.8% (1,484)
Arizona:
11.2% (79,200)
Number of households with income $75k - 100k:
Chandler:
13.9% (2,352)
State:
14.9% (105,701)
Number of households with income $100k - 125k:
Chandler:
14.6% (2,479)
State:
10.5% (74,588)
Number of households with income $125k - 150k:
Chandler:
10.5% (1,781)
State:
6.8% (47,938)
Number of households with income $150k - 200k:
Chandler:
16.3% (2,764)
State:
6.4% (45,059)
Number of households with income > $200k:
Chandler:
8.2% (1,394)
State:
4.9% (34,505)
Aggregate household income in Chandler in 2022: $1,900,942,000
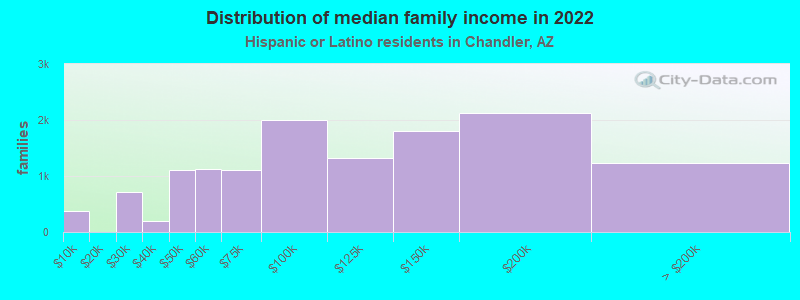
Median family income in Chandler in 2022:
Chandler:
$97,342
State:
$70,039
Number of families with income < $10k:
Chandler:
2.9% (383)
State:
5.4% (28,275)
Number of families with income $20k - 30k:
Chandler:
5.4% (714)
Arizona:
6.7% (35,188)
Number of families with income $30k - 40k:
Chandler:
1.5% (196)
Arizona:
9.1% (47,714)
Number of families with income $40k - 50k:
Chandler:
8.5% (1,115)
State:
8.1% (42,345)
Number of families with income $50k - 60k:
Chandler:
8.6% (1,124)
State:
8.8% (45,969)
Number of families with income $60k - 75k:
Chandler:
8.5% (1,114)
State:
11.4% (59,528)
Number of families with income $75k - 100k:
Chandler:
15.3% (2,005)
Arizona:
15.4% (80,812)
Number of families with income $100k - 125k:
Chandler:
10.1% (1,327)
State:
11.1% (57,948)
Number of families with income $125k - 150k:
Chandler:
13.7% (1,796)
State:
7.6% (39,733)
Number of families with income $150k - 200k:
Chandler:
16.1% (2,117)
State:
6.5% (34,268)
Number of families with income > $200k:
Chandler:
9.4% (1,236)
Arizona:
5.4% (28,308)
Median non-family income in Chandler in 2022:
Chandler:
$64,371
State:
$42,764
Change in median non-family income between 2000 and 2022:
Chandler, Arizona:
+99.7%
Arizona:
+98.1%
Median per capita income in Chandler in 2022:
Chandler:
$31,922
State:
$25,739
Change in median per capita income between 2000 and 2022:
Chandler, Arizona:
+143.8%
State:
+142.2%
Income statistics for American Indian and Alaska Native residents
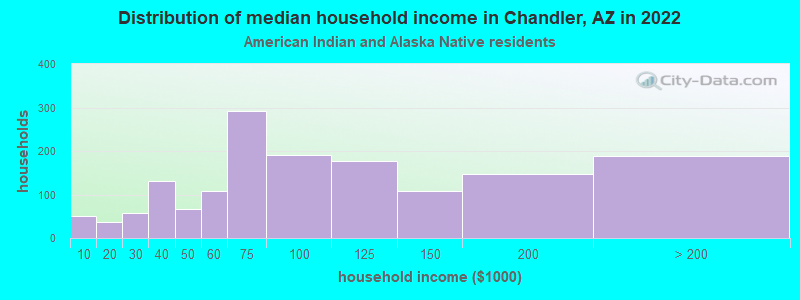
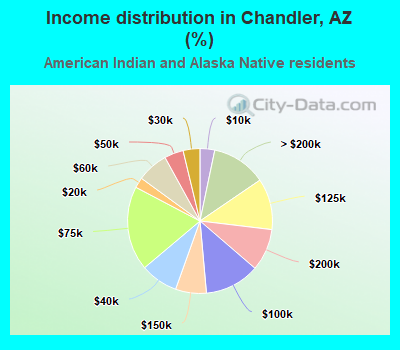
Median household income in Chandler, AZ in 2022:
Chandler:
$91,738
State:
$48,896
Change in median household income between 2000 and 2022:
Chandler, Arizona:
+66.0%
State:
+99.5%
Number of households with income < $10k:
Chandler:
3.3% (51)
State:
14.0% (12,841)
Number of households with income $10k - 20k:
Chandler:
2.3% (36)
State:
9.6% (8,797)
Number of households with income $20k - 30k:
Chandler:
3.7% (58)
State:
8.2% (7,545)
Number of households with income $30k - 40k:
Chandler:
8.4% (130)
Arizona:
10.5% (9,577)
Number of households with income $40k - 50k:
Chandler:
4.3% (66)
State:
8.5% (7,763)
Number of households with income $50k - 60k:
Chandler:
7.0% (108)
Arizona:
7.9% (7,222)
Number of households with income $60k - 75k:
Chandler:
18.8% (292)
State:
7.8% (7,170)
Number of households with income $75k - 100k:
Chandler:
12.3% (190)
Arizona:
10.6% (9,708)
Number of households with income $100k - 125k:
Chandler:
11.4% (177)
State:
11.0% (10,048)
Number of households with income $125k - 150k:
Chandler:
6.9% (107)
State:
4.9% (4,523)
Number of households with income $150k - 200k:
Chandler:
9.4% (146)
State:
4.4% (3,987)
Number of households with income > $200k:
Chandler:
12.2% (189)
State:
2.6% (2,405)
Aggregate household income in Chandler in 2022: $105,596,600
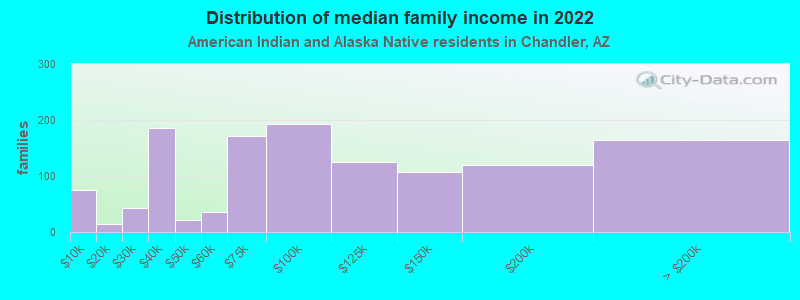
Median family income in Chandler in 2022:
Chandler:
$97,881
State:
$55,447
Number of families with income < $10k:
Chandler:
6.0% (75)
State:
12.2% (7,824)
Number of families with income $10k - 20k:
Chandler:
1.2% (15)
Arizona:
7.3% (4,719)
Number of families with income $20k - 30k:
Chandler:
3.4% (42)
State:
7.6% (4,919)
Number of families with income $30k - 40k:
Chandler:
14.7% (185)
State:
10.1% (6,484)
Number of families with income $40k - 50k:
Chandler:
1.7% (22)
State:
7.8% (5,005)
Number of families with income $50k - 60k:
Chandler:
2.9% (36)
Arizona:
8.6% (5,525)
Number of families with income $60k - 75k:
Chandler:
13.7% (172)
State:
7.8% (4,989)
Number of families with income $75k - 100k:
Chandler:
15.4% (193)
State:
12.8% (8,230)
Number of families with income $100k - 125k:
Chandler:
9.9% (125)
State:
11.2% (7,211)
Number of families with income $125k - 150k:
Chandler:
8.5% (107)
State:
5.7% (3,639)
Number of families with income $150k - 200k:
Chandler:
9.5% (119)
State:
5.6% (3,617)
Number of families with income > $200k:
Chandler:
13.1% (165)
State:
3.4% (2,177)
Median non-family income in Chandler in 2022:
Chandler:
$58,336
Arizona:
$25,708
Change in median non-family income between 2000 and 2022:
Chandler, Arizona:
+4.7%
Arizona:
+111.6%
Median per capita income in Chandler in 2022:
Chandler:
$40,773
State:
$21,050
Change in median per capita income between 2000 and 2022:
Chandler, Arizona:
+123.1%
State:
+138.4%
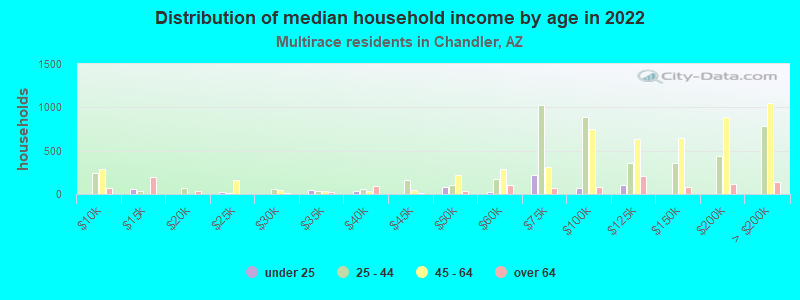
Income statistics for Multirace residents
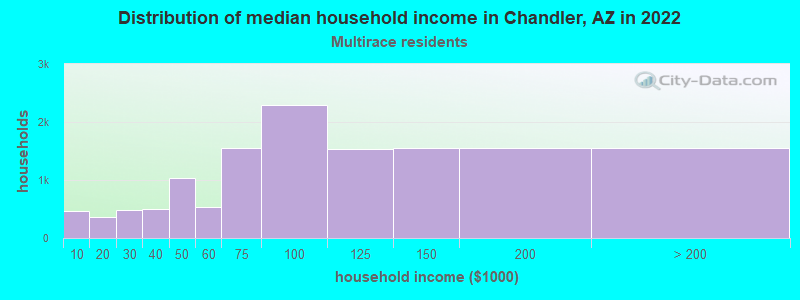
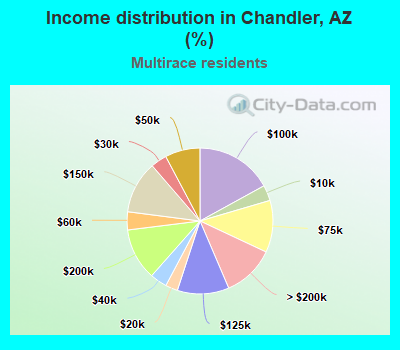
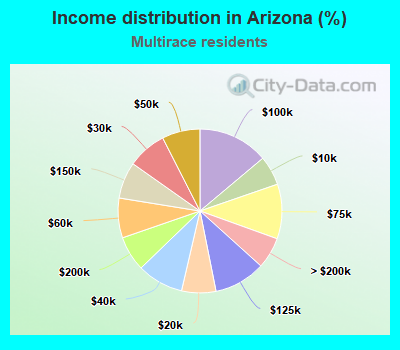
Median household income in Chandler, AZ in 2022:
Chandler:
$89,114
State:
$66,284
Change in median household income between 2000 and 2022:
Chandler, Arizona:
+77.5%
State:
+98.6%
Number of households with income < $10k:
Chandler:
3.5% (464)
State:
5.8% (24,677)
Number of households with income $10k - 20k:
Chandler:
2.7% (365)
State:
6.8% (28,565)
Number of households with income $20k - 30k:
Chandler:
3.6% (482)
State:
7.7% (32,660)
Number of households with income $30k - 40k:
Chandler:
3.8% (507)
Arizona:
9.2% (38,745)
Number of households with income $40k - 50k:
Chandler:
7.8% (1,042)
State:
7.5% (31,750)
Number of households with income $50k - 60k:
Chandler:
4.0% (540)
Arizona:
7.8% (33,167)
Number of households with income $60k - 75k:
Chandler:
11.5% (1,548)
State:
10.8% (45,631)
Number of households with income $75k - 100k:
Chandler:
17.0% (2,285)
State:
13.9% (58,742)
Number of households with income $100k - 125k:
Chandler:
11.5% (1,541)
State:
10.2% (43,070)
Number of households with income $125k - 150k:
Chandler:
11.6% (1,560)
State:
7.2% (30,530)
Number of households with income $150k - 200k:
Chandler:
11.5% (1,545)
Arizona:
6.9% (29,297)
Number of households with income > $200k:
Chandler:
11.6% (1,557)
State:
6.2% (26,145)
Aggregate household income in Chandler in 2022: $1,486,778,400
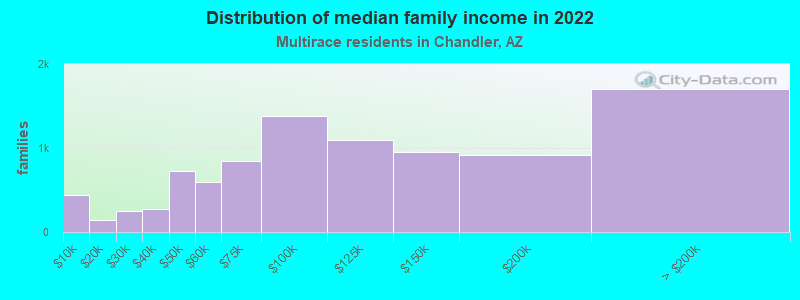
Median family income in Chandler in 2022:
Chandler:
$89,864
State:
$71,421
Number of families with income < $10k:
Chandler:
4.8% (446)
Arizona:
5.0% (15,121)
Number of families with income $10k - 20k:
Chandler:
1.6% (145)
State:
4.5% (13,758)
Number of families with income $20k - 30k:
Chandler:
2.7% (250)
State:
7.5% (22,763)
Number of families with income $30k - 40k:
Chandler:
2.9% (270)
State:
9.2% (27,841)
Number of families with income $40k - 50k:
Chandler:
7.8% (732)
Arizona:
7.3% (22,274)
Number of families with income $50k - 60k:
Chandler:
6.4% (599)
State:
8.0% (24,296)
Number of families with income $60k - 75k:
Chandler:
9.0% (844)
State:
10.7% (32,543)
Number of families with income $75k - 100k:
Chandler:
14.8% (1,384)
State:
14.5% (44,046)
Number of families with income $100k - 125k:
Chandler:
11.7% (1,093)
Arizona:
11.3% (34,200)
Number of families with income $125k - 150k:
Chandler:
10.2% (954)
State:
8.0% (24,358)
Number of families with income $150k - 200k:
Chandler:
9.8% (911)
State:
7.3% (22,232)
Number of families with income > $200k:
Chandler:
18.3% (1,707)
State:
6.7% (20,418)
Median non-family income in Chandler in 2022:
Chandler:
$61,690
State:
$44,915
Change in median non-family income between 2000 and 2022:
Chandler, Arizona:
+96.3%
State:
+104.6%
Median per capita income in Chandler in 2022:
Chandler:
$33,155
Arizona:
$26,631
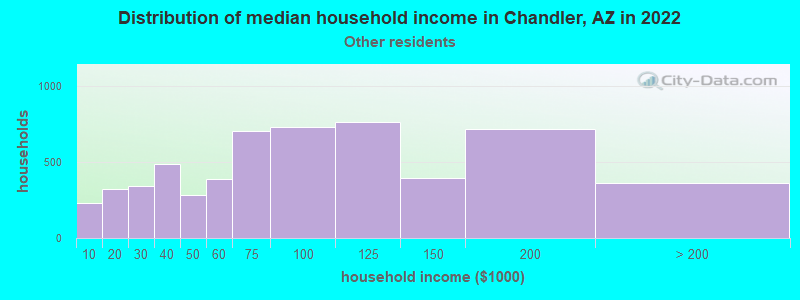
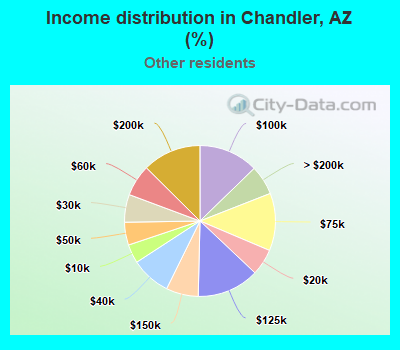
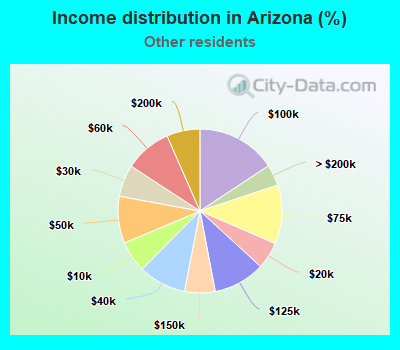
Income statistics for other residents
Median household income in Chandler, AZ in 2022:
Chandler:
$101,304
Arizona:
$66,037
Number of households with income < $10k:
Chandler:
4.0% (231)
Arizona:
6.2% (14,060)
Number of households with income $10k - 20k:
Chandler:
5.7% (324)
State:
5.3% (12,078)
Number of households with income $20k - 30k:
Chandler:
5.9% (340)
Arizona:
6.3% (14,356)
Number of households with income $30k - 40k:
Chandler:
8.5% (488)
State:
9.4% (21,474)
Number of households with income $40k - 50k:
Chandler:
4.9% (281)
State:
9.3% (21,097)
Number of households with income $50k - 60k:
Chandler:
6.8% (387)
Arizona:
9.2% (21,028)
Number of households with income $60k - 75k:
Chandler:
12.3% (706)
State:
11.6% (26,501)
Number of households with income $75k - 100k:
Chandler:
12.7% (730)
Arizona:
15.7% (35,820)
Number of households with income $100k - 125k:
Chandler:
13.3% (764)
State:
10.2% (23,227)
Number of households with income $125k - 150k:
Chandler:
6.9% (396)
State:
6.0% (13,705)
Number of households with income $150k - 200k:
Chandler:
12.6% (719)
State:
6.6% (14,946)
Number of households with income > $200k:
Chandler:
6.3% (362)
State:
4.2% (9,491)
Aggregate household income in Chandler in 2022: $460,498,600
Median family income in Chandler in 2022:
Chandler:
$102,264
State:
$70,703
Number of families with income < $10k:
Chandler:
2.4% (92)
State:
5.2% (8,740)
Number of families with income $10k - 20k:
Chandler:
5.0% (192)
Arizona:
3.9% (6,502)
Number of families with income $20k - 30k:
Chandler:
9.8% (377)
State:
5.8% (9,776)
Number of families with income $30k - 40k:
Chandler:
3.9% (150)
State:
7.4% (12,388)
Number of families with income $40k - 50k:
Chandler:
5.1% (195)
State:
9.9% (16,515)
Number of families with income $50k - 60k:
Chandler:
6.6% (254)
State:
9.6% (16,023)
Number of families with income $60k - 75k:
Chandler:
11.0% (426)
State:
11.8% (19,658)
Number of families with income $75k - 100k:
Chandler:
14.7% (568)
State:
17.2% (28,798)
Number of families with income $100k - 125k:
Chandler:
13.3% (512)
Arizona:
10.9% (18,190)
Number of families with income $125k - 150k:
Chandler:
5.8% (224)
Arizona:
6.7% (11,280)
Number of families with income $150k - 200k:
Chandler:
14.4% (557)
State:
6.7% (11,282)
Number of families with income > $200k:
Chandler:
8.0% (309)
Arizona:
4.8% (7,992)
Median non-family income in Chandler in 2022:
Chandler:
$79,355
State:
$42,146
Change in median non-family income between 2000 and 2022:
Chandler, Arizona:
+126.2%
State:
+91.0%
Median per capita income in Chandler in 2022:
Chandler:
$36,331
State:
$26,768
Discuss Chandler, Arizona (AZ) on our hugely popular Arizona forum.