Central Coast, CA (California) Houses and Residents
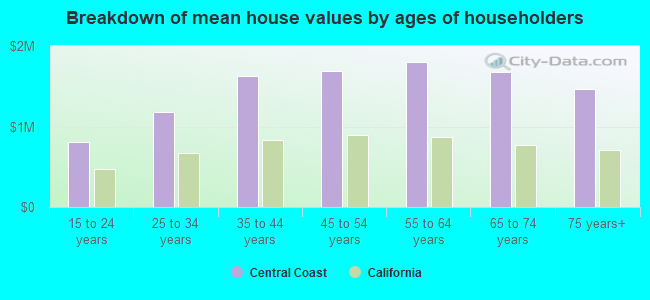
| Central Coast: | $1,446,308 |
| California: | $715,900 |
Total population: 238,434 (Urban population: 230,320, Rural population: 0)
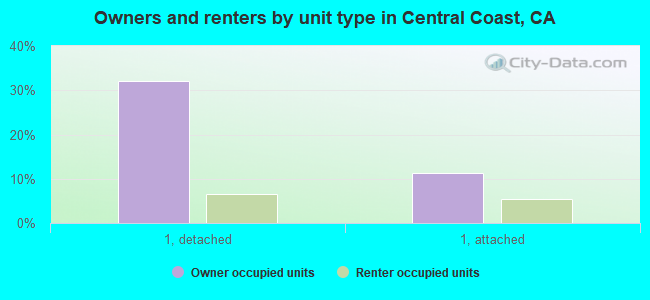
Houses: 96,674 (90,435 occupied: 43,559 owner occupied, 46,876 renter occupied)
| % of renters here: | 52% |
| State: | 44% |
Housing density: 1,919 houses/condos per square mile
Median price asked for vacant for-sale houses and condos in 2022 in this county: $1,279,555.
Median contract rent in 2022: over $2,000 (lower quartile is $1,860, upper quartile is over $2,000)
Median rent asked for vacant for-rent units in 2022: $3,092
Median gross rent in Central Coast, CA in 2022: over $2,000
Housing units in Central Coast with a mortgage: 29,764 (3,451 second mortgage, 3,303 home equity loan, 100 both second mortgage and home equity loan)
Houses without a mortgage: 8,041
Compare current foreclosures near Central Coast, CA:
| Photo | Address | Area | Beds / Baths | Price | Details |
|---|---|---|---|---|---|

|
#1
Via Mariposa E Unit C
Laguna Hills, CA 92637
|
1,325 sq. feet
|
2 baths 2 beds |
$399,000
|
show details |

|
#2
E Jackson Ave Unit C
Anaheim, CA 92806
|
1,266 sq. feet
|
2 baths 3 beds |
show details | |

|
#3
Starburst Ct # 8
Newport Beach, CA 92663
|
1,157 sq. feet
|
2 baths 2 beds |
show details | |

|
#4
S Hilda St
Anaheim, CA 92806
|
1,853 sq. feet
|
4 baths 4 beds |
show details | |

|
#5
San Torini Rd
Mission Viejo, CA 92692
|
1,729 sq. feet
|
2 baths 3 beds |
show details | |

|
#6
Saltaire
Laguna Niguel, CA 92677
|
1,504 sq. feet
|
3 baths 3 beds |
show details | |

|
#7
Golden Gate Ln
Huntington Beach, CA 92649
|
1,563 sq. feet
|
2 baths 4 beds |
show details | |

|
#8
Tulare Dr
Costa Mesa, CA 92626
|
2,400 sq. feet
|
4 baths 4 beds |
show details | |

|
#9
Carmel Dr
Lake Forest, CA 92630
|
1,549 sq. feet
|
2 baths 3 beds |
show details | |

|
#10
S Daisy Ave
Santa Ana, CA 92703
|
1,088 sq. feet
|
1 baths 3 beds |
show details |
| Photo | Address | Area | Beds / Baths | Price | Details |
|---|---|---|---|---|---|

|
#11
Tobago
Laguna Niguel, CA 92677
|
1,605 sq. feet
|
3 baths 3 beds |
show details | |

|
#12
Shady Ln
Laguna Beach, CA 92651
|
995 sq. feet
|
2 baths 3 beds |
show details | |

|
#13
Zancon
Mission Viejo, CA 92692
|
1,123 sq. feet
|
2 baths 3 beds |
show details | |

|
#14
Firebrand St
Garden Grove, CA 92840
|
1,210 sq. feet
|
1 baths 3 beds |
show details | |

|
#15
8th St
Seal Beach, CA 90740
|
- sq. feet
|
3 baths 3 beds |
show details | |

|
#16
Saint Albans Dr
Los Alamitos, CA 90720
|
- sq. feet
|
5 baths 5 beds |
show details | |

|
#17
Karen Ave
Cypress, CA 90630
|
1,108 sq. feet
|
1 baths 3 beds |
show details | |

|
#18
Wedgewood
Irvine, CA 92620
|
2,804 sq. feet
|
3 baths 5 beds |
show details | |

|
#19
Scholarship
Irvine, CA 92612
|
1,349 sq. feet
|
1 baths 1 beds |
show details | |

|
#20
Laurinda Way
Santa Ana, CA 92705
|
1,888 sq. feet
|
2 baths 4 beds |
show details |
| Photo | Address | Area | Beds / Baths | Price | Details |
|---|---|---|---|---|---|

|
#21
Fanwood Dr
Huntington Beach, CA 92649
|
2,336 sq. feet
|
2 baths 3 beds |
show details | |

|
#22
Ridgebury Dr
Huntington Beach, CA 92649
|
1,546 sq. feet
|
2 baths 4 beds |
show details | |

|
#23
Riata St
Midway City, CA 92655
|
1,039 sq. feet
|
1 baths 3 beds |
show details | |

|
#24
N Clementine St
Anaheim, CA 92805
|
1,946 sq. feet
|
2 baths 2 beds |
show details | |

|
#25
W Stevens Ave Unit 129
Santa Ana, CA 92707
|
820 sq. feet
|
1 baths 2 beds |
show details | |

|
#26
Ponderosa St
Fountain Valley, CA 92708
|
2,108 sq. feet
|
3 baths 5 beds |
show details | |

|
#27
Clarissa St
Garden Grove, CA 92840
|
1,098 sq. feet
|
2 baths 3 beds |
show details | |

|
#28
Greenmoor
Irvine, CA 92614
|
1,171 sq. feet
|
2 baths 2 beds |
show details | |

|
#29
E Turin Ave
Anaheim, CA 92805
|
1,436 sq. feet
|
2 baths 3 beds |
show details | |

|
#30
W Cris Ave
Anaheim, CA 92802
|
1,766 sq. feet
|
2 baths 3 beds |
show details |
| Photo | Address | Area | Beds / Baths | Price | Details |
|---|---|---|---|---|---|

|
#31
S Brookhurst St Unit 1104
Anaheim, CA 92804
|
1,172 sq. feet
|
2 baths 3 beds |
show details | |

|
#32
S Hilda St
Anaheim, CA 92806
|
1,820 sq. feet
|
2 baths 4 beds |
show details | |

|
#33
Black Hawk
Irvine, CA 92603
|
4,887 sq. feet
|
4 baths 4 beds |
show details | |

|
#34
W Berkeley St
Santa Ana, CA 92707
|
973 sq. feet
|
1 baths 3 beds |
show details | |

|
#35
Windspun Dr
Huntington Beach, CA 92649
|
1,872 sq. feet
|
3 baths 3 beds |
show details | |

|
#36
E Oshkosh Ave
Anaheim, CA 92806
|
2,850 sq. feet
|
3 baths 5 beds |
show details | |

|
#37
Devonwood Ave
Garden Grove, CA 92841
|
1,238 sq. feet
|
2 baths 3 beds |
show details | |

|
#38
W Willow Ave
Anaheim, CA 92804
|
1,502 sq. feet
|
2 baths 4 beds |
show details | |

|
#39
N Buttonwood St
Anaheim, CA 92805
|
1,293 sq. feet
|
2 baths 3 beds |
show details | |

|
#40
Santa Andrea St
Fountain Valley, CA 92708
|
- sq. feet
|
2 baths 4 beds |
show details |
| Photo | Address | Area | Beds / Baths | Price | Details |
|---|---|---|---|---|---|

|
#41
Eastbridge St
Westminster, CA 92683
|
1,781 sq. feet
|
3 baths 3 beds |
show details | |

|
#42
Geranium
Irvine, CA 92618
|
1,344 sq. feet
|
2 baths 2 beds |
show details | |

|
#43
Seton Rd
Irvine, CA 92612
|
1,779 sq. feet
|
2 baths 3 beds |
show details | |

|
#44
N Malena Dr
Orange, CA 92869
|
1,941 sq. feet
|
2 baths 3 beds |
show details | |

|
#45
Calendula Ave
Fountain Valley, CA 92708
|
1,615 sq. feet
|
2 baths 4 beds |
show details | |

|
#46
S Towner St
Santa Ana, CA 92707
|
1,669 sq. feet
|
2 baths 3 beds |
show details | |

|
#47
Jackson St
Garden Grove, CA 92841
|
- sq. feet
|
1 baths 4 beds |
show details | |

|
#48
S Milton St
Anaheim, CA 92806
|
2,123 sq. feet
|
1 baths 2 beds |
show details | |

|
#49
E Richland Ave
Orange, CA 92865
|
1,781 sq. feet
|
2 baths 4 beds |
show details | |

|
Check over 1 million property listings on Foreclosure.com!
|
browse all offers | |||

Household type by relationship:
Households: 2,970,996- In family households: 2,574,637 (510,612 male householders, 197,879 female householders)
538,268 spouses, 917,395 children (868,578 natural, 16,498 adopted, 32,319 stepchildren), 67,543 grandchildren, 54,495 brothers or sisters, 47,670 parents, foster children, 85,984 other relatives, 117,563 non-relatives
- In nonfamily households: 396,359 (130,596 male householders (87,348 living alone)), 153,694 female householders (120,501 living alone)), 112,069 nonrelatives
- In group quarters: 39,236 (14,531 institutionalized population)
546,370 married couples with children.
125,951 single-parent households (34,925 men, 91,026 women).
70.2% of residents of Central Coast speak English at home.
15.3% of residents speak Spanish at home (42% speak English very well, 24% speak English well, 22% speak English not well, 12% don't speak English at all).
5.6% of residents speak other Indo-European language at home (77% speak English very well, 15% speak English well, 6% speak English not well, 1% don't speak English at all).
8.2% of residents speak Asian or Pacific Island language at home (55% speak English very well, 28% speak English well, 15% speak English not well, 2% don't speak English at all).
0.7% of residents speak other language at home (81% speak English very well, 14% speak English well, 4% speak English not well, 1% don't speak English at all).
Foreign born population: 60,978 (23.9%)
(55.2% of them are naturalized citizens)
| Here: | 6.1 |
| State: | 6.0 |
| Here: | 3.9 |
| State: | 3.9 |
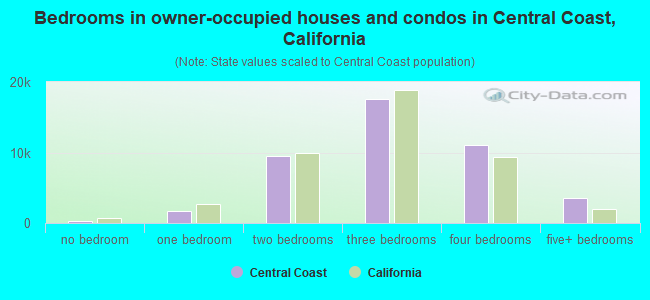
- Bedrooms in owner-occupied houses and condos in Central Coast, California
- 264no bedroom
- 1,7141 bedroom
- 9,4602 bedrooms
- 17,5523 bedrooms
- 11,0284 bedrooms
- 3,5415+ bedrooms
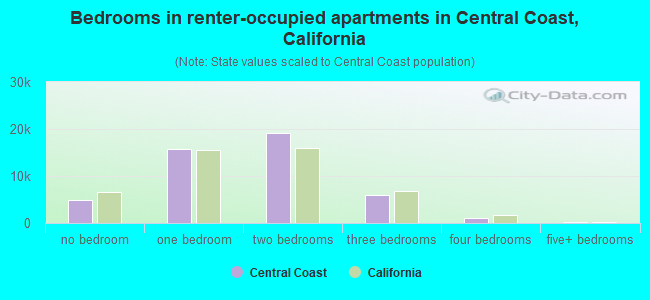
- Bedrooms in renter-occupied apartments in Central Coast, California
- 4,793no bedroom
- 15,6871 bedroom
- 19,1182 bedrooms
- 5,9113 bedrooms
- 1,1534 bedrooms
- 2145+ bedrooms
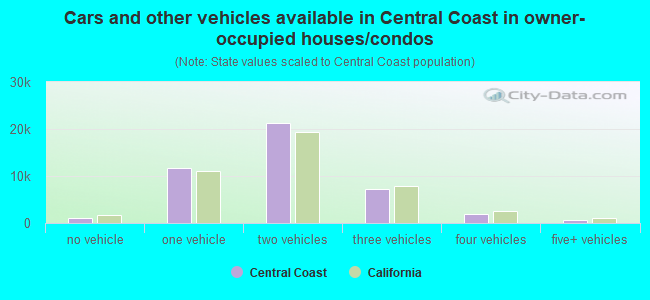
- Cars and other vehicles available in Central Coast in owner-occupied houses/condos
- 975no vehicle
- 11,6541 vehicle
- 21,2642 vehicles
- 7,1283 vehicles
- 1,9154 vehicles
- 6235+ vehicles
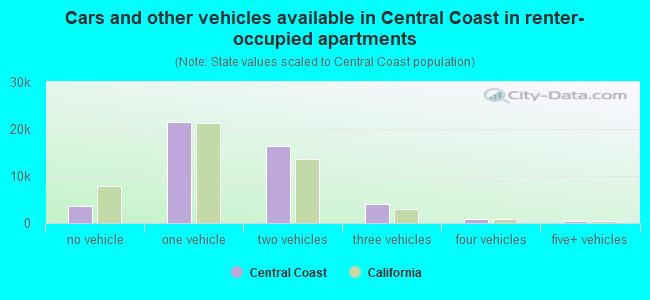
- Cars and other vehicles available in Central Coast in renter-occupied apartments
- 3,576no vehicle
- 21,4591 vehicle
- 16,4892 vehicles
- 4,0233 vehicles
- 9114 vehicles
- 4185+ vehicles
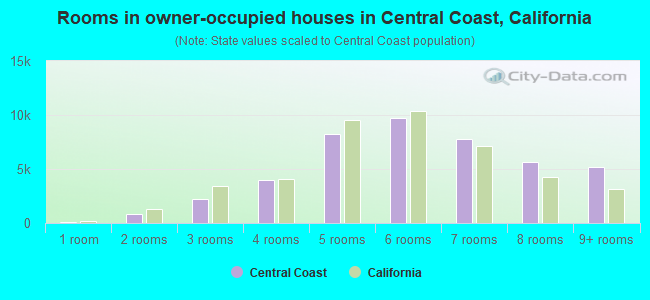
- Rooms in owner-occupied houses in Central Coast, California
- 1081 room
- 8312 rooms
- 2,1933 rooms
- 3,9374 rooms
- 8,2065 rooms
- 9,6826 rooms
- 7,7767 rooms
- 5,6618 rooms
- 5,1659+ rooms
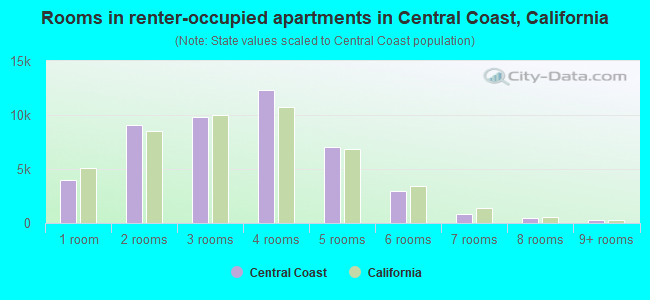
- Rooms in renter-occupied apartments in Central Coast, California
- 3,9931 room
- 9,0642 rooms
- 9,8413 rooms
- 12,3504 rooms
- 7,0835 rooms
- 2,9306 rooms
- 8727 rooms
- 4678 rooms
- 2769+ rooms
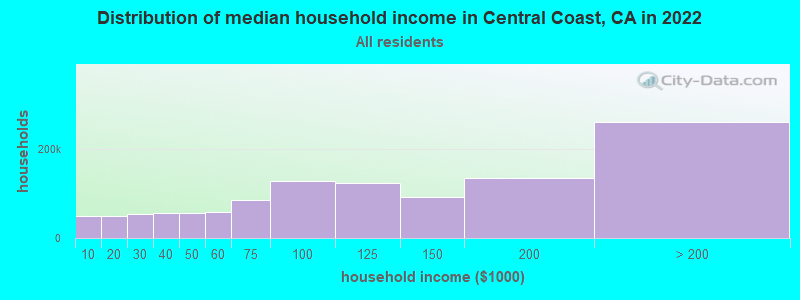
Central Coast, CA household income distribution

- 49,086Less than $10,000
- 50,379$10,000 to $19,999
- 54,724$20,000 to $29,999
- 55,570$30,000 to $39,999
- 55,261$40,000 to $49,999
- 58,456$50,000 to $59,999
- 84,848$60,000 to $74,999
- 128,701$75,000 to $99,999
- 124,552$100,000 to $124,999
- 93,039$125,000 to $149,999
- 135,187$150,000 to $199,999
- 260,420$200,000 or more
Percentage of workers working in this county: 94.5%
Number of people working at home: 25,653 (17.8% of all workers)
Travel time to work (commute)
- Less than 5 minutes: 2,302
- 5 to 9 minutes: 12,370
- 10 to 14 minutes: 22,092
- 15 to 19 minutes: 23,246
- 20 to 24 minutes: 16,851
- 25 to 29 minutes: 5,661
- 30 to 34 minutes: 12,235
- 35 to 39 minutes: 2,003
- 40 to 44 minutes: 2,919
- 45 to 59 minutes: 5,830
- 60 to 89 minutes: 5,153
- 90 or more minutes: 2,470
Means of transportation to work:
- Drove a car alone: 90,659 (75.9%)
- Carpooled: 10,799 (9.0%)
- Bus or trolley bus: 2,878 (2.4%)
- Streetcar or trolley car: 49 (0.0%)
- Subway or elevated: 60 (0.1%)
- Railroad: 127 (0.1%)
- Taxi: 68 (0.1%)
- Motorcycle: 219 (0.2%)
- Bicycle: 2,207 (1.8%)
- Walked: 5,289 (4.4%)
- Other means: 777 (0.7%)
- Worked at home: 6,311 (5.3%)
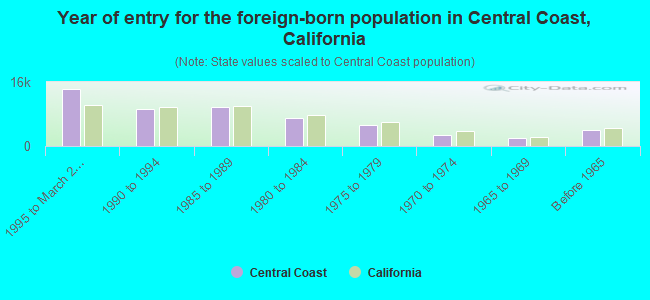
- Year of entry for the foreign-born population in Central Coast, California
- 14,1701995 to March 2000
- 9,3181990 to 1994
- 9,7331985 to 1989
- 7,0861980 to 1984
- 5,2601975 to 1979
- 2,7051970 to 1974
- 2,0081965 to 1969
- 4,096Before 1965
Most common places of birth for foreign-born residents (%):
| Central Coast: | 33.0% (17,923) |
| California: | 44.3% (3,928,701) |
| Central Coast: | 5.1% (2,794) |
| California: | 4.7% (418,249) |
| Central Coast: | 4.8% (2,617) |
| California: | 1.8% (158,613) |
| Central Coast: | 4.6% (2,475) |
| California: | 3.0% (268,452) |
| Central Coast: | 4.1% (2,222) |
| California: | 1.6% (141,181) |
| Central Coast: | 3.7% (2,037) |
| California: | 1.7% (151,775) |
| Central Coast: | 3.6% (1,953) |
| California: | 1.3% (112,212) |
| Central Coast: | 3.3% (1,810) |
| California: | 1.5% (133,090) |
| Central Coast: | 3.3% (1,781) |
| California: | 4.1% (359,673) |
| Central Coast: | 3.2% (1,731) |
| California: | 3.7% (327,611) |
| Central Coast: | 3.1% (1,673) |
| California: | 7.5% (664,935) |
| Central Coast: | 2.3% (1,263) |
| California: | 2.2% (198,201) |
| Central Coast: | 1.9% (1,024) |
| California: | 2.4% (211,458) |
| Central Coast: | 1.8% (988) |
| California: | 1.1% (98,160) |
Place of birth for U.S.-born residents:
- This state: 107,363
- Other state: 66,318
- Northeast: 18,181
- Midwest: 24,792
- South: 11,965
- West: 11,380
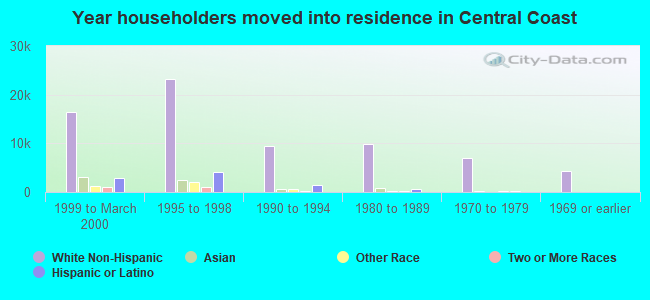
45% of Central Coast residents lived in the same house 5 years ago.
Out of people who lived in different houses, 62% lived in this county.
Out of people who lived in different counties, 67% lived in California.
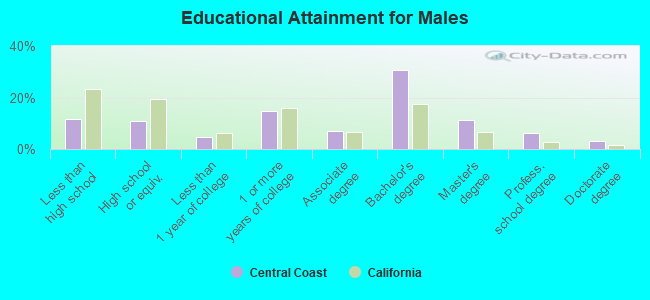
Education attainment for males 25 years and older:
- No schooling: 1,581
- Nursery to 4th grade: 520
- 5th and 6th grade: 1,972
- 7th and 8th grade: 772
- 9th grade: 864
- 10th grade: 534
- 11th grade: 677
- 12th grade, no diploma: 2,139
- High school graduate (or equivalency): 8,615
- Less than 1 year of college: 3,695
- Some college more than 1 year, no degree: 11,406
- Associate degree: 5,307
- Bachelor's degree: 23,770
- Master's degree: 8,840
- Professional school degree: 4,715
- Doctorate degree: 2,460
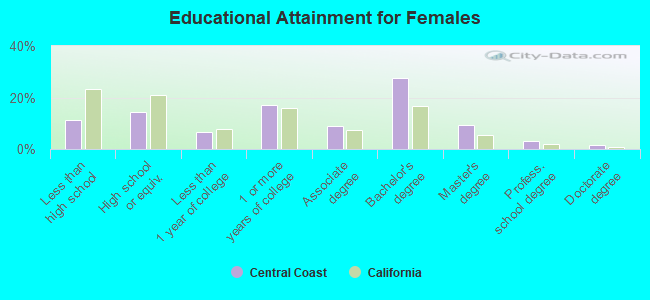
Education attainment for females 25 years and older:
- No schooling: 1,345
- Nursery to 4th grade: 522
- 5th and 6th grade: 1,549
- 7th and 8th grade: 963
- 9th grade: 1,141
- 10th grade: 626
- 11th grade: 675
- 12th grade, no diploma: 1,988
- High school graduate (or equivalency): 11,282
- Less than 1 year of college: 5,317
- Some college more than 1 year, no degree: 13,533
- Associate degree: 6,965
- Bachelor's degree: 21,708
- Master's degree: 7,416
- Professional school degree: 2,408
- Doctorate degree: 1,188
Housing units in structures:
- One, detached: 37,110
- One, attached: 15,796
- Two: 4,826
- 3 or 4: 8,385
- 5 to 9: 5,739
- 10 to 19: 5,157
- 20 to 49: 4,528
- 50 or more: 12,965
- Mobile homes: 1,966
- Boats, RVs, vans, etc.: 202
Median worth of mobile homes: $95,079
Housing units lacking complete kitchen facilities: 0.7%
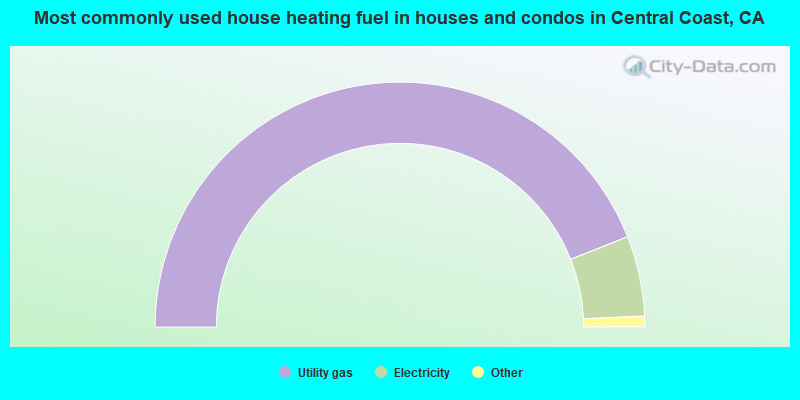
- 87.9%Utility gas
- 10.6%Electricity
- 0.9%Bottled, tank, or LP gas
- 0.3%No fuel used
- 0.1%Wood
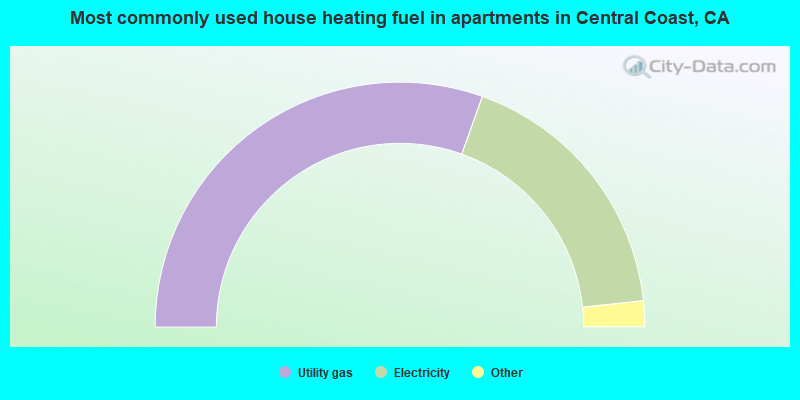
- 61.0%Utility gas
- 35.7%Electricity
- 1.6%No fuel used
- 1.5%Bottled, tank, or LP gas
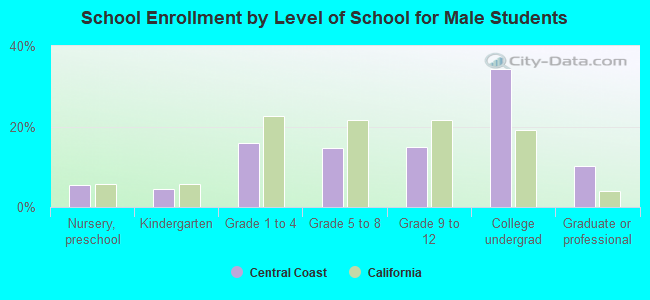
Private vs. public school enrollment:
| Here: | 18.6% |
| California: | 9.9% |
| Here: | 9.1% |
| California: | 7.8% |
| Here: | 12.9% |
| California: | 15.4% |