Central Coast, California (CA) income map, earnings map, and wages data
The median household income in Central Coast, CA in 2022 was $112,570, which was 18.7% greater than the median annual income of $91,551 across the entire state of California. Compared to the median income of $62,343 in 2000 this represents an increase of 44.6%. The per capita income in 2022 was $76,040, which means an increase of 49.7% compared to 2000 when it was $38,249.
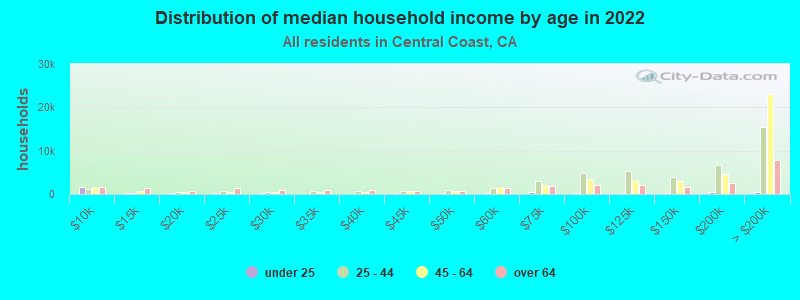
Income statistics for all residents
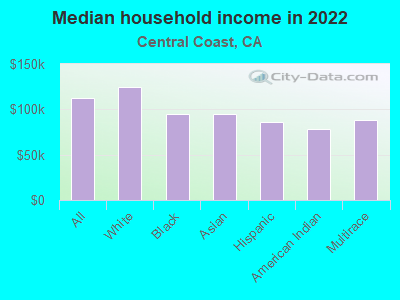
Median household income in Central Coast, CA in 2022:| Central Coast: | $112,570 |
| State: | $91,551 |
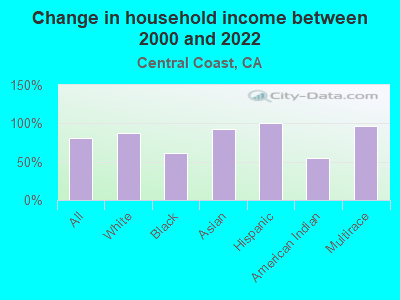
Change in median household income between 2000 and 2022:| Central Coast, California: | +80.6% |
| California: | +92.8% |
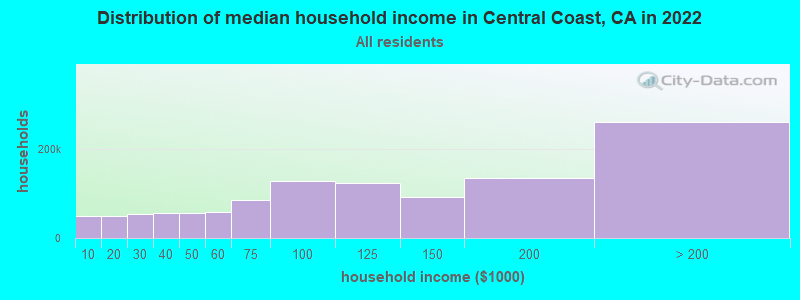
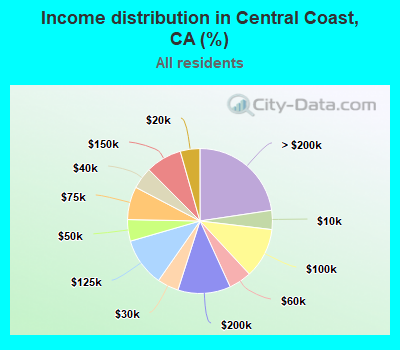
Number of households with income < $10k:| Central Coast: | 4.3% (49,086) |
| State: | 4.8% (654,370) |
Number of households with income $10k - 20k:| Central Coast: | 4.4% (50,379) |
| California: | 5.8% (789,493) |
Number of households with income $20k - 30k:| Central Coast: | 4.8% (54,724) |
| State: | 5.7% (778,318) |
Number of households with income $30k - 40k:| Central Coast: | 4.8% (55,570) |
| State: | 5.8% (783,170) |
Number of households with income $40k - 50k:| Central Coast: | 4.8% (55,261) |
| California: | 5.8% (781,352) |
Number of households with income $50k - 60k:| Central Coast: | 5.1% (58,456) |
| State: | 5.6% (760,175) |
Number of households with income $60k - 75k:| Central Coast: | 7.4% (84,848) |
| State: | 8.2% (1,104,699) |
Number of households with income $75k - 100k:| Central Coast: | 11.2% (128,701) |
| California: | 12.0% (1,627,633) |
Number of households with income $100k - 125k:| Central Coast: | 10.8% (124,552) |
| State: | 10.0% (1,358,619) |
Number of households with income $125k - 150k:| Central Coast: | 8.1% (93,039) |
| California: | 7.6% (1,027,455) |
Number of households with income $150k - 200k:| Central Coast: | 11.8% (135,187) |
| State: | 10.6% (1,439,811) |
Number of households with income > $200k:| Central Coast: | 22.6% (260,420) |
| State: | 18.0% (2,445,491) |
Aggregate household income in Central Coast in 2022: $159,567,360,600
Median family income in Central Coast in 2022:| Central Coast: | $140,740 |
| California: | $104,823 |
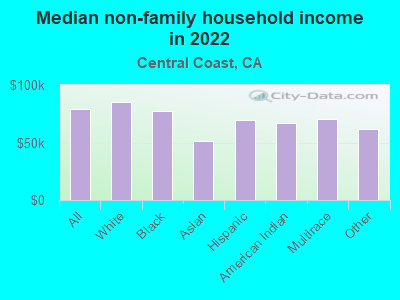
Median non-family income in Central Coast in 2022:| Central Coast: | $79,201 |
| California: | $59,348 |
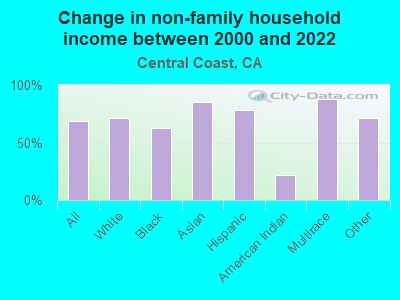
Change in median non-family income between 2000 and 2022:| Central Coast, California: | +68.3% |
| State: | +85.3% |
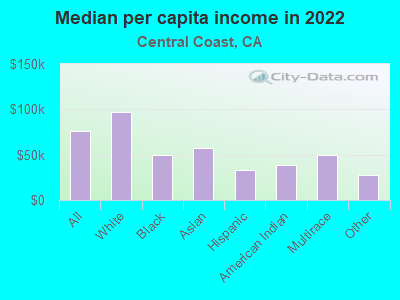
Median per capita income in Central Coast in 2022:| Central Coast: | $76,040 |
| California: | $46,661 |
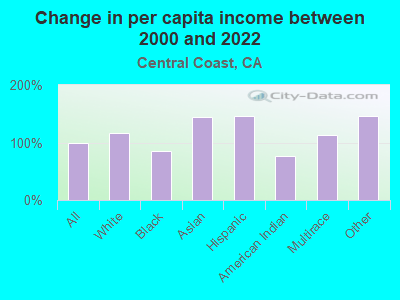
Change in median per capita income between 2000 and 2022:| Central Coast, California: | +98.8% |
| State: | +105.5% |
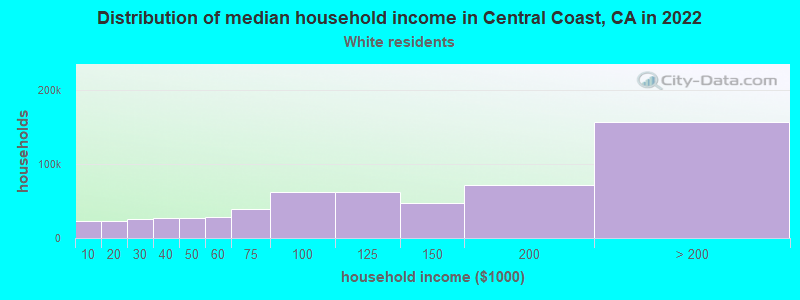
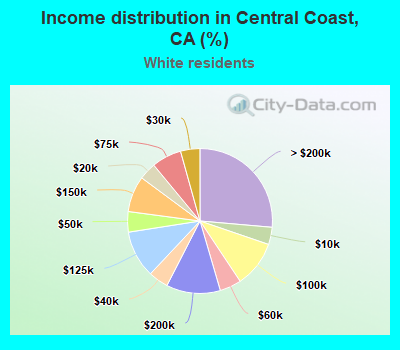
Income statistics for White residents
Median household income in Central Coast, CA in 2022:| Central Coast: | $124,602 |
| State: | $100,917 |
Change in median household income between 2000 and 2022:| Central Coast, California: | +87.0% |
| State: | +96.8% |
Number of households with income < $10k:| Central Coast: | 3.9% (22,803) |
| California: | 4.4% (284,109) |
Number of households with income $10k - 20k:| Central Coast: | 3.9% (22,949) |
| State: | 5.3% (340,330) |
Number of households with income $20k - 30k:| Central Coast: | 4.3% (25,538) |
| State: | 5.3% (343,145) |
Number of households with income $30k - 40k:| Central Coast: | 4.5% (26,346) |
| State: | 5.1% (330,146) |
Number of households with income $40k - 50k:| Central Coast: | 4.6% (27,010) |
| California: | 5.2% (335,310) |
Number of households with income $50k - 60k:| Central Coast: | 4.8% (28,479) |
| State: | 5.1% (326,299) |
Number of households with income $60k - 75k:| Central Coast: | 6.7% (39,476) |
| State: | 7.6% (487,640) |
Number of households with income $75k - 100k:| Central Coast: | 10.4% (61,627) |
| California: | 11.5% (736,578) |
Number of households with income $100k - 125k:| Central Coast: | 10.5% (62,404) |
| State: | 10.1% (648,782) |
Number of households with income $125k - 150k:| Central Coast: | 8.0% (47,559) |
| State: | 7.8% (499,671) |
Number of households with income $150k - 200k:| Central Coast: | 12.1% (71,478) |
| State: | 11.4% (729,603) |
Number of households with income > $200k:| Central Coast: | 26.4% (156,302) |
| State: | 21.2% (1,364,246) |
Aggregate household income in Central Coast in 2022: $89,082,228,600
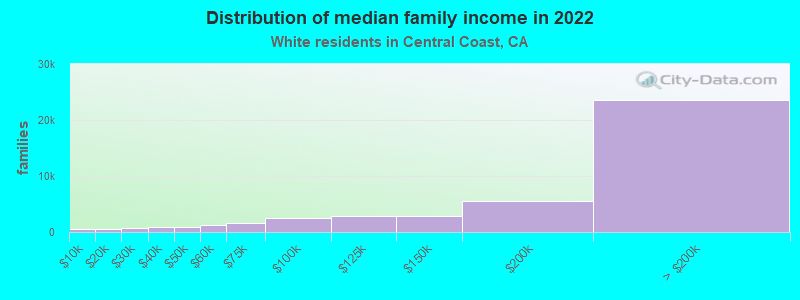
Median family income in Central Coast in 2022:| Central Coast: | $165,056 |
| State: | $125,379 |
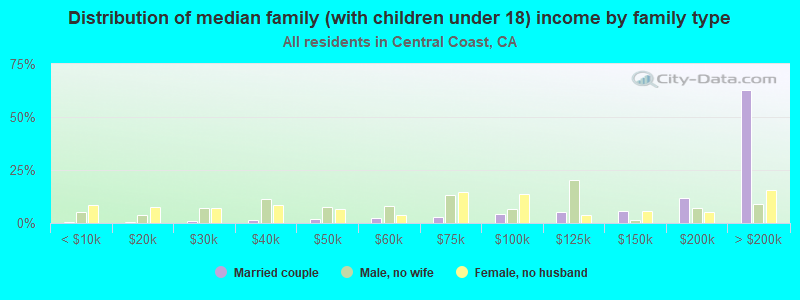
Number of families with income < $10k:| Central Coast: | 1.3% (543) |
| State: | 2.2% (87,079) |
Number of families with income $10k - 20k:| Central Coast: | 1.3% (560) |
| State: | 2.5% (97,716) |
Number of families with income $20k - 30k:| Central Coast: | 1.5% (632) |
| State: | 3.5% (137,295) |
Number of families with income $30k - 40k:| Central Coast: | 2.0% (849) |
| California: | 3.9% (152,947) |
Number of families with income $40k - 50k:| Central Coast: | 1.9% (839) |
| State: | 4.3% (169,197) |
Number of families with income $50k - 60k:| Central Coast: | 2.8% (1,211) |
| State: | 4.5% (176,192) |
Number of families with income $60k - 75k:| Central Coast: | 3.5% (1,531) |
| California: | 7.0% (274,752) |
Number of families with income $75k - 100k:| Central Coast: | 5.8% (2,537) |
| State: | 11.3% (445,632) |
Number of families with income $100k - 125k:| Central Coast: | 6.4% (2,797) |
| State: | 10.7% (423,630) |
Number of families with income $125k - 150k:| Central Coast: | 6.7% (2,913) |
| State: | 9.1% (357,408) |
Number of families with income $150k - 200k:| Central Coast: | 12.7% (5,493) |
| State: | 13.5% (532,693) |
Number of families with income > $200k:| Central Coast: | 54.1% (23,492) |
| State: | 27.6% (1,086,948) |
Median non-family income in Central Coast in 2022:| Central Coast: | $85,113 |
| State: | $62,819 |
Change in median non-family income between 2000 and 2022:| Central Coast, California: | +71.6% |
| California: | +84.4% |
Median per capita income in Central Coast in 2022:| Central Coast: | $97,051 |
| California: | $61,706 |
Change in median per capita income between 2000 and 2022:| Central Coast, California: | +117.3% |
| State: | +122.7% |
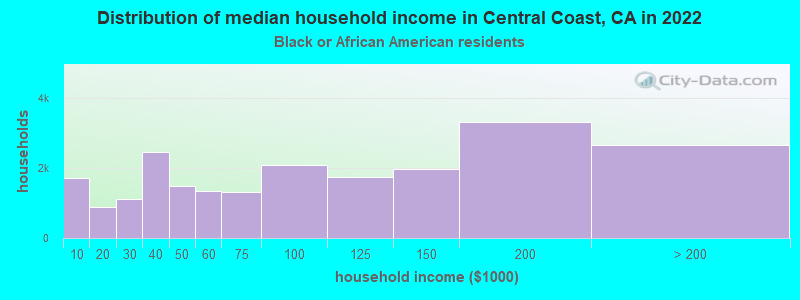
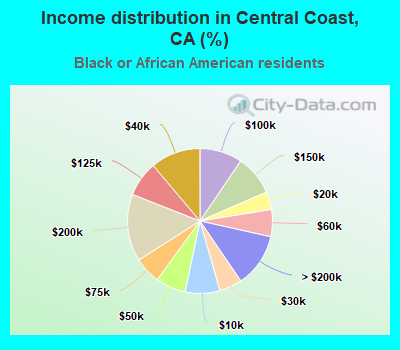
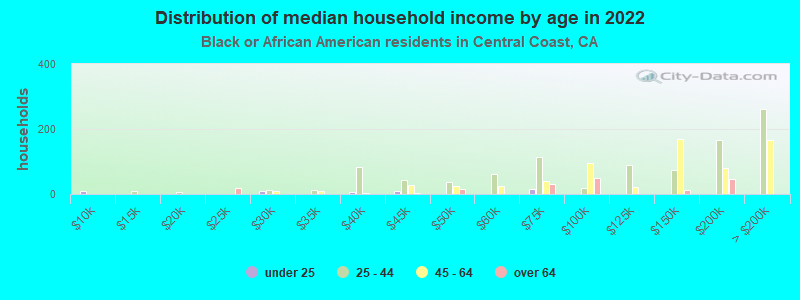
Income statistics for Black or African American residents
Median household income in Central Coast, CA in 2022:| Central Coast: | $94,675 |
| State: | $63,268 |
Change in median household income between 2000 and 2022:| Central Coast, California: | +61.1% |
| California: | +81.0% |
Number of households with income < $10k:| Central Coast: | 7.8% (1,718) |
| California: | 9.0% (73,219) |
Number of households with income $10k - 20k:| Central Coast: | 4.0% (889) |
| State: | 10.6% (86,666) |
Number of households with income $20k - 30k:| Central Coast: | 5.1% (1,126) |
| State: | 7.1% (57,719) |
Number of households with income $30k - 40k:| Central Coast: | 11.1% (2,467) |
| State: | 7.2% (58,714) |
Number of households with income $40k - 50k:| Central Coast: | 6.7% (1,483) |
| State: | 7.1% (58,075) |
Number of households with income $50k - 60k:| Central Coast: | 6.0% (1,333) |
| State: | 6.8% (55,229) |
Number of households with income $60k - 75k:| Central Coast: | 5.9% (1,313) |
| State: | 8.8% (71,895) |
Number of households with income $75k - 100k:| Central Coast: | 9.5% (2,101) |
| State: | 11.9% (96,893) |
Number of households with income $100k - 125k:| Central Coast: | 7.9% (1,747) |
| State: | 8.7% (70,729) |
Number of households with income $125k - 150k:| Central Coast: | 9.0% (1,989) |
| California: | 6.3% (51,211) |
Number of households with income $150k - 200k:| Central Coast: | 15.0% (3,324) |
| State: | 7.2% (58,687) |
Number of households with income > $200k:| Central Coast: | 12.0% (2,655) |
| State: | 9.3% (75,487) |
Aggregate household income in Central Coast in 2022: $136,448,620
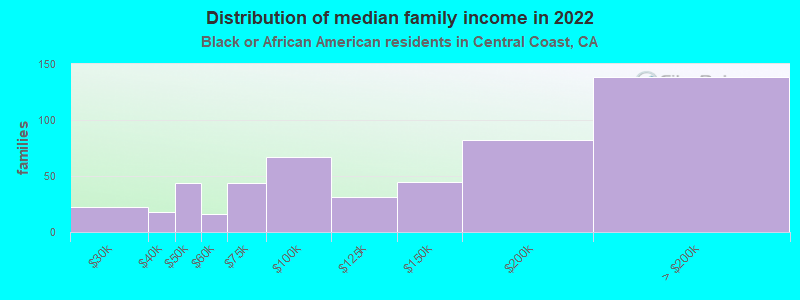
Median family income in Central Coast in 2022:| Central Coast: | $106,392 |
| State: | $77,263 |
Number of families with income $20k - 30k:| Central Coast: | 4.3% (22) |
| California: | 5.6% (25,755) |
Number of families with income $30k - 40k:| Central Coast: | 3.6% (18) |
| State: | 6.8% (30,948) |
Number of families with income $40k - 50k:| Central Coast: | 8.8% (44) |
| State: | 8.3% (38,171) |
Number of families with income $50k - 60k:| Central Coast: | 3.1% (16) |
| California: | 7.0% (31,860) |
Number of families with income $60k - 75k:| Central Coast: | 8.7% (44) |
| California: | 8.7% (40,021) |
Number of families with income $75k - 100k:| Central Coast: | 13.3% (67) |
| State: | 12.4% (56,846) |
Number of families with income $100k - 125k:| Central Coast: | 6.1% (31) |
| California: | 9.8% (44,911) |
Number of families with income $125k - 150k:| Central Coast: | 8.9% (45) |
| State: | 7.5% (34,434) |
Number of families with income $150k - 200k:| Central Coast: | 16.1% (82) |
| California: | 9.3% (42,807) |
Number of families with income > $200k:| Central Coast: | 27.2% (138) |
| California: | 12.2% (56,093) |
Median non-family income in Central Coast in 2022:| Central Coast: | $77,315 |
| State: | $41,942 |
Change in median non-family income between 2000 and 2022:| Central Coast, California: | +63.0% |
| California: | +72.0% |
Median per capita income in Central Coast in 2022:| Central Coast: | $50,147 |
| State: | $36,708 |
Change in median per capita income between 2000 and 2022:| Central Coast, California: | +86.3% |
| California: | +110.4% |
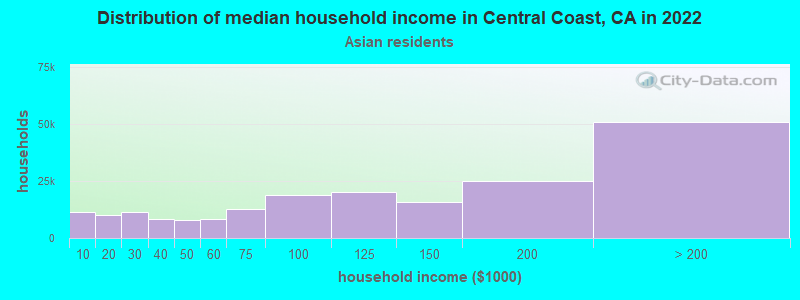
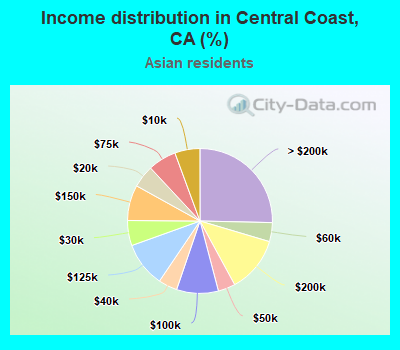
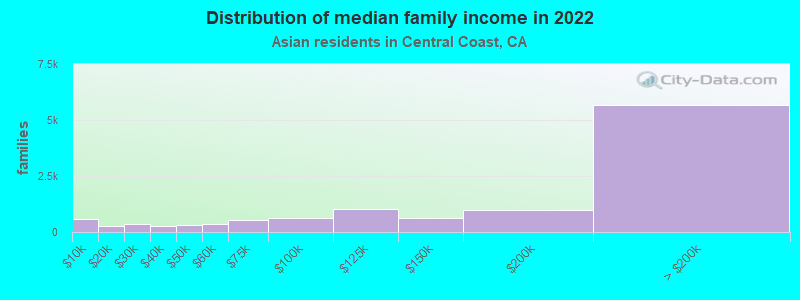
Income statistics for Asian residents
Median household income in Central Coast, CA in 2022:| Central Coast: | $94,810 |
| State: | $119,861 |
Change in median household income between 2000 and 2022:| Central Coast, California: | +92.2% |
| California: | +116.5% |
Number of households with income < $10k:| Central Coast: | 5.6% (11,244) |
| State: | 5.1% (106,273) |
Number of households with income $10k - 20k:| Central Coast: | 5.0% (10,012) |
| California: | 4.9% (101,815) |
Number of households with income $20k - 30k:| Central Coast: | 5.6% (11,213) |
| State: | 4.6% (94,414) |
Number of households with income $30k - 40k:| Central Coast: | 4.2% (8,443) |
| State: | 4.1% (84,491) |
Number of households with income $40k - 50k:| Central Coast: | 3.8% (7,699) |
| State: | 4.0% (81,758) |
Number of households with income $50k - 60k:| Central Coast: | 4.2% (8,493) |
| State: | 3.9% (80,971) |
Number of households with income $60k - 75k:| Central Coast: | 6.3% (12,676) |
| State: | 6.0% (124,194) |
Number of households with income $75k - 100k:| Central Coast: | 9.3% (18,671) |
| California: | 9.7% (200,337) |
Number of households with income $100k - 125k:| Central Coast: | 10.1% (20,142) |
| State: | 9.4% (193,488) |
Number of households with income $125k - 150k:| Central Coast: | 7.9% (15,891) |
| State: | 7.7% (158,253) |
Number of households with income $150k - 200k:| Central Coast: | 12.5% (24,967) |
| California: | 12.2% (252,139) |
Number of households with income > $200k:| Central Coast: | 25.4% (50,783) |
| State: | 28.4% (586,641) |
Aggregate household income in Central Coast in 2022: $9,149,687,817
Median family income in Central Coast in 2022:| Central Coast: | $128,811 |
| State: | $136,040 |
Number of families with income < $10k:| Central Coast: | 5.0% (577) |
| State: | 2.8% (42,046) |
Number of families with income $10k - 20k:| Central Coast: | 2.3% (266) |
| State: | 3.1% (46,821) |
Number of families with income $20k - 30k:| Central Coast: | 3.0% (349) |
| State: | 4.1% (61,519) |
Number of families with income $30k - 40k:| Central Coast: | 2.2% (259) |
| State: | 3.7% (55,234) |
Number of families with income $40k - 50k:| Central Coast: | 2.8% (319) |
| California: | 3.9% (58,471) |
Number of families with income $50k - 60k:| Central Coast: | 3.0% (342) |
| State: | 3.9% (58,911) |
Number of families with income $60k - 75k:| Central Coast: | 4.5% (520) |
| State: | 5.9% (88,675) |
Number of families with income $75k - 100k:| Central Coast: | 5.5% (642) |
| State: | 9.5% (143,103) |
Number of families with income $100k - 125k:| Central Coast: | 8.9% (1,035) |
| California: | 9.4% (142,085) |
Number of families with income $125k - 150k:| Central Coast: | 5.5% (635) |
| State: | 8.0% (120,635) |
Number of families with income $150k - 200k:| Central Coast: | 8.3% (960) |
| State: | 13.2% (198,099) |
Number of families with income > $200k:| Central Coast: | 49.0% (5,675) |
| California: | 32.5% (489,303) |
Median non-family income in Central Coast in 2022:| Central Coast: | $51,206 |
| State: | $74,216 |
Change in median non-family income between 2000 and 2022:| Central Coast, California: | +85.5% |
| State: | +136.3% |
Median per capita income in Central Coast in 2022:| Central Coast: | $57,037 |
| California: | $58,824 |
Change in median per capita income between 2000 and 2022:| Central Coast, California: | +144.1% |
| State: | +166.8% |
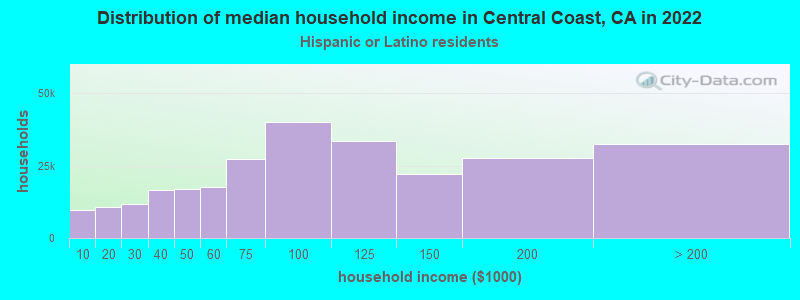
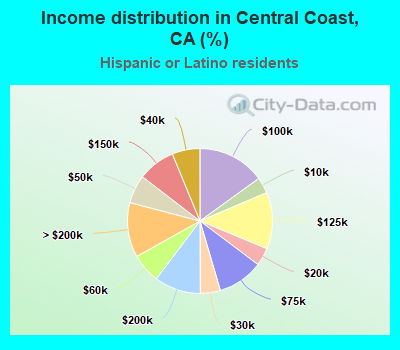
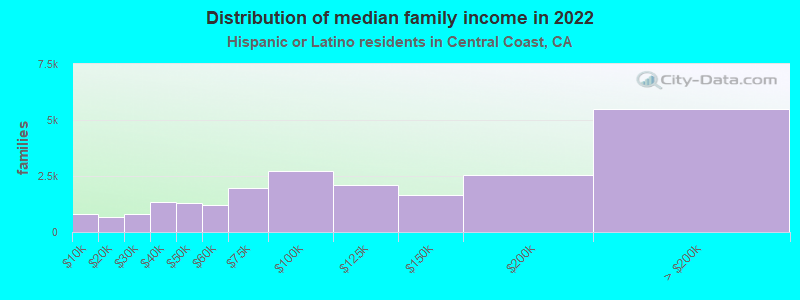
Income statistics for Hispanic or Latino residents
Median household income in Central Coast, CA in 2022:| Central Coast: | $86,171 |
| California: | $75,698 |
Change in median household income between 2000 and 2022:| Central Coast, California: | +99.6% |
| State: | +107.2% |
Number of households with income < $10k:| Central Coast: | 3.6% (9,511) |
| California: | 4.3% (183,294) |
Number of households with income $10k - 20k:| Central Coast: | 4.0% (10,702) |
| California: | 6.0% (253,903) |
Number of households with income $20k - 30k:| Central Coast: | 4.5% (11,900) |
| State: | 6.8% (286,386) |
Number of households with income $30k - 40k:| Central Coast: | 6.2% (16,558) |
| State: | 7.4% (313,728) |
Number of households with income $40k - 50k:| Central Coast: | 6.4% (16,923) |
| State: | 7.4% (313,199) |
Number of households with income $50k - 60k:| Central Coast: | 6.6% (17,460) |
| California: | 7.2% (305,366) |
Number of households with income $60k - 75k:| Central Coast: | 10.2% (27,162) |
| State: | 10.3% (434,937) |
Number of households with income $75k - 100k:| Central Coast: | 15.0% (40,038) |
| State: | 14.4% (607,302) |
Number of households with income $100k - 125k:| Central Coast: | 12.6% (33,630) |
| California: | 10.6% (447,424) |
Number of households with income $125k - 150k:| Central Coast: | 8.3% (22,181) |
| State: | 7.5% (316,022) |
Number of households with income $150k - 200k:| Central Coast: | 10.4% (27,593) |
| State: | 9.2% (386,269) |
Number of households with income > $200k:| Central Coast: | 12.2% (32,535) |
| California: | 8.8% (372,651) |
Aggregate household income in Central Coast in 2022: $7,528,976,414
Median family income in Central Coast in 2022:| Central Coast: | $78,039 |
| California: | $77,589 |
Number of families with income < $10k:| Central Coast: | 3.5% (785) |
| State: | 3.9% (129,468) |
Number of families with income $10k - 20k:| Central Coast: | 2.9% (663) |
| State: | 4.6% (151,997) |
Number of families with income $20k - 30k:| Central Coast: | 3.6% (808) |
| California: | 6.6% (216,764) |
Number of families with income $30k - 40k:| Central Coast: | 5.9% (1,325) |
| California: | 7.6% (249,849) |
Number of families with income $40k - 50k:| Central Coast: | 5.7% (1,274) |
| California: | 7.7% (254,822) |
Number of families with income $50k - 60k:| Central Coast: | 5.4% (1,210) |
| California: | 7.4% (244,815) |
Number of families with income $60k - 75k:| Central Coast: | 8.6% (1,945) |
| California: | 10.5% (345,838) |
Number of families with income $75k - 100k:| Central Coast: | 12.1% (2,717) |
| State: | 14.9% (491,589) |
Number of families with income $100k - 125k:| Central Coast: | 9.3% (2,100) |
| State: | 10.7% (355,400) |
Number of families with income $125k - 150k:| Central Coast: | 7.4% (1,668) |
| State: | 7.8% (259,317) |
Number of families with income $150k - 200k:| Central Coast: | 11.4% (2,564) |
| California: | 9.3% (306,566) |
Number of families with income > $200k:| Central Coast: | 24.3% (5,482) |
| State: | 9.1% (299,984) |
Median non-family income in Central Coast in 2022:| Central Coast: | $69,411 |
| State: | $49,746 |
Change in median non-family income between 2000 and 2022:| Central Coast, California: | +78.5% |
| California: | +100.7% |
Median per capita income in Central Coast in 2022:| Central Coast: | $32,576 |
| California: | $27,240 |
Change in median per capita income between 2000 and 2022:| Central Coast, California: | +146.0% |
| State: | +133.3% |
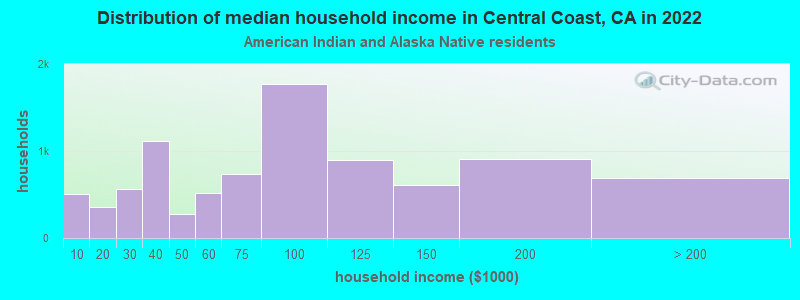
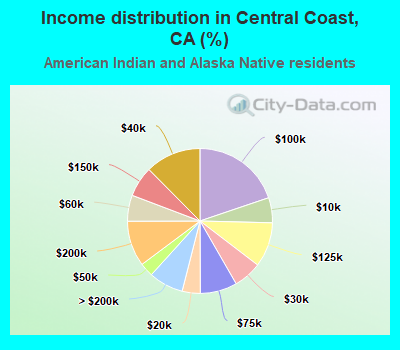
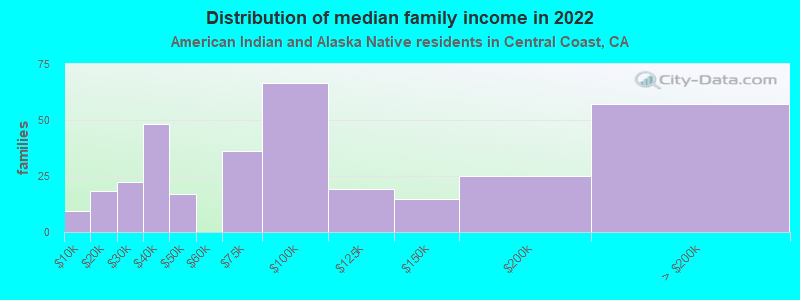
Income statistics for American Indian and Alaska Native residents
Median household income in Central Coast, CA in 2022:| Central Coast: | $78,544 |
| California: | $76,752 |
Change in median household income between 2000 and 2022:| Central Coast, California: | +55.4% |
| California: | +110.0% |
Number of households with income < $10k:| Central Coast: | 5.6% (501) |
| State: | 5.4% (8,471) |
Number of households with income $10k - 20k:| Central Coast: | 4.0% (362) |
| State: | 6.0% (9,381) |
Number of households with income $20k - 30k:| Central Coast: | 6.3% (564) |
| State: | 5.5% (8,668) |
Number of households with income $30k - 40k:| Central Coast: | 12.4% (1,112) |
| California: | 8.3% (13,030) |
Number of households with income $40k - 50k:| Central Coast: | 3.1% (274) |
| State: | 6.9% (10,908) |
Number of households with income $50k - 60k:| Central Coast: | 5.8% (521) |
| State: | 7.1% (11,198) |
Number of households with income $60k - 75k:| Central Coast: | 8.2% (738) |
| State: | 9.6% (15,190) |
Number of households with income $75k - 100k:| Central Coast: | 19.8% (1,775) |
| State: | 14.1% (22,274) |
Number of households with income $100k - 125k:| Central Coast: | 10.0% (894) |
| State: | 11.2% (17,643) |
Number of households with income $125k - 150k:| Central Coast: | 6.8% (610) |
| State: | 8.3% (13,117) |
Number of households with income $150k - 200k:| Central Coast: | 10.2% (911) |
| California: | 8.8% (13,853) |
Number of households with income > $200k:| Central Coast: | 7.7% (694) |
| State: | 8.8% (13,925) |
Aggregate household income in Central Coast in 2022: $57,016,628
Median family income in Central Coast in 2022:| Central Coast: | $75,441 |
| California: | $81,108 |
Number of families with income < $10k:| Central Coast: | 2.8% (9) |
| State: | 5.0% (5,711) |
Number of families with income $10k - 20k:| Central Coast: | 5.5% (18) |
| State: | 3.7% (4,148) |
Number of families with income $20k - 30k:| Central Coast: | 6.7% (22) |
| State: | 4.3% (4,876) |
Number of families with income $30k - 40k:| Central Coast: | 14.4% (48) |
| State: | 8.8% (9,994) |
Number of families with income $40k - 50k:| Central Coast: | 5.0% (17) |
| State: | 7.8% (8,776) |
Number of families with income $60k - 75k:| Central Coast: | 10.8% (36) |
| California: | 9.1% (10,247) |
Number of families with income $75k - 100k:| Central Coast: | 19.9% (66) |
| California: | 14.8% (16,731) |
Number of families with income $100k - 125k:| Central Coast: | 5.7% (19) |
| State: | 12.0% (13,609) |
Number of families with income $125k - 150k:| Central Coast: | 4.5% (15) |
| California: | 8.0% (9,104) |
Number of families with income $150k - 200k:| Central Coast: | 7.5% (25) |
| California: | 9.5% (10,721) |
Number of families with income > $200k:| Central Coast: | 17.1% (57) |
| California: | 10.1% (11,409) |
Median non-family income in Central Coast in 2022:| Central Coast: | $67,291 |
| State: | $51,296 |
Change in median non-family income between 2000 and 2022:| Central Coast, California: | +21.3% |
| California: | +114.0% |
Median per capita income in Central Coast in 2022:| Central Coast: | $38,899 |
| State: | $30,289 |
Change in median per capita income between 2000 and 2022:| Central Coast, California: | +76.7% |
| State: | +98.9% |
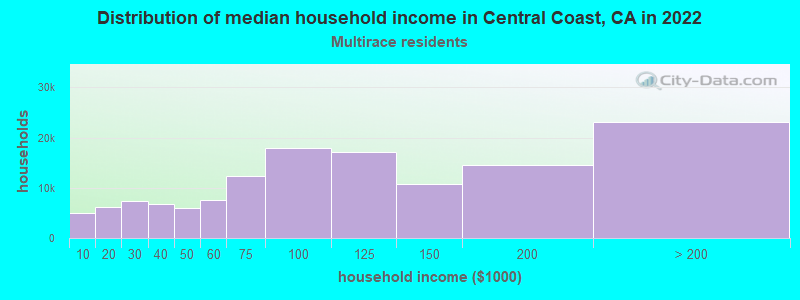
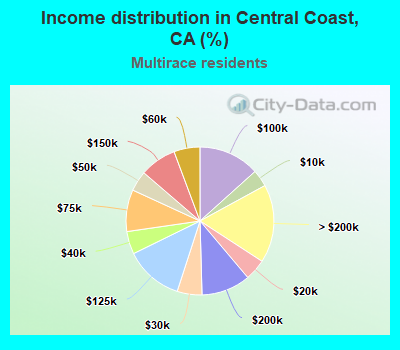
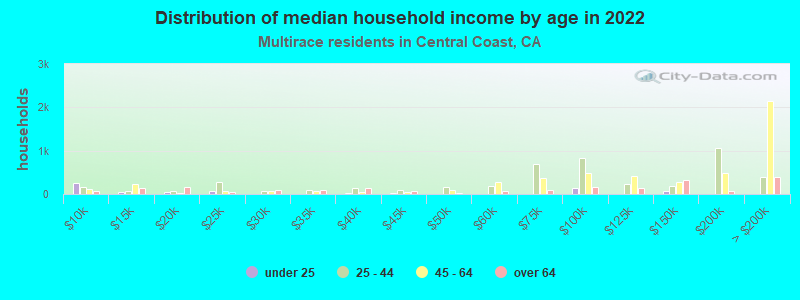
Income statistics for Multirace residents
Median household income in Central Coast, CA in 2022:| Central Coast: | $88,064 |
| California: | $83,153 |
Change in median household income between 2000 and 2022:| Central Coast, California: | +96.3% |
| California: | +106.0% |
Number of households with income < $10k:| Central Coast: | 3.7% (4,994) |
| State: | 4.2% (85,299) |
Number of households with income $10k - 20k:| Central Coast: | 4.7% (6,269) |
| California: | 6.1% (122,966) |
Number of households with income $20k - 30k:| Central Coast: | 5.4% (7,308) |
| State: | 6.4% (129,328) |
Number of households with income $30k - 40k:| Central Coast: | 5.0% (6,693) |
| State: | 6.4% (130,070) |
Number of households with income $40k - 50k:| Central Coast: | 4.4% (5,980) |
| State: | 6.5% (131,254) |
Number of households with income $50k - 60k:| Central Coast: | 5.7% (7,661) |
| State: | 6.5% (132,382) |
Number of households with income $60k - 75k:| Central Coast: | 9.1% (12,328) |
| State: | 9.4% (191,472) |
Number of households with income $75k - 100k:| Central Coast: | 13.3% (17,983) |
| State: | 13.3% (269,691) |
Number of households with income $100k - 125k:| Central Coast: | 12.7% (17,172) |
| California: | 10.2% (207,286) |
Number of households with income $125k - 150k:| Central Coast: | 8.0% (10,798) |
| State: | 7.8% (158,259) |
Number of households with income $150k - 200k:| Central Coast: | 10.7% (14,464) |
| California: | 10.3% (209,227) |
Number of households with income > $200k:| Central Coast: | 17.1% (23,087) |
| California: | 13.0% (263,210) |
Aggregate household income in Central Coast in 2022: $1,755,324,641
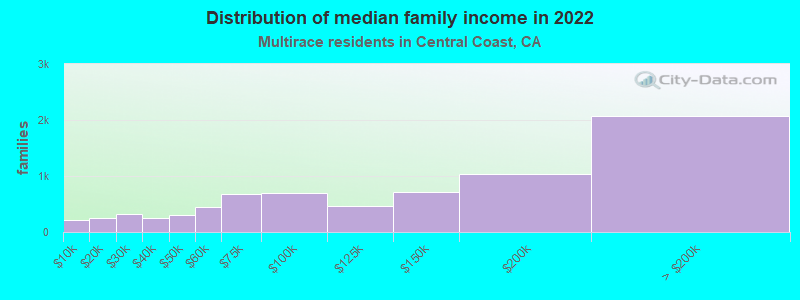
Median family income in Central Coast in 2022:| Central Coast: | $102,132 |
| California: | $87,642 |
Number of families with income < $10k:| Central Coast: | 2.8% (210) |
| California: | 3.2% (48,017) |
Number of families with income $10k - 20k:| Central Coast: | 3.4% (255) |
| California: | 4.1% (60,419) |
Number of families with income $20k - 30k:| Central Coast: | 4.3% (323) |
| California: | 6.1% (89,742) |
Number of families with income $30k - 40k:| Central Coast: | 3.3% (245) |
| State: | 6.2% (91,415) |
Number of families with income $40k - 50k:| Central Coast: | 4.0% (302) |
| California: | 6.8% (100,085) |
Number of families with income $50k - 60k:| Central Coast: | 6.0% (451) |
| State: | 6.7% (98,298) |
Number of families with income $60k - 75k:| Central Coast: | 9.0% (672) |
| State: | 9.5% (140,131) |
Number of families with income $75k - 100k:| Central Coast: | 9.4% (699) |
| State: | 13.8% (203,439) |
Number of families with income $100k - 125k:| Central Coast: | 6.2% (465) |
| California: | 10.4% (153,515) |
Number of families with income $125k - 150k:| Central Coast: | 9.7% (722) |
| California: | 8.4% (124,115) |
Number of families with income $150k - 200k:| Central Coast: | 13.9% (1,035) |
| State: | 10.9% (161,643) |
Number of families with income > $200k:| Central Coast: | 27.9% (2,077) |
| State: | 14.0% (207,317) |
Median non-family income in Central Coast in 2022:| Central Coast: | $70,784 |
| California: | $56,558 |
Change in median non-family income between 2000 and 2022:| Central Coast, California: | +88.1% |
| California: | +100.2% |
Median per capita income in Central Coast in 2022:| Central Coast: | $49,570 |
| State: | $32,124 |
Change in median per capita income between 2000 and 2022:| Central Coast, California: | +113.1% |
| State: | +120.4% |
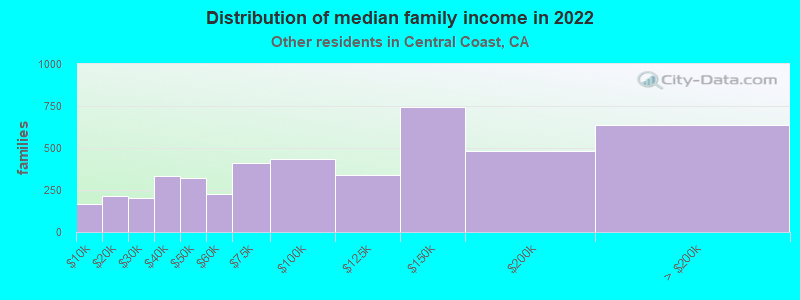
Income statistics for other residents
Number of households with income < $10k:| Central Coast: | 3.4% (401) |
| State: | 4.6% (93,035) |
Number of households with income $10k - 20k:| Central Coast: | 5.0% (585) |
| California: | 6.3% (126,222) |
Number of households with income $20k - 30k:| Central Coast: | 3.9% (462) |
| State: | 7.1% (142,656) |
Number of households with income $30k - 40k:| Central Coast: | 6.2% (727) |
| California: | 8.2% (165,018) |
Number of households with income $40k - 50k:| Central Coast: | 8.3% (976) |
| State: | 8.0% (161,732) |
Number of households with income $50k - 60k:| Central Coast: | 7.2% (838) |
| State: | 7.6% (152,152) |
Number of households with income $60k - 75k:| Central Coast: | 10.8% (1,270) |
| State: | 10.4% (209,951) |
Number of households with income $75k - 100k:| Central Coast: | 15.4% (1,801) |
| State: | 14.7% (296,102) |
Number of households with income $100k - 125k:| Central Coast: | 11.6% (1,358) |
| State: | 10.7% (214,281) |
Number of households with income $125k - 150k:| Central Coast: | 8.9% (1,038) |
| State: | 7.1% (143,092) |
Number of households with income $150k - 200k:| Central Coast: | 10.0% (1,172) |
| California: | 8.6% (172,215) |
Number of households with income > $200k:| Central Coast: | 9.2% (1,078) |
| California: | 6.7% (134,102) |
Aggregate household income in Central Coast in 2022: $1,191,703,466
Median family income in Central Coast in 2022:| Central Coast: | $67,832 |
| State: | $72,756 |
Number of families with income < $10k:| Central Coast: | 3.7% (166) |
| State: | 4.3% (69,090) |
Number of families with income $10k - 20k:| Central Coast: | 4.8% (215) |
| State: | 5.1% (82,116) |
Number of families with income $20k - 30k:| Central Coast: | 4.4% (200) |
| State: | 7.0% (112,854) |
Number of families with income $30k - 40k:| Central Coast: | 7.4% (334) |
| California: | 8.4% (135,938) |
Number of families with income $40k - 50k:| Central Coast: | 7.1% (321) |
| California: | 8.4% (135,353) |
Number of families with income $50k - 60k:| Central Coast: | 5.1% (228) |
| California: | 7.7% (124,826) |
Number of families with income $60k - 75k:| Central Coast: | 9.1% (409) |
| California: | 10.7% (173,628) |
Number of families with income $75k - 100k:| Central Coast: | 9.6% (435) |
| California: | 15.2% (245,724) |
Number of families with income $100k - 125k:| Central Coast: | 7.5% (337) |
| State: | 10.9% (176,716) |
Number of families with income $125k - 150k:| Central Coast: | 16.5% (744) |
| State: | 7.4% (119,985) |
Number of families with income $150k - 200k:| Central Coast: | 10.7% (483) |
| California: | 8.5% (137,332) |
Number of families with income > $200k:| Central Coast: | 14.1% (638) |
| State: | 6.6% (106,346) |
Median non-family income in Central Coast in 2022:| Central Coast: | $61,674 |
| State: | $43,881 |
Change in median non-family income between 2000 and 2022:| Central Coast, California: | +71.6% |
| California: | +84.6% |
Median per capita income in Central Coast in 2022:| Central Coast: | $27,872 |
| California: | $25,164 |
Change in median per capita income between 2000 and 2022:| Central Coast, California: | +146.3% |
| State: | +137.9% |