Brookside, DE (Delaware) Houses and Residents
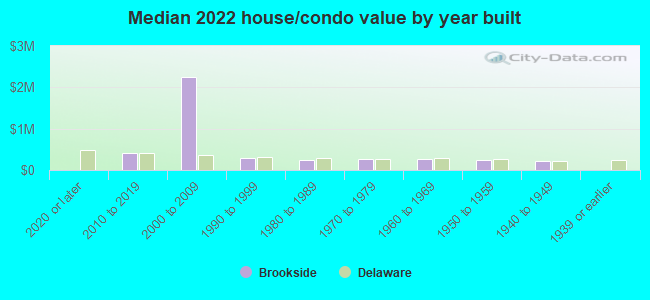
| Brookside: | $257,402 |
| Delaware: | $337,200 |
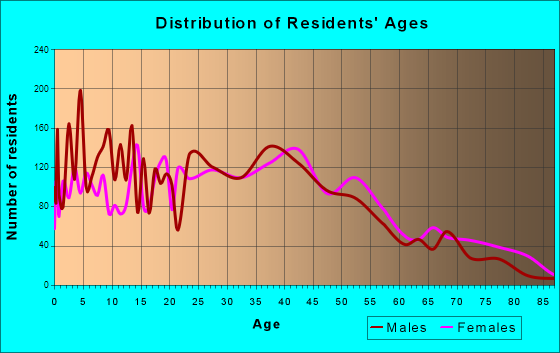
Total population: 14,353 (All urban)
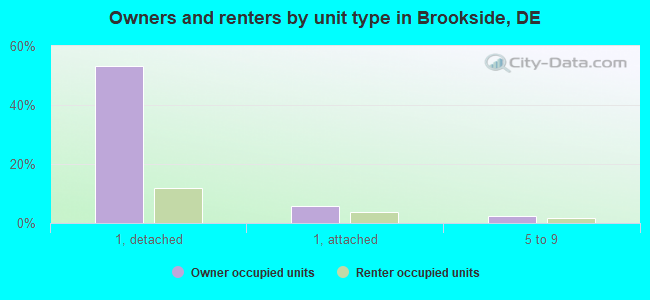
Houses: 5,887 (5,545 occupied: 3,381 owner occupied, 2,184 renter occupied)
| % of renters here: | 39% |
| State: | 26% |
Housing density: 1,506 houses/condos per square mile
Median price asked for vacant for-sale houses and condos in 2022: $189,151.
Median contract rent in 2022: $1,262 (lower quartile is $981, upper quartile is $1,479)
Median rent asked for vacant for-rent units in 2022: $868
Median gross rent in Brookside, DE in 2022: $1,379
Housing units in Brookside with a mortgage: 2,174 (150 second mortgage, 0 home equity loan, 80 both second mortgage and home equity loan)
Houses without a mortgage: 52
Median household income for houses/condos with a mortgage: $85,057
Median household income for apartments without a mortgage: $64,286
Median monthly housing costs: $1,291
Compare current foreclosures near Brookside, DE:
| Photo | Address | Area | Beds / Baths | Price | Details |
|---|---|---|---|---|---|

|
#1
N Pine St
Wilmington, DE 19802
|
1,125 sq. feet
|
1 baths 3 beds |
$199,900
|
show details |

|
#2
W Broadway
Salem, NJ 08079
|
2,869 sq. feet
|
2 baths 3 beds |
$90,900
|
show details |

|
#3
N Norman Ave
Penns Grove, NJ 08069
|
882 sq. feet
|
1 baths 2 beds |
$74,900
|
show details |

|
#4
Media Rd
Oxford, PA 19363
|
1,155 sq. feet
|
1 baths 2 beds |
$211,938
|
show details |

|
#5
Hazel Ave
Kennett Square, PA 19348
|
2,344 sq. feet
|
2 baths 3 beds |
$198,715
|
show details |

|
#6
Walnut Valley Rd
Chadds Ford, PA 19317
|
2,248 sq. feet
|
2 baths 3 beds |
$518,830
|
show details |

|
#7
S Guernsey Rd
West Grove, PA 19390
|
2,400 sq. feet
|
3 baths 6 beds |
$283,973
|
show details |

|
#8
Mimosa Cir
Kennett Square, PA 19348
|
2,024 sq. feet
|
2 baths 3 beds |
$500,493
|
show details |

|
#9
Schoolview Ln
Oxford, PA 19363
|
3,504 sq. feet
|
2 baths 4 beds |
$346,389
|
show details |

|
#10
Ewing Rd
Cochranville, PA 19330
|
3,110 sq. feet
|
1 baths 6 beds |
$471,404
|
show details |
| Photo | Address | Area | Beds / Baths | Price | Details |
|---|---|---|---|---|---|

|
#11
Township Rd
Lincoln University, PA 19352
|
1,596 sq. feet
|
1 baths 2 beds |
$273,125
|
show details |

|
#12
Barnsley Rd
Oxford, PA 19363
|
1,288 sq. feet
|
1 baths 3 beds |
$176,718
|
show details |

|
#13
Birkdale Cir
Avondale, PA 19311
|
3,334 sq. feet
|
2 baths 4 beds |
$368,645
|
show details |

|
#14
Gap Newport Pike
Avondale, PA 19311
|
1,094 sq. feet
|
1 baths 3 beds |
$10,236
|
show details |

|
#15
Briarcliff Cir
West Grove, PA 19390
|
3,423 sq. feet
|
2 baths 4 beds |
$337,610
|
show details |

|
#16
Flint Hill Rd
Landenberg, PA 19350
|
960 sq. feet
|
1 baths 2 beds |
$75,282
|
show details |

|
#17
Conner Rd
Oxford, PA 19363
|
1,568 sq. feet
|
2 baths 3 beds |
$217,831
|
show details |

|
#18
Little John Cir
Avondale, PA 19311
|
2,668 sq. feet
|
2 baths 4 beds |
$389,391
|
show details |

|
#19
Automotive Blvd
Elkton, MD 21921
|
2,644 sq. feet
|
2 baths 4 beds |
show details | |

|
#20
White Birch Dr
North East, MD 21901
|
1,028 sq. feet
|
2 baths 3 beds |
show details |
| Photo | Address | Area | Beds / Baths | Price | Details |
|---|---|---|---|---|---|

|
#21
Karlyn Dr
New Castle, DE 19720
|
1,026 sq. feet
|
1 baths 3 beds |
show details | |

|
#22
Seton Dr
Wilmington, DE 19809
|
2,100 sq. feet
|
3 baths 4 beds |
show details | |

|
#23
Milestone Rd
Elkton, MD 21921
|
1,260 sq. feet
|
2 baths 4 beds |
show details | |

|
#24
Church Rd
Avondale, PA 19311
|
4,158 sq. feet
|
2 baths 4 beds |
show details | |

|
#25
Sanford Rd
Pennsville, NJ 08070
|
1,188 sq. feet
|
1 baths 3 beds |
show details | |

|
#26
Browning Cir
Middletown, DE 19709
|
2,424 sq. feet
|
2 baths 4 beds |
show details | |

|
#27
3rd Ave
Claymont, DE 19703
|
950 sq. feet
|
1 baths 3 beds |
show details | |

|
#28
Maple Ave
Pennsville, NJ 08070
|
1,143 sq. feet
|
1 baths 3 beds |
show details | |

|
#29
Remington Way
West Grove, PA 19390
|
5,130 sq. feet
|
4 baths 4 beds |
show details | |

|
#30
Bonnie Marie Ln
Elkton, MD 21921
|
2,779 sq. feet
|
2 baths 4 beds |
show details |
| Photo | Address | Area | Beds / Baths | Price | Details |
|---|---|---|---|---|---|

|
#31
Taft Ave
Penns Grove, NJ 08069
|
1,030 sq. feet
|
1 baths 2 beds |
show details | |

|
#32
S 4th St
Oxford, PA 19363
|
- sq. feet
|
2 baths 3 beds |
show details | |

|
#33
Kirkwood St
Wilmington, DE 19801
|
1,375 sq. feet
|
1 baths 3 beds |
show details | |

|
#34
Paxson Rd
Cochranville, PA 19330
|
988 sq. feet
|
1 baths 2 beds |
show details | |

|
#35
Rocky Glen Rd
Oxford, PA 19363
|
2,191 sq. feet
|
2 baths 4 beds |
show details | |

|
#36
E Hillcrest Ave
West Grove, PA 19390
|
2,359 sq. feet
|
2 baths 3 beds |
show details | |

|
#37
Hamilton Rd
Landenberg, PA 19350
|
2,733 sq. feet
|
2 baths 4 beds |
show details | |

|
#38
Kimbelot Ln
Landenberg, PA 19350
|
2,282 sq. feet
|
2 baths 4 beds |
show details | |

|
#39
Mullen Dr
Avondale, PA 19311
|
- sq. feet
|
- baths - beds |
$201,741
|
show details |

|
#40
Deepdale Dr
Kennett Square, PA 19348
|
2,607 sq. feet
|
2 baths 3 beds |
show details |
| Photo | Address | Area | Beds / Baths | Price | Details |
|---|---|---|---|---|---|

|
#41
Egypt Run Rd
Landenberg, PA 19350
|
5,552 sq. feet
|
4 baths 4 beds |
show details | |

|
#42
Clonmell Upland Rd
West Grove, PA 19390
|
- sq. feet
|
- baths - beds |
$351,061
|
show details |

|
#43
Commerce St
Oxford, PA 19363
|
- sq. feet
|
- baths - beds |
$218,179
|
show details |

|
#44
Denbigh Chase
Kennett Square, PA 19348
|
3,556 sq. feet
|
4 baths 5 beds |
show details | |

|
#45
Pennsylvania Ave
Avondale, PA 19311
|
1,896 sq. feet
|
1 baths 3 beds |
show details | |

|
#46
Federal Walk
Kennett Square, PA 19348
|
1,824 sq. feet
|
2 baths 3 beds |
show details | |

|
#47
Elbow Ln
Landenberg, PA 19350
|
2,030 sq. feet
|
2 baths 4 beds |
show details | |

|
#48
Newport Pike
Avondale, PA 19311
|
- sq. feet
|
- baths - beds |
$272,285
|
show details |

|
#49
Quill Ct
Oxford, PA 19363
|
2,454 sq. feet
|
2 baths 3 beds |
show details | |

|
Check over 1 million property listings on Foreclosure.com!
|
browse all offers | |||

Latest news about housing in Brookside, DE collected exclusively by city-data.com from local newspapers, TV, and radio stations

 | Safe and reasonable apartments in Newark Delaware?? (0 replies) |
| Looking for answers in regard to relocating to NCC (6 replies) |
| Relocating from NJ to Newark, DE (3 replies) |
| Leaving Delaware after 40+ years. What do you want to know? (129 replies) |
| Sidewalk Repair in Brookside (1 reply) |
| Help with neighborhoods in Newark DE (4 replies) |
Median year apartment built: 1974
Household type by relationship:
Households: 14,454- Male householders: 2,632 (702 living alone), Female householders: 2,892 (1,103 living alone)
2,334 spouses (2,305 opposite-sex spouses), 431 unmarried partners, (413 opposite-sex unmarried partners), 4,190 children (3,995 natural, 120 adopted, 75 stepchildren), 306 grandchildren, 266 brothers or sisters, 220 parents, 30 foster children, 392 other relatives, 664 non-relatives
- In group quarters: 90
Size of family households: 1,032 2-persons, 876 3-persons, 609 4-persons, 312 5-persons, 145 6-persons, 273 7-or-more-persons.
Size of nonfamily households: 1,848 1-person, 472 2-persons, 27 3-persons, 5 5-persons.
1,763 married couples with children.
993 single-parent households (116 men, 877 women).
70.4% of residents of Brookside speak English at home.
16.5% of residents speak Spanish at home (61% speak English very well, 27% speak English well, 7% speak English not well, 6% don't speak English at all).
2.3% of residents speak other Indo-European language at home (85% speak English very well, 5% speak English well, 6% speak English not well, 5% don't speak English at all).
5.5% of residents speak Asian or Pacific Island language at home (79% speak English very well, 20% speak English well, 1% speak English not well).
4.8% of residents speak other language at home (47% speak English very well, 34% speak English well, 19% speak English not well).
Foreign born population: 2,956 (20.5%)
(42.5% of them are naturalized citizens)
| Here: | 6.4 |
| State: | 6.9 |
| Here: | 4.7 |
| State: | 4.4 |
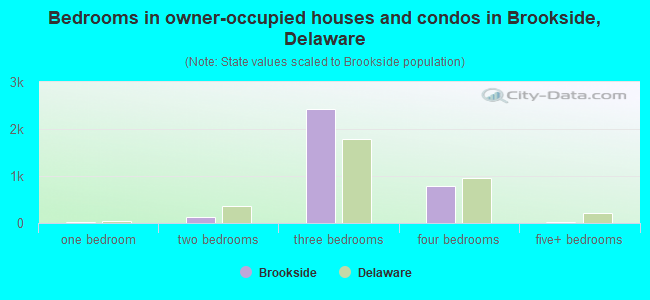
- Bedrooms in owner-occupied houses and condos in Brookside, Delaware
- 0no bedroom
- 121 bedroom
- 1312 bedrooms
- 2,4363 bedrooms
- 7804 bedrooms
- 225+ bedrooms
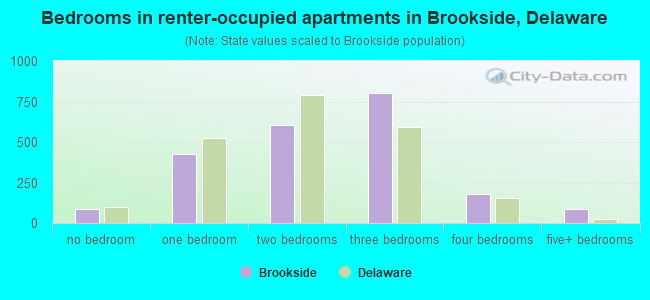
- Bedrooms in renter-occupied apartments in Brookside, Delaware
- 89no bedroom
- 4241 bedroom
- 6052 bedrooms
- 8013 bedrooms
- 1784 bedrooms
- 885+ bedrooms
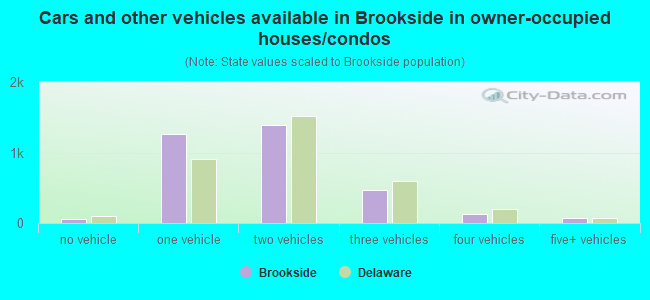
- Cars and other vehicles available in Brookside in owner-occupied houses/condos
- 54no vehicle
- 1,2581 vehicle
- 1,3932 vehicles
- 4653 vehicles
- 1344 vehicles
- 775+ vehicles
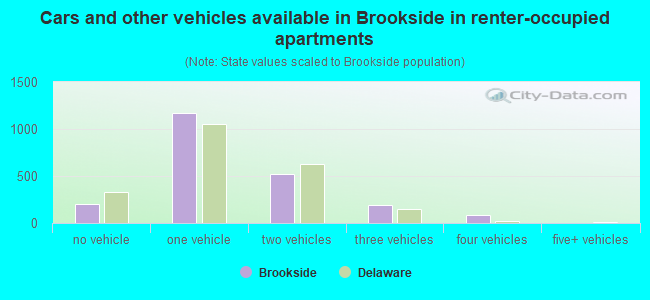
- Cars and other vehicles available in Brookside in renter-occupied apartments
- 206no vehicle
- 1,1701 vehicle
- 5252 vehicles
- 1943 vehicles
- 894 vehicles
- 05+ vehicles
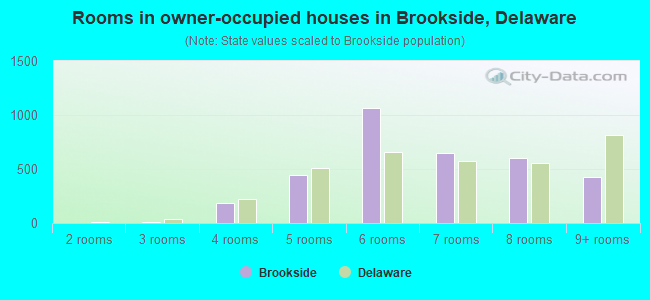
- Rooms in owner-occupied houses in Brookside, Delaware
- 01 room
- 02 rooms
- 73 rooms
- 1864 rooms
- 4435 rooms
- 1,0676 rooms
- 6507 rooms
- 6068 rooms
- 4239+ rooms
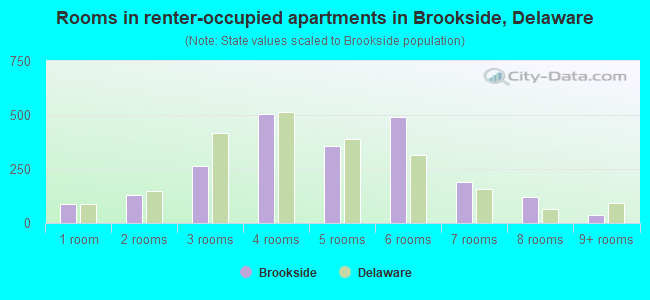
- Rooms in renter-occupied apartments in Brookside, Delaware
- 891 room
- 1292 rooms
- 2663 rooms
- 5044 rooms
- 3585 rooms
- 4926 rooms
- 1907 rooms
- 1208 rooms
- 379+ rooms
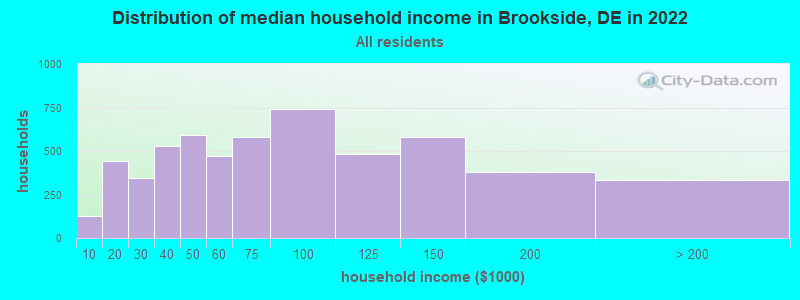
Brookside, DE household income distribution

- 124Less than $10,000
- 442$10,000 to $19,999
- 345$20,000 to $29,999
- 526$30,000 to $39,999
- 591$40,000 to $49,999
- 472$50,000 to $59,999
- 581$60,000 to $74,999
- 742$75,000 to $99,999
- 481$100,000 to $124,999
- 583$125,000 to $149,999
- 379$150,000 to $199,999
- 333$200,000 or more
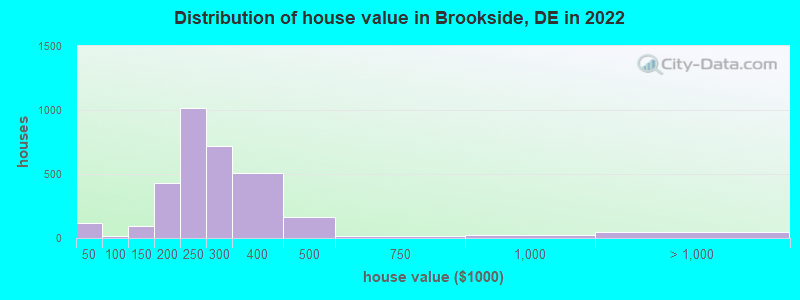
Home value of owner - occupied houses in 2022 in Brookside, DE
-
- 1Less than $10,000
- 16$15,000 to $19,999
- 21$20,000 to $24,999
- 76$25,000 to $29,999
- 7$50,000 to $59,999
- 5$80,000 to $89,999
- 5$90,000 to $99,999
- 31$100,000 to $124,999
- 58$125,000 to $149,999
- 209$150,000 to $174,999
- 216$175,000 to $199,999
- 1,015$200,000 to $249,999
- 716$250,000 to $299,999
- 503$300,000 to $399,999
- 167$400,000 to $499,999
- 16$500,000 to $749,999
- 22$750,000 to $999,999
- 48$2,000,000 or more
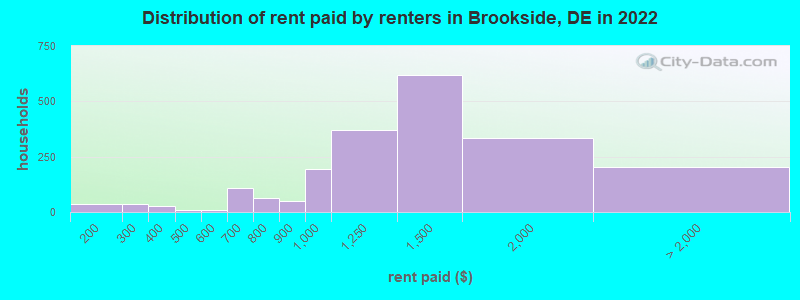
Rent paid by renters in 2022 in Brookside, DE
-
- 15$100 to $149
- 21$150 to $199
- 14$200 to $249
- 21$250 to $299
- 5$300 to $349
- 23$350 to $399
- 11$400 to $449
- 10$550 to $599
- 77$600 to $649
- 33$650 to $699
- 5$700 to $749
- 59$750 to $799
- 47$800 to $899
- 193$900 to $999
- 370$1,000 to $1,249
- 620$1,250 to $1,499
- 334$1,500 to $1,999
- 40$2,000 to $2,499
- 39$2,500 to $2,999
- 124No cash rent
Percentage of workers working in this county: 87.9%
Number of people working at home: 1,202 (15.6% of all workers)
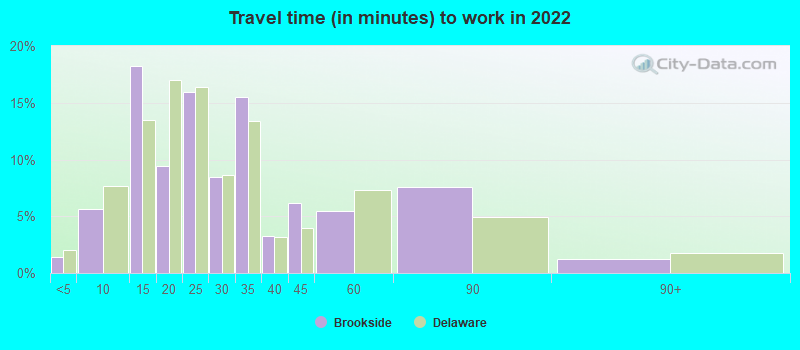
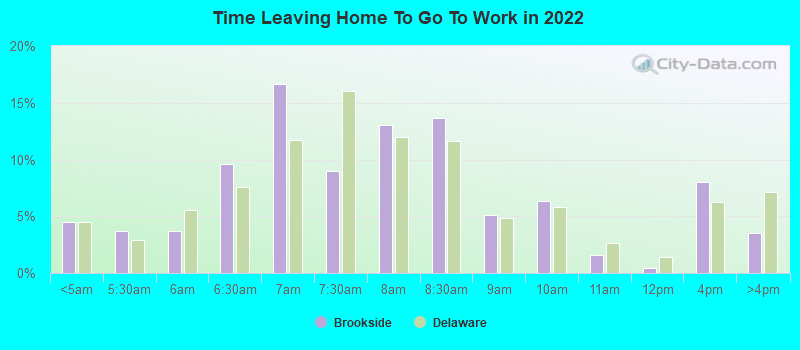
Travel time to work (commute)
- Less than 5 minutes: 28
- 5 to 9 minutes: 704
- 10 to 14 minutes: 834
- 15 to 19 minutes: 1,509
- 20 to 24 minutes: 1,173
- 25 to 29 minutes: 622
- 30 to 34 minutes: 666
- 35 to 39 minutes: 156
- 40 to 44 minutes: 91
- 45 to 59 minutes: 278
- 60 to 89 minutes: 165
- 90 or more minutes: 177
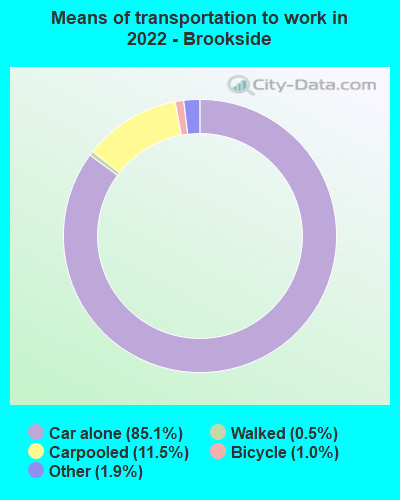
Means of transportation to work:
- Drove a car alone: 3,821 (68.1%)
- Carpooled: 485 (8.6%)
- Taxi: 82 (1.5%)
- Bicycle: 85 (1.5%)
- Walked: 25 (0.4%)
- Worked at home: 1,202 (21.4%)
- Unemployment by race in 2022
- Unemployment rate for White non-Hispanic residents
- 3.5%Males
- 5.0%Females
- Unemployment rate for Black residents
- 13.7%Males
- 0.7%Females
- Unemployment rate for other race residents
- 53.4%Females
- Unemployment rate for two or more race residents
- 1.5%Females
- Unemployment rate for Hispanic or Latino residents
- 15.5%Females
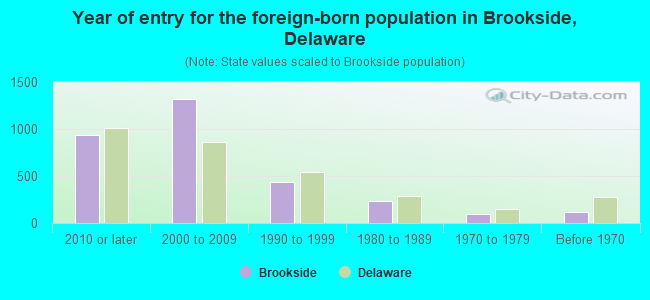
- Year of entry for the foreign-born population in Brookside, Delaware
- 9352010 or later
- 1,3142000 to 2009
- 4331990 to 1999
- 2331980 to 1989
- 961970 to 1979
- 115Before 1970
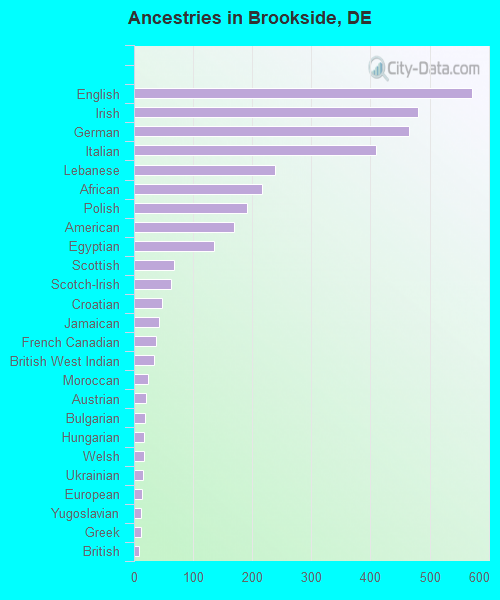
First ancestries reported:
- English: 572 (8.0%)
- Irish: 481 (6.7%)
- German: 466 (6.5%)
- Italian: 410 (5.7%)
- Lebanese: 239 (3.3%)
- African: 217 (3.0%)
- Polish: 192 (2.7%)
- American: 169 (2.4%)
- Egyptian: 135 (1.9%)
- Scottish: 68 (0.9%)
- Scotch-Irish: 63 (0.9%)
- Croatian: 47 (0.7%)
- Jamaican: 43 (0.6%)
- French Canadian: 38 (0.5%)
- British West Indian: 33 (0.5%)
- Moroccan: 23 (0.3%)
- Austrian: 21 (0.3%)
- Bulgarian: 18 (0.3%)
- Hungarian: 17 (0.2%)
- Welsh: 17 (0.2%)
- Ukrainian: 15 (0.2%)
- European: 14 (0.2%)
- Yugoslavian: 12 (0.2%)
- Greek: 11 (0.2%)
- British: 9 (0.1%)
- Swedish: 8 (0.1%)
- Eastern European: 7 (0.10%)
- French: 7 (0.10%)
- Slavic: 7 (0.10%)
Most common places of birth for foreign-born residents (%):
| Brookside: | 27.4% (806) |
| Delaware: | 15.3% (14,887) |
| Brookside: | 14.4% (424) |
| Delaware: | 5.7% (5,583) |
| Brookside: | 10.5% (309) |
| Delaware: | 1.3% (1,286) |
| Brookside: | 8.8% (257) |
| Delaware: | 11.6% (11,288) |
| Brookside: | 5.1% (150) |
| Delaware: | 0.3% (255) |
| Brookside: | 4.0% (117) |
| Delaware: | 0.7% (638) |
| Brookside: | 3.3% (98) |
| Delaware: | 3.2% (3,065) |
| Brookside: | 3.3% (96) |
| Delaware: | 0.4% (420) |
| Brookside: | 2.9% (86) |
| Delaware: | 1.7% (1,635) |
| Brookside: | 2.5% (72) |
| Delaware: | 3.8% (3,727) |
| Brookside: | 2.1% (63) |
| Delaware: | 1.0% (950) |
| Brookside: | 2.0% (60) |
| Delaware: | 3.1% (2,996) |
| Brookside: | 1.6% (48) |
| Delaware: | 0.3% (322) |
Place of birth for U.S.-born residents:
- This state: 6,248
- Other state: 4,882
- Northeast: 2,725
- Midwest: 266
- South: 1,390
- West: 453
91.1% of Brookside residents lived in the same house 1 years ago.
Out of people who lived in different houses, 35.3% lived in this county.
Out of people who lived in different counties, 15.6% lived in Delaware.
| Brookside: | 91.1% |
| State average: | 89.2% |
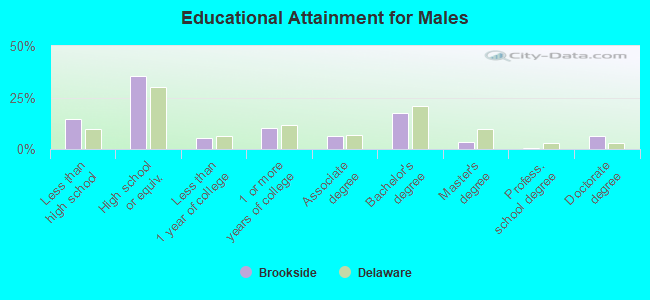
Education attainment for males 25 years and older:
- No schooling: 127
- Nursery to 4th grade: 42
- 5th and 6th grade: 32
- 7th and 8th grade: 82
- 9th grade: 58
- 10th grade: 166
- 11th grade: 84
- 12th grade, no diploma: 67
- High school graduate (or equivalency): 1,576
- Less than 1 year of college: 227
- Some college more than 1 year, no degree: 460
- Associate degree: 285
- Bachelor's degree: 783
- Master's degree: 160
- Professional school degree: 31
- Doctorate degree: 270
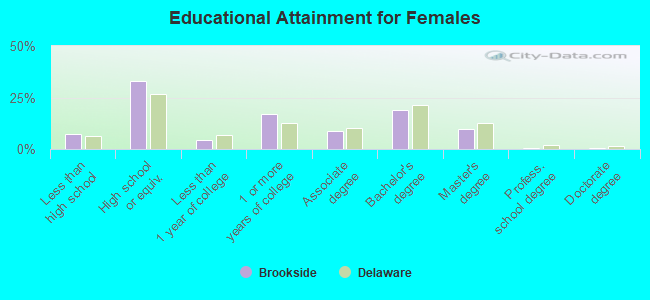
Education attainment for females 25 years and older:
- No schooling: 154
- Nursery to 4th grade: 23
- 5th and 6th grade: 25
- 7th and 8th grade: 13
- 9th grade: 17
- 10th grade: 64
- 11th grade: 57
- 12th grade, no diploma: 50
- High school graduate (or equivalency): 1,811
- Less than 1 year of college: 232
- Some college more than 1 year, no degree: 938
- Associate degree: 487
- Bachelor's degree: 1,042
- Master's degree: 532
- Professional school degree: 36
- Doctorate degree: 31
Housing units in structures:
- One, detached: 3,784
- One, attached: 586
- Two: 34
- 3 or 4: 431
- 5 to 9: 181
- 10 to 19: 822
- 20 to 49: 31
- 50 or more: 6
- Mobile homes: 11
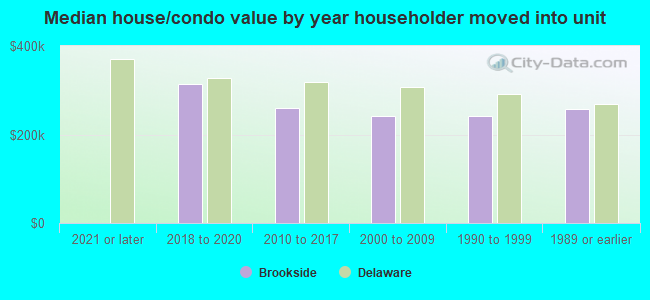
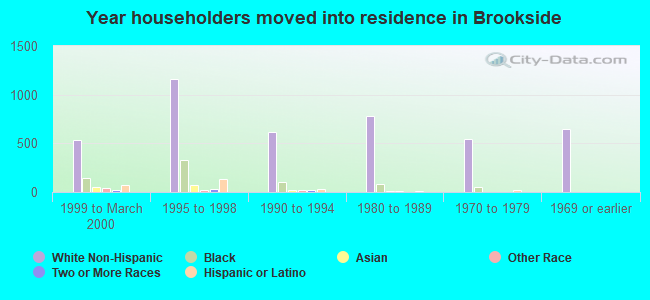
House/condo owner moved in on average 17 years ago
Renter moved in on average 3 years ago
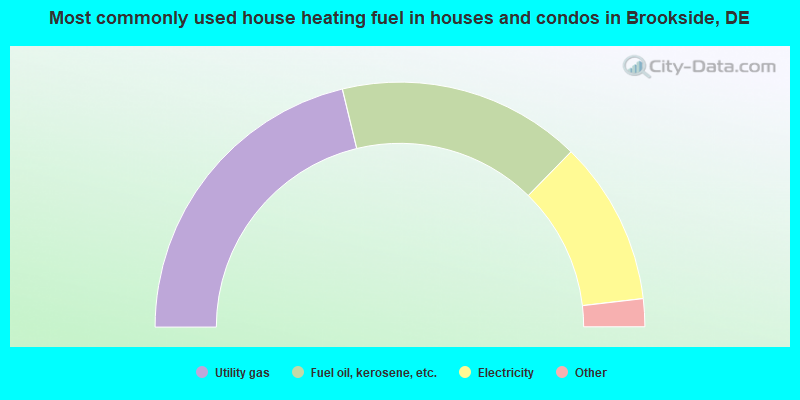
- 42.5%Utility gas
- 32.2%Fuel oil, kerosene, etc.
- 21.7%Electricity
- 2.2%Bottled, tank, or LP gas
- 1.4%Wood
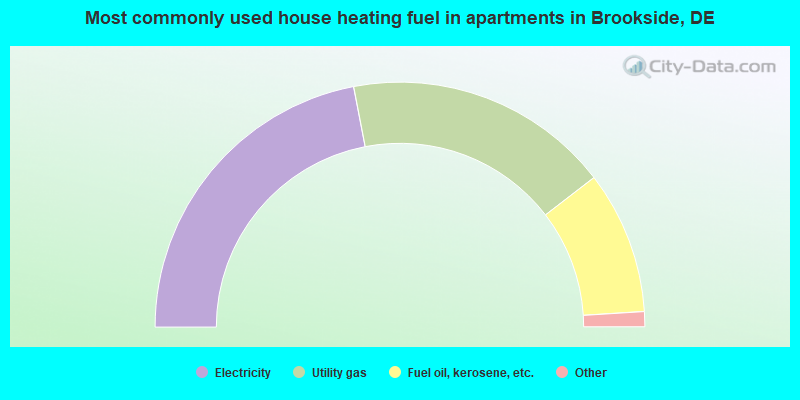
- 44.0%Electricity
- 35.2%Utility gas
- 18.9%Fuel oil, kerosene, etc.
- 0.9%Other fuel
- 0.6%No fuel used
- 0.4%Bottled, tank, or LP gas
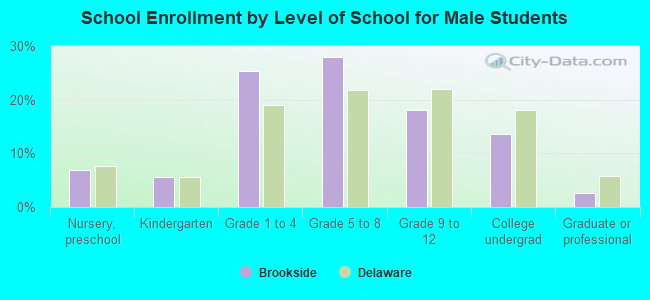
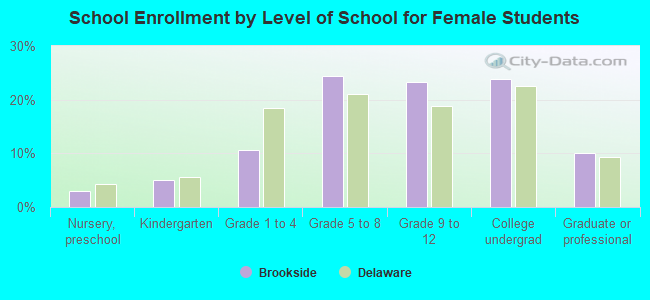
Private vs. public school enrollment:
| Here: | 6.7% |
| Delaware: | 11.5% |
| Here: | 3.1% |
| Delaware: | 12.1% |
| Here: | 11.4% |
| Delaware: | 19.2% |