Races in Brookside, Delaware (DE) Detailed Stats
Data:
Races - White alone (%)
Races - White alone (% change since 2000)
Races - Black alone (%)
Races - Black alone (% change since 2000)
Races - American Indian alone (%)
Races - American Indian alone (% change since 2000)
Races - Asian alone (%)
Races - Asian alone (% change since 2000)
Races - Hispanic (%)
Races - Hispanic (% change since 2000)
Races - Native Hawaiian and Other Pacific Islander alone (%)
Races - Native Hawaiian and Other Pacific Islander alone (% change since 2000)
Races - Two or more races(%)
Races - Two or more races(% change since 2000)
Races - Other race alone (%)
Races - Other race alone (% change since 2000)
Racial diversity
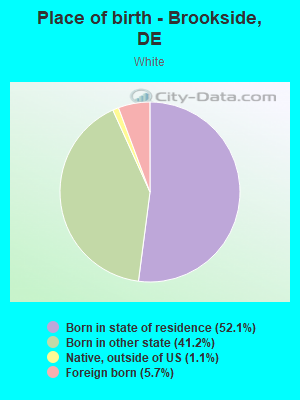
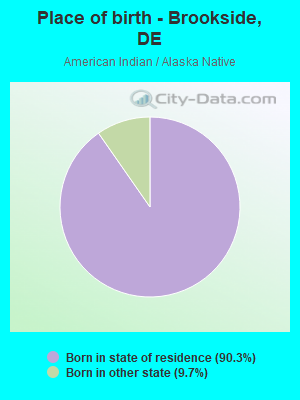
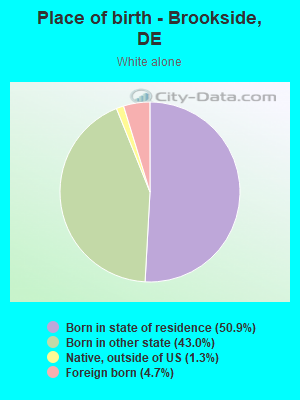
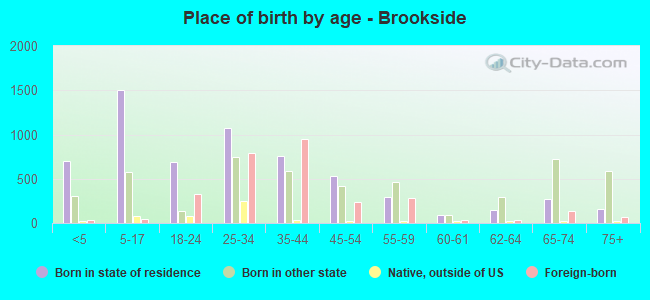
Place of birth - Born in state of residence (%)
Place of birth - Born in state of residence (%) - White
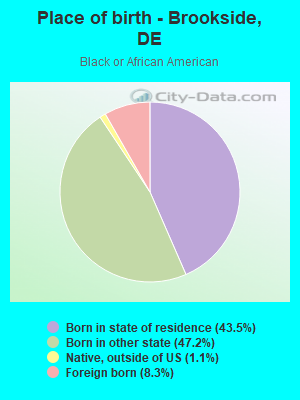
Place of birth - Born in state of residence (%) - Black or African American
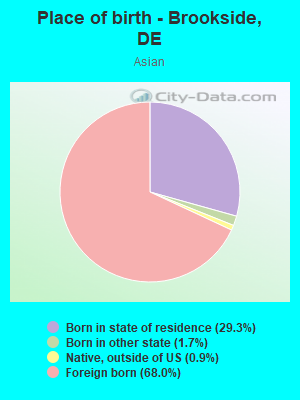
Place of birth - Born in state of residence (%) - Asian
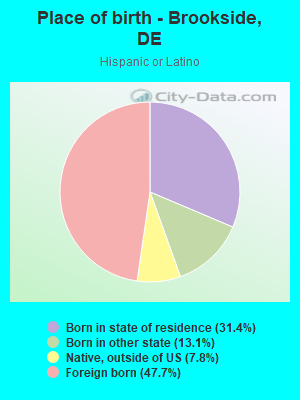
Place of birth - Born in state of residence (%) - Hispanic or Latino
Place of birth - Born in state of residence (%) - American Indian and Alaska Native
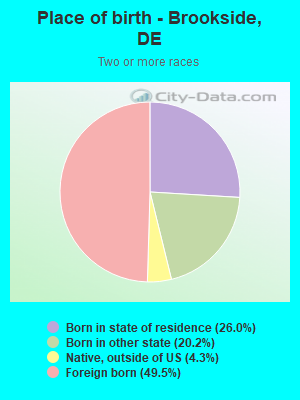
Place of birth - Born in state of residence (%) - Multirace
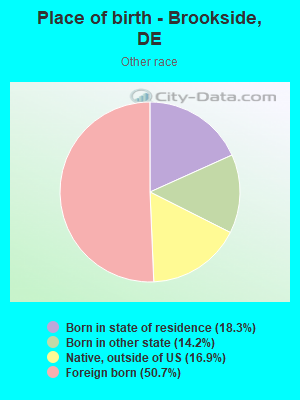
Place of birth - Born in state of residence (%) - Other Race
Place of birth - Born in other state (%)
Place of birth - Born in other state (%) - White
Place of birth - Born in other state (%) - Black or African American
Place of birth - Born in other state (%) - Asian
Place of birth - Born in other state (%) - Hispanic or Latino
Place of birth - Born in other state (%) - American Indian and Alaska Native
Place of birth - Born in other state (%) - Multirace
Place of birth - Born in other state (%) - Other Race
Place of birth - Native, outside of US (%)
Place of birth - Native, outside of US (%) - White
Place of birth - Native, outside of US (%) - Black or African American
Place of birth - Native, outside of US (%) - Asian
Place of birth - Native, outside of US (%) - Hispanic or Latino
Place of birth - Native, outside of US (%) - American Indian and Alaska Native
Place of birth - Native, outside of US (%) - Multirace
Place of birth - Native, outside of US (%) - Other Race
Place of birth - Foreign born (%)
Place of birth - Foreign born (%) - White
Place of birth - Foreign born (%) - Black or African American
Place of birth - Foreign born (%) - Asian
Place of birth - Foreign born (%) - Hispanic or Latino
Place of birth - Foreign born (%) - American Indian and Alaska Native
Place of birth - Foreign born (%) - Multirace
Place of birth - Foreign born (%) - Other Race
Residents speaking English at home (%)
Residents speaking English at home - Born in the United States (%)
Residents speaking English at home - Native, born elsewhere (%)
Residents speaking English at home - Foreign born (%)
Residents speaking Spanish at home (%)
Residents speaking Spanish at home - Born in the United States (%)
Residents speaking Spanish at home - Native, born elsewhere (%)
Residents speaking Spanish at home - Foreign born (%)
Residents speaking other language at home (%)
Residents speaking other language at home - Born in the United States (%)
Residents speaking other language at home - Native, born elsewhere (%)
Residents speaking other language at home - Foreign born (%)
Marital status - Never married (%)
Marital status - Now married (%)
Marital status - Separated (%)
Marital status - Widowed (%)
Marital status - Divorced (%)
Ancestries Reported - Arab (%)
Ancestries Reported - Czech (%)
Ancestries Reported - Danish (%)
Ancestries Reported - Dutch (%)
Ancestries Reported - English (%)
Ancestries Reported - French (%)
Ancestries Reported - French Canadian (%)
Ancestries Reported - German (%)
Ancestries Reported - Greek (%)
Ancestries Reported - Hungarian (%)
Ancestries Reported - Irish (%)
Ancestries Reported - Italian (%)
Ancestries Reported - Lithuanian (%)
Ancestries Reported - Norwegian (%)
Ancestries Reported - Polish (%)
Ancestries Reported - Portuguese (%)
Ancestries Reported - Russian (%)
Ancestries Reported - Scotch-Irish (%)
Ancestries Reported - Scottish (%)
Ancestries Reported - Slovak (%)
Ancestries Reported - Subsaharan African (%)
Ancestries Reported - Swedish (%)
Ancestries Reported - Swiss (%)
Ancestries Reported - Ukrainian (%)
Ancestries Reported - United States (%)
Ancestries Reported - Welsh (%)
Ancestries Reported - West Indian (%)
Ancestries Reported - Other (%)
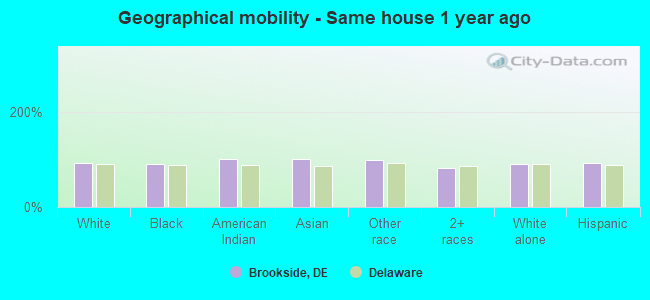
Geographical mobility - Same house 1 year ago (%)
Geographical mobility - Same house 1 year ago (%) - White
Geographical mobility - Same house 1 year ago (%) - Black or African American
Geographical mobility - Same house 1 year ago (%) - Asian
Geographical mobility - Same house 1 year ago (%) - Hispanic or Latino
Geographical mobility - Same house 1 year ago (%) - American Indian and Alaska Native
Geographical mobility - Same house 1 year ago (%) - Multirace
Geographical mobility - Same house 1 year ago (%) - Other Race
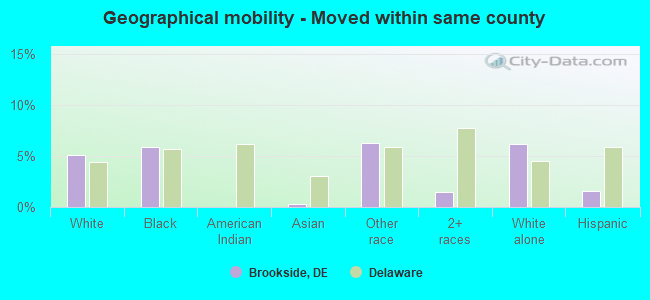
Geographical mobility - Moved within same county (%)
Geographical mobility - Moved within same county (%) - White
Geographical mobility - Moved within same county (%) - Black or African American
Geographical mobility - Moved within same county (%) - Asian
Geographical mobility - Moved within same county (%) - Hispanic or Latino
Geographical mobility - Moved within same county (%) - American Indian and Alaska Native
Geographical mobility - Moved within same county (%) - Multirace
Geographical mobility - Moved within same county (%) - Other Race
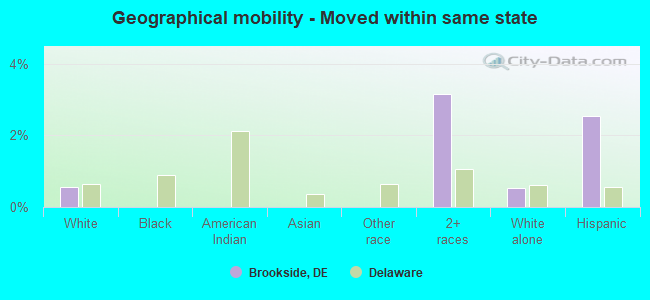
Geographical mobility - Moved from different county within same state (%)
Geographical mobility - Moved from different county within same state (%) - White
Geographical mobility - Moved from different county within same state (%) - Black or African American
Geographical mobility - Moved from different county within same state (%) - Asian
Geographical mobility - Moved from different county within same state (%) - Hispanic or Latino
Geographical mobility - Moved from different county within same state (%) - American Indian and Alaska Native
Geographical mobility - Moved from different county within same state (%) - Multirace
Geographical mobility - Moved from different county within same state (%) - Other Race
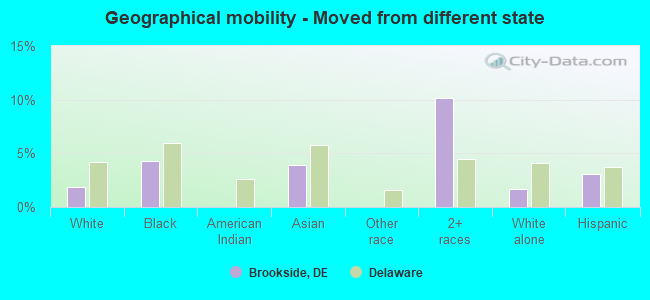
Geographical mobility - Moved from different state (%)
Geographical mobility - Moved from different state (%) - White
Geographical mobility - Moved from different state (%) - Black or African American
Geographical mobility - Moved from different state (%) - Asian
Geographical mobility - Moved from different state (%) - Hispanic or Latino
Geographical mobility - Moved from different state (%) - American Indian and Alaska Native
Geographical mobility - Moved from different state (%) - Multirace
Geographical mobility - Moved from different state (%) - Other Race
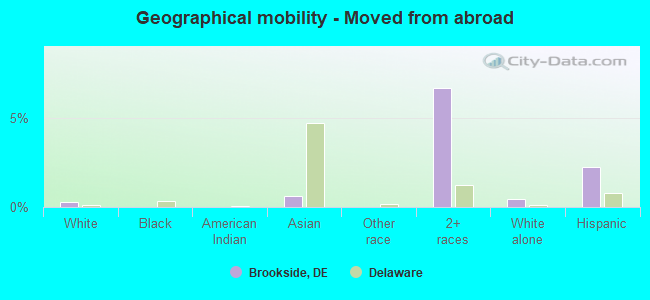
Geographical mobility - Moved from abroad (%)
Geographical mobility - Moved from abroad (%) - White
Geographical mobility - Moved from abroad (%) - Black or African American
Geographical mobility - Moved from abroad (%) - Asian
Geographical mobility - Moved from abroad (%) - Hispanic or Latino
Geographical mobility - Moved from abroad (%) - American Indian and Alaska Native
Geographical mobility - Moved from abroad (%) - Multirace
Geographical mobility - Moved from abroad (%) - Other Race
Place of birth for the foreign-born population - Ireland (%)
Place of birth for the foreign-born population - Denmark (%)
Place of birth for the foreign-born population - Norway (%)
Place of birth for the foreign-born population - Sweden (%)
Place of birth for the foreign-born population - United Kingdom (%)
Place of birth for the foreign-born population - England (%)
Place of birth for the foreign-born population - Scotland (%)
Place of birth for the foreign-born population - Other Northern Europe (%)
Place of birth for the foreign-born population - Austria (%)
Place of birth for the foreign-born population - Belgium (%)
Place of birth for the foreign-born population - France (%)
Place of birth for the foreign-born population - Germany (%)
Place of birth for the foreign-born population - Netherlands (%)
Place of birth for the foreign-born population - Switzerland (%)
Place of birth for the foreign-born population - Other Western Europe (%)
Place of birth for the foreign-born population - Greece (%)
Place of birth for the foreign-born population - Italy (%)
Place of birth for the foreign-born population - Portugal (%)
Place of birth for the foreign-born population - Spain (%)
Place of birth for the foreign-born population - Other Southern Europe (%)
Place of birth for the foreign-born population - Albania (%)
Place of birth for the foreign-born population - Belarus (%)
Place of birth for the foreign-born population - Bosnia and Herzegovina (%)
Place of birth for the foreign-born population - Bulgaria (%)
Place of birth for the foreign-born population - Croatia (%)
Place of birth for the foreign-born population - Czechoslovakia (%)
Place of birth for the foreign-born population - Hungary (%)
Place of birth for the foreign-born population - Latvia (%)
Place of birth for the foreign-born population - Lithuania (%)
Place of birth for the foreign-born population - North Macedonia (Macedonia) (%)
Place of birth for the foreign-born population - Moldova (%)
Place of birth for the foreign-born population - Poland (%)
Place of birth for the foreign-born population - Romania (%)
Place of birth for the foreign-born population - Russia (%)
Place of birth for the foreign-born population - Serbia (%)
Place of birth for the foreign-born population - Ukraine (%)
Place of birth for the foreign-born population - Other Eastern Europe (%)
Place of birth for the foreign-born population - China (%)
Place of birth for the foreign-born population - Hong Kong (%)
Place of birth for the foreign-born population - Taiwan (%)
Place of birth for the foreign-born population - Japan (%)
Place of birth for the foreign-born population - Korea (%)
Place of birth for the foreign-born population - Other Eastern Asia (%)
Place of birth for the foreign-born population - Afghanistan (%)
Place of birth for the foreign-born population - Bangladesh (%)
Place of birth for the foreign-born population - India (%)
Place of birth for the foreign-born population - Iran (%)
Place of birth for the foreign-born population - Kazakhstan (%)
Place of birth for the foreign-born population - Nepal (%)
Place of birth for the foreign-born population - Pakistan (%)
Place of birth for the foreign-born population - Sri Lanka (%)
Place of birth for the foreign-born population - Uzbekistan (%)
Place of birth for the foreign-born population - Other South Central Asia (%)
Place of birth for the foreign-born population - Burma (%)
Place of birth for the foreign-born population - Cambodia (%)
Place of birth for the foreign-born population - Indonesia (%)
Place of birth for the foreign-born population - Laos (%)
Place of birth for the foreign-born population - Malaysia (%)
Place of birth for the foreign-born population - Philippines (%)
Place of birth for the foreign-born population - Singapore (%)
Place of birth for the foreign-born population - Thailand (%)
Place of birth for the foreign-born population - Vietnam (%)
Place of birth for the foreign-born population - Other South Eastern Asia (%)
Place of birth for the foreign-born population - Armenia (%)
Place of birth for the foreign-born population - Iraq (%)
Place of birth for the foreign-born population - Israel (%)
Place of birth for the foreign-born population - Jordan (%)
Place of birth for the foreign-born population - Kuwait (%)
Place of birth for the foreign-born population - Lebanon (%)
Place of birth for the foreign-born population - Saudi Arabia (%)
Place of birth for the foreign-born population - Syria (%)
Place of birth for the foreign-born population - Turkey (%)
Place of birth for the foreign-born population - Yemen (%)
Place of birth for the foreign-born population - Other Western Asia (%)
Place of birth for the foreign-born population - Eritrea (%)
Place of birth for the foreign-born population - Ethiopia (%)
Place of birth for the foreign-born population - Kenya (%)
Place of birth for the foreign-born population - Somalia (%)
Place of birth for the foreign-born population - Uganda (%)
Place of birth for the foreign-born population - Zimbabwe (%)
Place of birth for the foreign-born population - Other Eastern Africa (%)
Place of birth for the foreign-born population - Cameroon (%)
Place of birth for the foreign-born population - Congo (%)
Place of birth for the foreign-born population - Democratic Republic of Congo (Zaire) (%)
Place of birth for the foreign-born population - Other Middle Africa (%)
Place of birth for the foreign-born population - Egypt (%)
Place of birth for the foreign-born population - Morocco (%)
Place of birth for the foreign-born population - Sudan (%)
Place of birth for the foreign-born population - Other Northern Africa (%)
Place of birth for the foreign-born population - South Africa (%)
Place of birth for the foreign-born population - Other Southern Africa (%)
Place of birth for the foreign-born population - Cabo Verde (%)
Place of birth for the foreign-born population - Ghana (%)
Place of birth for the foreign-born population - Liberia (%)
Place of birth for the foreign-born population - Nigeria (%)
Place of birth for the foreign-born population - Senegal (%)
Place of birth for the foreign-born population - Sierra Leone (%)
Place of birth for the foreign-born population - Other Western Africa (%)
Place of birth for the foreign-born population - Australia (%)
Place of birth for the foreign-born population - New Zealand (%)
Place of birth for the foreign-born population - Fiji (%)
Place of birth for the foreign-born population - Micronesia (%)
Place of birth for the foreign-born population - Bahamas (%)
Place of birth for the foreign-born population - Barbados (%)
Place of birth for the foreign-born population - Cuba (%)
Place of birth for the foreign-born population - Dominica (%)
Place of birth for the foreign-born population - Dominican Republic (%)
Place of birth for the foreign-born population - Grenada (%)
Place of birth for the foreign-born population - Haiti (%)
Place of birth for the foreign-born population - Jamaica (%)
Place of birth for the foreign-born population - St. Vincent and the Grenadines (%)
Place of birth for the foreign-born population - Trinidad and Tobago (%)
Place of birth for the foreign-born population - West Indies (%)
Place of birth for the foreign-born population - Other Caribbean (%)
Place of birth for the foreign-born population - Belize (%)
Place of birth for the foreign-born population - Costa Rica (%)
Place of birth for the foreign-born population - El Salvador (%)
Place of birth for the foreign-born population - Guatemala (%)
Place of birth for the foreign-born population - Honduras (%)
Place of birth for the foreign-born population - Mexico (%)
Place of birth for the foreign-born population - Nicaragua (%)
Place of birth for the foreign-born population - Panama (%)
Place of birth for the foreign-born population - Other Central America (%)
Place of birth for the foreign-born population - Argentina (%)
Place of birth for the foreign-born population - Bolivia (%)
Place of birth for the foreign-born population - Brazil (%)
Place of birth for the foreign-born population - Chile (%)
Place of birth for the foreign-born population - Colombia (%)
Place of birth for the foreign-born population - Ecuador (%)
Place of birth for the foreign-born population - Guyana (%)
Place of birth for the foreign-born population - Peru (%)
Place of birth for the foreign-born population - Uruguay (%)
Place of birth for the foreign-born population - Venezuela (%)
Place of birth for the foreign-born population - Other South America (%)
Place of birth for the foreign-born population - Canada (%)
Place of birth for the foreign-born population - Other Northern America (%)
Place of birth for the foreign-born population - Other (%)
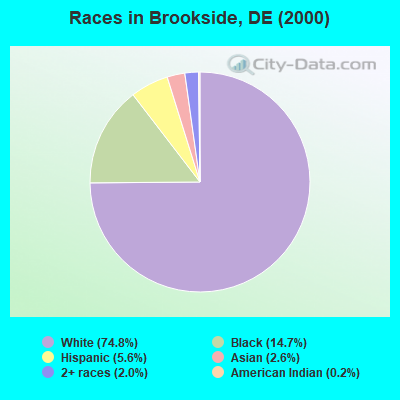
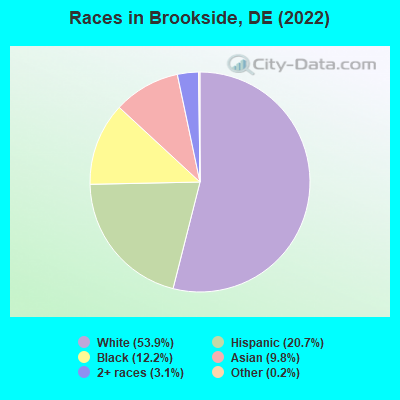
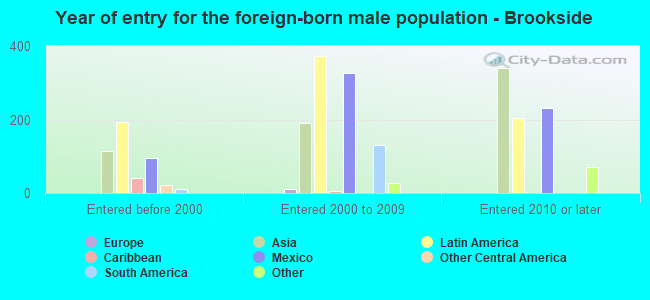
According to 2022 data, the most numerous races in Brookside, DE are White alone (7,796 residents), Black alone (1,767 residents), and Hispanic (2,990 residents). 70.4% of Brookside residents speak English at home. 20.3% of Brookside, DE residents are foreign-born (10.6% born in Latin America, 8.1% born in Asia), which is 55.7% greater than the foreign-born rate of 9.0% across the entire state of Delaware.
Race distribution in Brookside
2000 2022
567,973 72.5% White alone 148,435 18.9% Black alone 37,277 4.8% Hispanic 16,110 2.1% Asian alone 10,222 1.3% Two or more races 2,324 0.3% American Indian alone 1,025 0.1% Other race alone 234 0.03% Native Hawaiian and Other
599,347 58.9% White alone 220,010 21.6% Black alone 105,300 10.3% Hispanic 46,016 4.5% Two or more races 41,350 4.1% Asian alone 5,097 0.5% Other race alone 1,276 0.1% American Indian alone
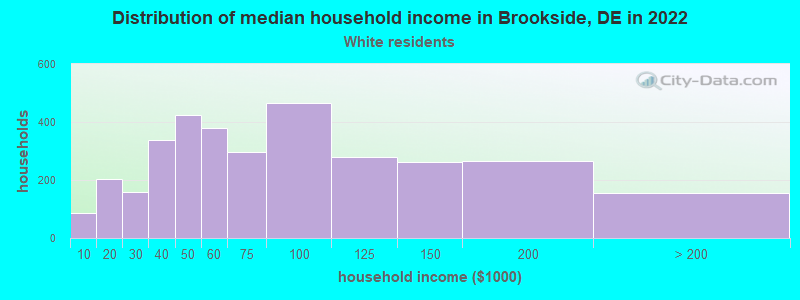
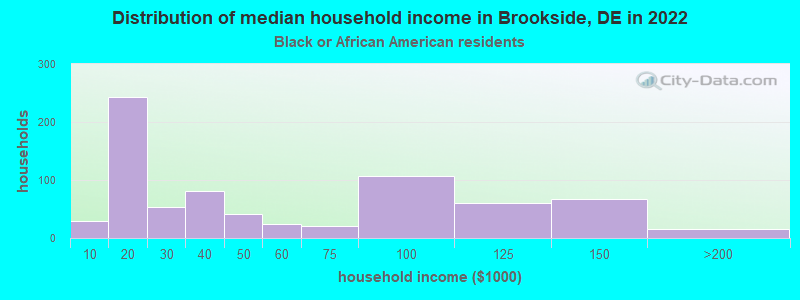
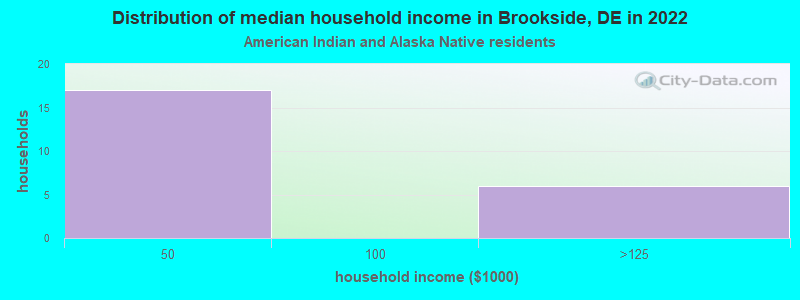
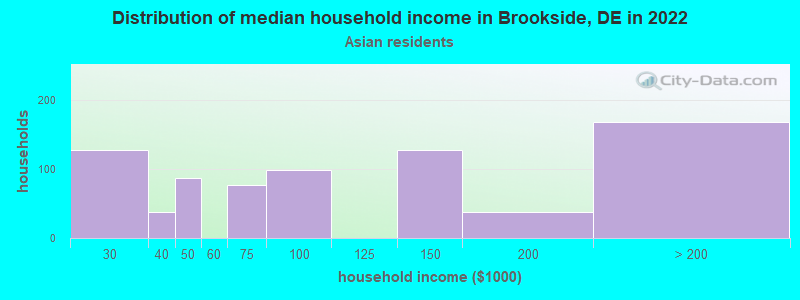
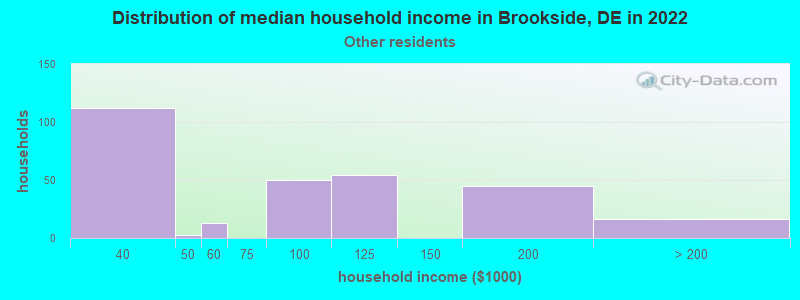
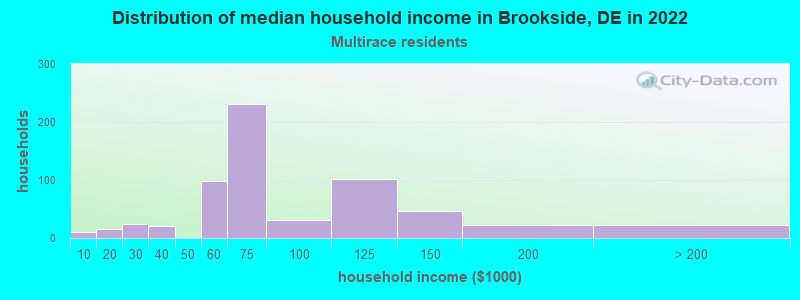
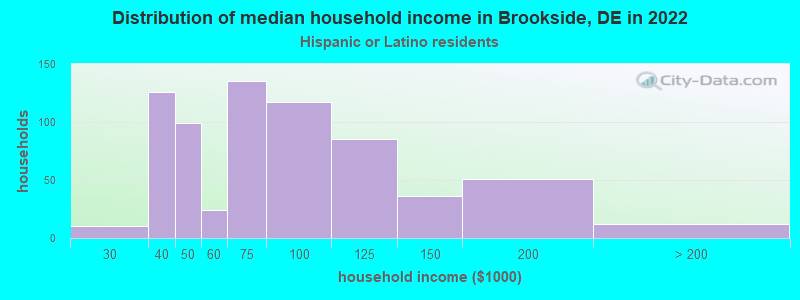
Income and house value in Brookside Median household income in 2022 $60,715 White non-Hispanic householders$40,534 Black householders$113,546 Asian householders$110,812 Some other race householders$66,048 Two or more races householders$70,459 Hispanic or Latino race householdersMedian 2022 house value $257,402 White Non-Hispanic householders$253,342 Black or African American householders $264,804 Asian householders$328,318 Native Hawaiian and other Pacific Islander householders$246,657 Some other race householders$202,960 Two or more races householders$256,446 Hispanic or Latino householders
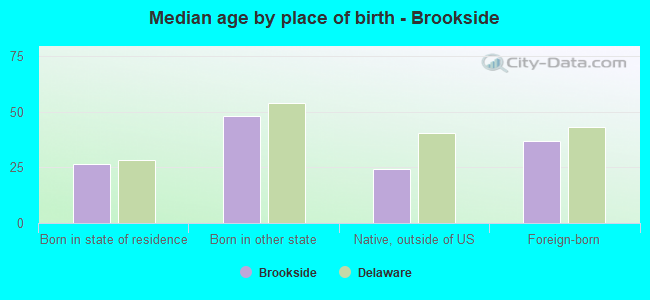
Median age by race in Brookside
38.2 Median age for White residents37.9 38.6 37.2 Median age for Black or African American residents22.5 40.3 21.6 Median age for American Indian / Alaska Native residents-639,393,938.8 -659,673,659.0 35.6 Median age for Asian residents35.7 34.3 -666,666,666.0 Median age for Native Hawaiian / Pacific Islander residents-668,724,279.2 -670,599,802.7 32.5 Median age for Other race residents35.4 25.2 38.0 Median age for Two or more races residents25.7 42.7 41.4 Median age for White alone residents39.5 42.5 27.1 Median age for Hispanic or Latino residents27.1 27.5
Owner/renter occupied households by race in Brookside
House owners and renters - White residents 2,301 70.2% Owner occupied975 29.8% Renter occupiedHouse owners and renters - Black or African American residents 357 50.7% Owner occupied347 49.3% Renter occupiedHouse owners and renters - American Indian / Alaska Native residents 42 100.0% Owner occupiedHouse owners and renters - Asian residents 375 51.3% Owner occupied356 48.7% Renter occupiedHouse owners and renters - Other race residents 209 86.5% Owner occupied33 13.5% Renter occupiedHouse owners and renters - Two or more races residents 265 40.6% Owner occupied388 59.4% Renter occupiedHouse owners and renters - White alone residents 2,262 71.8% Owner occupied889 28.2% Renter occupiedHouse owners and renters - Hispanic or Latino residents 384 53.0% Owner occupied340 47.0% Renter occupied
Language usage in Brookside
English speakers - Total 70.4% of residents of Brookside speak English at home.
16.1% of residents speak Spanish at home 1,353 62.8% Speak English very well802 37.2% Speak English less than very well13.2% of residents speak other language at home 1,265 71.7% Speak English very well500 28.3% Speak English less than very well
English speakers - Born in the United States 93.4% of residents of Brookside speak English at home.
4.3% of residents speak Spanish at home 169 86.7% Speak English very well26 13.3% Speak English less than very well2.1% of residents speak other language at home 98 100.0% Speak English very well
English speakers - Native, born elsewhere 29.5% of residents of Brookside speak English at home.
44.1% of residents speak Spanish at home 156 92.3% Speak English very well13 7.7% Speak English less than very well20.6% of residents speak other language at home 79 100.0% Speak English very well
English speakers - Foreign-born 7.7% of residents of Brookside speak English at home.
43.9% of residents speak Spanish at home 515 39.8% Speak English very well778 60.2% Speak English less than very well44.5% of residents speak other language at home 848 64.7% Speak English very well463 35.3% Speak English less than very well
White (Caucasian) - Speak only English Native:
95.8% (7,116)Foreign-born:
6.6% (31)
White (Caucasian) - Speak another language Native:
3.1% (229)Foreign-born:
81.2% (382)
Black or African American - Speak only English Native:
97.6% (1,461)Foreign-born:
37.3% (56)
Black or African American - Speak another language Native:
2.4% (36)Foreign-born:
65.3% (98)
Asian - Speak only English Native:
7.9% (25)Foreign-born:
12.6% (124)
Asian - Speak another language Native:
100.0% (319)Foreign-born:
86.0% (841)
Other race - Speak only English Native:
20.0% (55)Foreign-born:
4.3% (17)
Other race - Speak another language Native:
76.3% (212)Foreign-born:
89.3% (347)
Two or more races - Speak only English Native:
50.3% (463)Foreign-born:
1.6% (18)
Two or more races - Speak another language Native:
59.9% (551)Foreign-born:
97.2% (1,157)
White alone - Speak only English Native:
97.8% (6,897)Foreign-born:
6.2% (23)
White alone - Speak another language Native:
2.0% (139)Foreign-born:
92.2% (336)
Hispanic or Latino - Speak only English Native:
32.2% (409)Foreign-born:
1.4% (19)
Hispanic or Latino - Speak another language Native:
66.9% (850)Foreign-born:
93.3% (1,306)
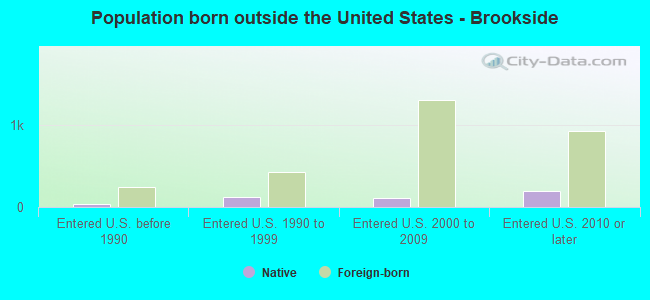
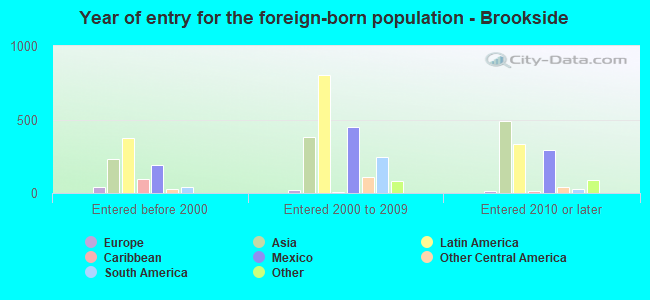
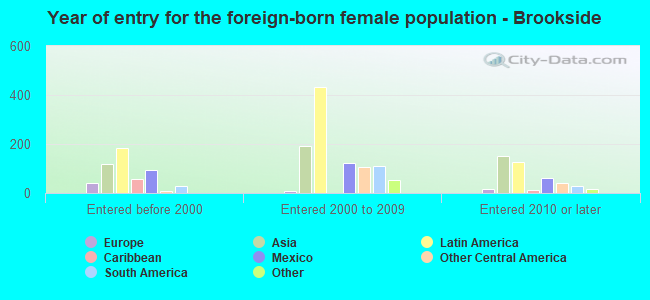
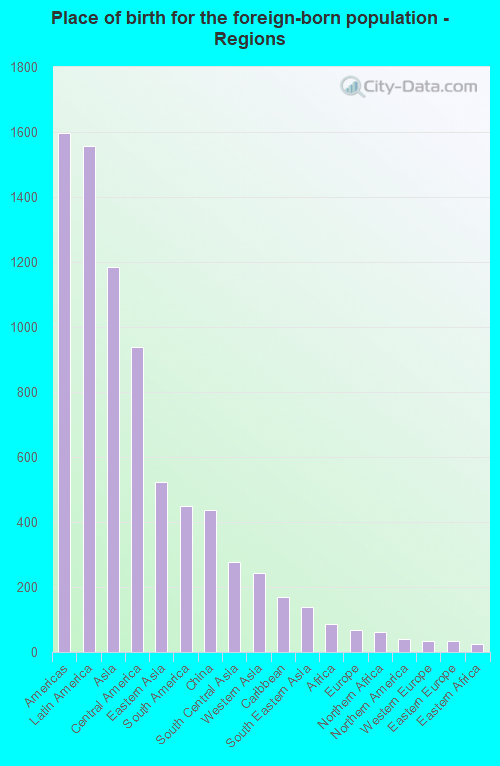
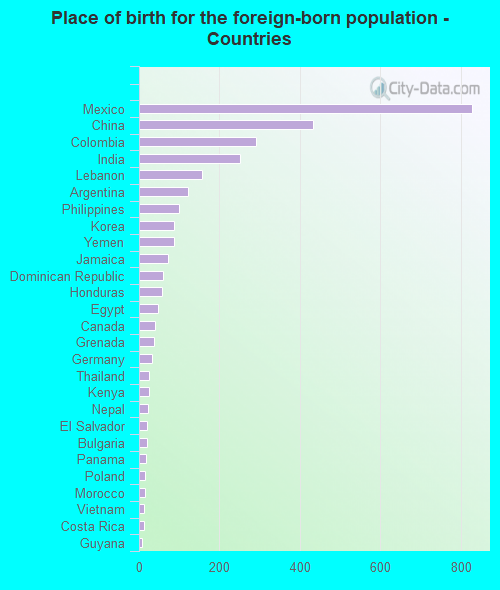
Foreign-born residents in Brookside 2,937 residents are foreign born (10.6% Latin America , 8.1% Asia ).
This city:
20.3%Delaware:
9.8%
Marital status for residents in Brookside Marital status - White (Caucasian) population 15 years and over
Males 37.6% Never married51.4% Now married0.1% Separated2.2% Widowed8.7% DivorcedFemales 38.7% Never married39.2% Now married1.6% Separated5.6% Widowed14.8% DivorcedWomen who gave birth in the past 12 months Now married:
40.0% (7)Unmarried:
60.0% (11)
Women who did not give birth in the past 12 months Now married:
33.0% (667)Unmarried:
67.0% (1,355)
Marital status - Black or African American population 15 years and over
Males 58.4% Never married28.3% Now married1.7% Separated0.6% Widowed10.9% DivorcedFemales 54.7% Never married11.9% Now married0.0% Separated8.9% Widowed24.6% DivorcedWomen who gave birth in the past 12 months Now married:
0.0% (0)Unmarried:
100.0% (27)
Women who did not give birth in the past 12 months Now married:
10.5% (58)Unmarried:
89.5% (494)
Marital status - American Indian / Alaska Native population 15 years and over
Males 37.5% Never married62.5% Now married0.0% Separated0.0% Widowed0.0% DivorcedFemales 100.0% Never married0.0% Now married0.0% Separated0.0% Widowed0.0% DivorcedWomen who did not give birth in the past 12 months Now married:
0.0% (0)Unmarried:
100.0% (25)
Marital status - Asian population 15 years and over
Males 38.2% Never married53.1% Now married0.0% Separated0.0% Widowed8.7% DivorcedFemales 28.9% Never married37.7% Now married0.0% Separated9.0% Widowed24.3% DivorcedWomen who gave birth in the past 12 months Now married:
100.0% (25)Unmarried:
0.0% (0)
Women who did not give birth in the past 12 months Now married:
35.3% (172)Unmarried:
64.7% (315)
Marital status - Other race population 15 years and over
Males 70.7% Never married29.3% Now married0.0% Separated0.0% Widowed0.0% DivorcedFemales 16.0% Never married79.1% Now married0.0% Separated0.0% Widowed4.9% DivorcedWomen who gave birth in the past 12 months Now married:
100.0% (51)Unmarried:
0.0% (0)
Women who did not give birth in the past 12 months Now married:
67.1% (69)Unmarried:
32.9% (34)
Marital status - Two or more races population 15 years and over
Males 29.7% Never married56.3% Now married13.9% Separated0.0% Widowed0.0% DivorcedFemales 21.0% Never married74.7% Now married2.1% Separated0.0% Widowed2.1% DivorcedWomen who gave birth in the past 12 months Now married:
100.0% (43)Unmarried:
0.0% (0)
Women who did not give birth in the past 12 months Now married:
74.9% (515)Unmarried:
25.1% (172)
Marital status - White alone, not Hispanic / Latino population 15 years and over
Males 35.8% Never married52.2% Now married0.2% Separated2.4% Widowed9.5% DivorcedFemales 35.3% Never married40.9% Now married1.2% Separated6.2% Widowed16.4% DivorcedWomen who gave birth in the past 12 months Now married:
0.0% (0)Unmarried:
100.0% (12)
Women who did not give birth in the past 12 months Now married:
34.8% (631)Unmarried:
65.2% (1,181)
Marital status - Hispanic or Latino population 15 years and over
Males 56.3% Never married43.7% Now married0.0% Separated0.0% Widowed0.0% DivorcedFemales 37.3% Never married59.2% Now married3.2% Separated0.0% Widowed0.3% DivorcedWomen who gave birth in the past 12 months Now married:
100.0% (81)Unmarried:
0.0% (0)
Women who did not give birth in the past 12 months Now married:
56.5% (535)Unmarried:
43.5% (411)
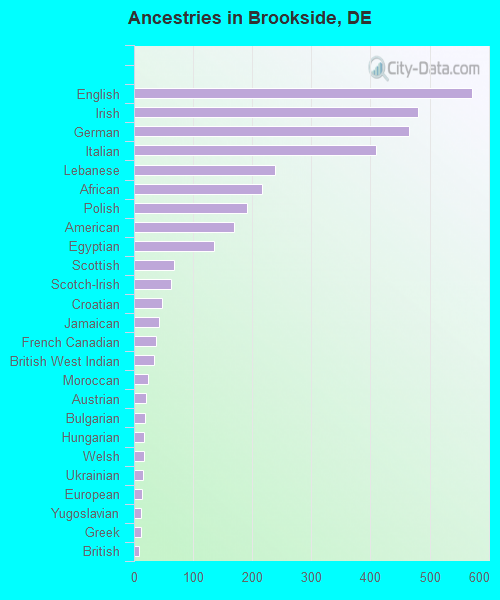
Ancestries in Brookside
572 8.0% English481 6.7% Irish466 6.5% German410 5.7% Italian239 3.3% Lebanese217 3.0% African192 2.7% Polish169 2.4% American135 1.9% Egyptian68 0.9% Scottish63 0.9% Scotch-Irish47 0.7% Croatian43 0.6% Jamaican38 0.5% French Canadian33 0.5% British West Indian23 0.3% Moroccan21 0.3% Austrian18 0.3% Bulgarian17 0.2% Hungarian17 0.2% Welsh15 0.2% Ukrainian14 0.2% European12 0.2% Yugoslavian11 0.2% Greek9 0.1% British8 0.1% Swedish7 0.10% Eastern European7 0.10% French7 0.10% Slavic
Geographical mobility in Brookside Same house 1 year ago 7,686 91.8% White (Caucasian)1,625 89.7% Black or African American34 100.0% American Indian / Alaska Native1,409 99.5% Asian695 97.9% Other race1,750 80.8% Two or more races7,063 90.9% White alone, not Hispanic / Latino2,649 91.8% Hispanic or LatinoMoved within same county 431 5.1% White / Caucasian107 5.9% Black or African American4 0.3% Asian45 6.3% Other race31 1.5% Two or more races478 6.1% White alone, not Hispanic / Latino45 1.6% Hispanic or LatinoMoved within same state 47 0.6% White / Caucasian68 3.1% Two or more races41 0.5% White alone, not Hispanic / Latino73 2.5% Hispanic or LatinoMoved from different state 156 1.9% White / Caucasian78 4.3% Black or African American56 3.9% Asian219 10.1% Two or more races129 1.7% White alone, not Hispanic / Latino89 3.1% Hispanic or LatinoMoved from abroad 26 0.3% White8 0.6% Asian145 6.7% Two or more races34 0.4% White alone, not Hispanic / Latino65 2.2% Hispanic or Latino
Children Nativity (place of birth) in Brookside
Children under 6 years - Living with two parents Both parents native 205 100.0% NativeBoth parents foreign-born 151 87.7% Native21 12.3% Foreign-bornOne native, one foreign-born parent 148 95.5% Native7 4.5% Foreign-bornChildren under 6 years - Living with one parent Native parent 328 100.0% NativeForeign-born parent 157 100.0% NativeChildren 6 to 17 years - Living with two parents Both parents native 607 100.0% NativeBoth parents foreign-born 582 100.0% NativeOne native, one foreign-born parent 85 100.0% NativeChildren 6 to 17 years - Living with one parent Native parent 465 100.0% NativeForeign-born parent 152 59.9% Native102 40.1% Foreign-born
Grandparents responsible for own grandchildren in Brookside
Grandparents (30 to 59 years) White / Caucasian 61 59.6% Responsible for grandchildren41 40.4% Not responsible for grandchildrenBlack or African American 12 100.0% Not responsible for grandchildrenOther race 24 100.0% Not responsible for grandchildrenTwo or more races 14 100.0% Responsible for grandchildrenWhite alone, not Hispanic / Latino 70 72.5% Responsible for grandchildren27 27.5% Not responsible for grandchildrenHispanic or Latino 29 100.0% Not responsible for grandchildrenGrandparents (60 years and over) White / Caucasian 38 32.3% Responsible for grandchildren80 67.7% Not responsible for grandchildrenBlack or African American 34 100.0% Not responsible for grandchildrenWhite alone, not Hispanic / Latino 40 36.6% Responsible for grandchildren69 63.4% Not responsible for grandchildrenHispanic or Latino 12 100.0% Not responsible for grandchildren