Bethlehem, CT (Connecticut) Houses and Residents
| Bethlehem: | $476,049 |
| Connecticut: | $347,200 |
Total population: 3,607 (Urban population: 0, Rural population: 3,422 (140 farm, 3,282 nonfarm))
Houses: 1,388 (1,246 occupied: 1,065 owner occupied, 181 renter occupied)
| % of renters here: | 15% |
| State: | 34% |
Housing density: 72 houses/condos per square mile
Median price asked for vacant for-sale houses and condos in 2022 in this county: $399,480.
Median contract rent in 2022: $1,512 (lower quartile is $720, upper quartile is over $2,000)
Median gross rent in Bethlehem, CT in 2022: $1,963
Housing units in Bethlehem with a mortgage: 673 (78 second mortgage, 97 home equity loan, 0 both second mortgage and home equity loan)
Houses without a mortgage: 233
Compare current foreclosures near Bethlehem, CT:
| Photo | Address | Area | Beds / Baths | Price | Details |
|---|---|---|---|---|---|

|
#1
Munger Ln
Bethlehem, CT 06751
|
- sq. feet
|
- baths - beds |
show details | |

|
#2
Allen St
Bristol, CT 06010
|
1,092 sq. feet
|
1 baths 3 beds |
$215,000
|
show details |

|
#3
Chestnut St
Naugatuck, CT 06770
|
1,012 sq. feet
|
1 baths 2 beds |
$279,900
|
show details |

|
#4
Wieting Rd
New Milford, CT 06776
|
3,210 sq. feet
|
3 baths 5 beds |
$549,900
|
show details |

|
#5
Janwood Rd
Waterbury, CT 06708
|
1,200 sq. feet
|
2 baths 3 beds |
$275,000
|
show details |

|
#6
Woodbine St
Torrington, CT 06790
|
2,756 sq. feet
|
3 baths 6 beds |
$419,900
|
show details |

|
#7
Clinton Hill Rd
Wolcott, CT 06716
|
1,828 sq. feet
|
1 baths 3 beds |
$240,000
|
show details |

|
#8
Horne Cir
Southington, CT 06489
|
1,902 sq. feet
|
2 baths 4 beds |
show details | |

|
#9
Governors Hill Rd
Oxford, CT 06478
|
2,106 sq. feet
|
2 baths 3 beds |
show details | |

|
#10
Vanderbilt Rd
Bristol, CT 06010
|
1,803 sq. feet
|
1 baths 5 beds |
show details |
| Photo | Address | Area | Beds / Baths | Price | Details |
|---|---|---|---|---|---|

|
#11
New Haven Rd Apt 6-E
Naugatuck, CT 06770
|
1,008 sq. feet
|
1 baths 2 beds |
show details | |

|
#12
Calumet St
Waterbury, CT 06710
|
2,175 sq. feet
|
2 baths 4 beds |
show details | |

|
#13
Maple Hill Rd
Naugatuck, CT 06770
|
1,600 sq. feet
|
2 baths 3 beds |
show details | |

|
#14
Fawn Meadow Dr
Naugatuck, CT 06770
|
3,052 sq. feet
|
3 baths 4 beds |
show details | |

|
#15
Doran St
Waterbury, CT 06704
|
1,036 sq. feet
|
1 baths 3 beds |
show details | |

|
#16
Melinda Ln
Bristol, CT 06010
|
- sq. feet
|
2 baths 4 beds |
show details | |

|
#17
Litchfield Rd
Harwinton, CT 06791
|
2,216 sq. feet
|
1 baths 3 beds |
show details | |

|
#18
Carter Rd
Plymouth, CT 06782
|
2,192 sq. feet
|
2 baths 3 beds |
show details | |

|
#19
Clairmont Ave
Waterbury, CT 06708
|
1,564 sq. feet
|
2 baths 4 beds |
show details | |

|
#20
Fairfield Ave
Waterbury, CT 06708
|
1,538 sq. feet
|
1 baths 2 beds |
show details |
| Photo | Address | Area | Beds / Baths | Price | Details |
|---|---|---|---|---|---|

|
#21
Marcia Dr
Torrington, CT 06790
|
1,496 sq. feet
|
2 baths 4 beds |
show details | |

|
#22
Barbara Dr
Waterbury, CT 06705
|
1,248 sq. feet
|
2 baths 3 beds |
show details | |

|
#23
Bch St
Goshen, CT 06756
|
1,380 sq. feet
|
1 baths 4 beds |
show details | |

|
#24
Sylvan Ave
Terryville, CT 06786
|
1,691 sq. feet
|
1 baths 4 beds |
show details | |

|
#25
Spring St
Naugatuck, CT 06770
|
1,216 sq. feet
|
1 baths 3 beds |
show details | |

|
#26
Rena Ln
Waterbury, CT 06705
|
1,080 sq. feet
|
1 baths 3 beds |
show details | |

|
#27
Sylvan Ave
Waterbury, CT 06706
|
1,350 sq. feet
|
1 baths 4 beds |
show details | |

|
#28
Surrey Dr
Bristol, CT 06010
|
1,079 sq. feet
|
1 baths 3 beds |
show details | |

|
#29
Lockhart Ave
Waterbury, CT 06705
|
- sq. feet
|
2 baths 3 beds |
show details | |

|
#30
Juniper Rd
Newtown, CT 06470
|
3,720 sq. feet
|
5 baths 6 beds |
show details |
| Photo | Address | Area | Beds / Baths | Price | Details |
|---|---|---|---|---|---|

|
#31
Flanders Rd
Woodbury, CT 06798
|
2,424 sq. feet
|
2 baths 4 beds |
show details | |

|
#32
Shrub Rd
Bristol, CT 06010
|
2,694 sq. feet
|
3 baths 4 beds |
show details | |

|
#33
Wolcott St Apt 21
Bristol, CT 06010
|
980 sq. feet
|
1 baths 2 beds |
show details | |

|
#34
Muir Ln
New Milford, CT 06776
|
2,608 sq. feet
|
2 baths 4 beds |
show details | |

|
#35
Riverford Rd
Brookfield, CT 06804
|
3,682 sq. feet
|
3 baths 4 beds |
show details | |

|
#36
Wynwood Dr
New Milford, CT 06776
|
1,189 sq. feet
|
2 baths 3 beds |
show details | |

|
#37
Housatonic Dr
Sandy Hook, CT 06482
|
4,522 sq. feet
|
2 baths 3 beds |
show details | |

|
#38
Berry St
Torrington, CT 06790
|
2,496 sq. feet
|
3 baths 6 beds |
show details | |

|
#39
Scott St
Naugatuck, CT 06770
|
1,104 sq. feet
|
1 baths 3 beds |
show details | |

|
#40
Jerome Ave
Burlington, CT 06013
|
1,400 sq. feet
|
1 baths 3 beds |
show details |
| Photo | Address | Area | Beds / Baths | Price | Details |
|---|---|---|---|---|---|

|
#41
Everett St
Bristol, CT 06010
|
1,648 sq. feet
|
1 baths 3 beds |
show details | |

|
#42
Wolcott St
Bristol, CT 06010
|
1,920 sq. feet
|
2 baths 3 beds |
show details | |

|
#43
Torcon Dr
Torrington, CT 06790
|
1,336 sq. feet
|
1 baths 2 beds |
show details | |

|
#44
Pinnacle Rd
Bristol, CT 06010
|
1,288 sq. feet
|
1 baths 3 beds |
show details | |

|
#45
Park St
Bristol, CT 06010
|
3,171 sq. feet
|
4 baths 9 beds |
show details | |

|
#46
Candlewood Lake Rd
Brookfield, CT 06804
|
2,656 sq. feet
|
2 baths 6 beds |
show details | |

|
#47
Kozani St
Bristol, CT 06010
|
1,040 sq. feet
|
1 baths 3 beds |
show details | |

|
#48
Treble Rd
Bristol, CT 06010
|
2,130 sq. feet
|
2 baths 4 beds |
show details | |

|
#49
Ben St
Bristol, CT 06010
|
1,114 sq. feet
|
2 baths 3 beds |
show details | |

|
Check over 1 million property listings on Foreclosure.com!
|
browse all offers | |||
Latest news about housing in Bethlehem, CT collected exclusively by city-data.com from local newspapers, TV, and radio stations


Household type by relationship:
Households: 187,123- In family households: 156,490 (36,561 male householders, 14,969 female householders)
41,185 spouses, 52,814 children (49,404 natural, 1,325 adopted, 2,085 stepchildren), 2,365 grandchildren, 1,073 brothers or sisters, 1,650 parents, foster children, 1,216 other relatives, 3,500 non-relatives
- In nonfamily households: 30,633 (11,692 male householders (9,019 living alone)), 13,418 female householders (11,384 living alone)), 5,523 nonrelatives
- In group quarters: 2,804 (1,566 institutionalized population)
34,479 married couples with children.
7,472 single-parent households (1,895 men, 5,577 women).
96.7% of residents of Bethlehem speak English at home.
0.1% of residents speak Spanish at home (100% speak English very well).
3.2% of residents speak other Indo-European language at home (79% speak English very well, 13% speak English well, 9% don't speak English at all).
Foreign born population: 199 (4.8%)
(97.0% of them are naturalized citizens)
| Here: | 7.2 |
| State: | 6.5 |
| Here: | 4.7 |
| State: | 4.0 |

- Bedrooms in owner-occupied houses and condos in Bethlehem, Connecticut
- 0no bedroom
- 301 bedroom
- 1552 bedrooms
- 6233 bedrooms
- 2184 bedrooms
- 395+ bedrooms

- Bedrooms in renter-occupied apartments in Bethlehem, Connecticut
- 0no bedroom
- 371 bedroom
- 732 bedrooms
- 713 bedrooms
- 04 bedrooms
- 05+ bedrooms

- Cars and other vehicles available in Bethlehem in owner-occupied houses/condos
- 26no vehicle
- 1801 vehicle
- 4622 vehicles
- 3243 vehicles
- 594 vehicles
- 145+ vehicles

- Cars and other vehicles available in Bethlehem in renter-occupied apartments
- 12no vehicle
- 901 vehicle
- 312 vehicles
- 483 vehicles
- 04 vehicles
- 05+ vehicles

- Rooms in owner-occupied houses in Bethlehem, Connecticut
- 01 room
- 02 rooms
- 183 rooms
- 704 rooms
- 1485 rooms
- 2516 rooms
- 2497 rooms
- 1658 rooms
- 1649+ rooms

- Rooms in renter-occupied apartments in Bethlehem, Connecticut
- 01 room
- 252 rooms
- 63 rooms
- 544 rooms
- 355 rooms
- 246 rooms
- 317 rooms
- 68 rooms
- 09+ rooms


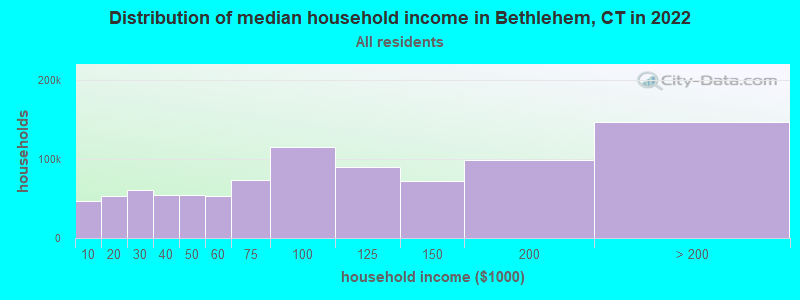
Bethlehem, CT household income distribution

- 5,185Less than $10,000
- 4,208$10,000 to $19,999
- 6,581$20,000 to $29,999
- 8,486$30,000 to $39,999
- 6,871$40,000 to $49,999
- 8,325$50,000 to $59,999
- 16,111$60,000 to $74,999
- 23,276$75,000 to $99,999
- 22,199$100,000 to $124,999
- 17,895$125,000 to $149,999
- 25,760$150,000 to $199,999
- 47,369$200,000 or more
Percentage of workers working in this county: 52.3%
Number of people working at home: 409 (18.8% of all workers)
Travel time to work (commute)
- Less than 5 minutes: 65
- 5 to 9 minutes: 86
- 10 to 14 minutes: 133
- 15 to 19 minutes: 257
- 20 to 24 minutes: 349
- 25 to 29 minutes: 141
- 30 to 34 minutes: 245
- 35 to 39 minutes: 100
- 40 to 44 minutes: 97
- 45 to 59 minutes: 71
- 60 to 89 minutes: 148
- 90 or more minutes: 60
Means of transportation to work:
- Drove a car alone: 1,539 (82.8%)
- Carpooled: 167 (9.0%)
- Subway or elevated: 12 (0.6%)
- Railroad: 4 (0.2%)
- Taxi: 6 (0.3%)
- Bicycle: 6 (0.3%)
- Walked: 18 (1.0%)
- Worked at home: 107 (5.8%)

- Year of entry for the foreign-born population in Bethlehem, Connecticut
- 01995 to March 2000
- 01990 to 1994
- 01985 to 1989
- 01980 to 1984
- 141975 to 1979
- 61970 to 1974
- 211965 to 1969
- 79Before 1965

First ancestries reported:
- Italian: 726 (16.7%)
- Irish: 684 (15.7%)
- German: 509 (11.7%)
- English: 435 (10.0%)
- Lithuanian: 281 (6.5%)
- Polish: 279 (6.4%)
- Other: 271 (6.2%)
- French: 214 (4.9%)
- United States: 181 (4.2%)
- French Canadian: 134 (3.1%)
- Swedish: 117 (2.7%)
- Greek: 77 (1.8%)
- Scotch-Irish: 64 (1.5%)
- Russian: 59 (1.4%)
- Dutch: 58 (1.3%)
- Hungarian: 56 (1.3%)
- Scottish: 44 (1.0%)
- Welsh: 39 (0.9%)
- Norwegian: 32 (0.7%)
- Ukrainian: 28 (0.6%)
- Danish: 19 (0.4%)
- Arab: 18 (0.4%)
- Portuguese: 11 (0.3%)
- Slovak: 10 (0.2%)
- Czech: 6 (0.1%)
Most common places of birth for foreign-born residents (%):
| Bethlehem: | 21.7% (26) |
| Connecticut: | 3.1% (11,432) |
| Bethlehem: | 13.3% (16) |
| Connecticut: | 0.3% (1,213) |
| Bethlehem: | 11.7% (14) |
| Connecticut: | 0.4% (1,303) |
| Bethlehem: | 10.0% (12) |
| Connecticut: | 4.4% (16,395) |
| Bethlehem: | 8.3% (10) |
| Connecticut: | 0.7% (2,742) |
| Bethlehem: | 8.3% (10) |
| Connecticut: | 1.2% (4,622) |
| Bethlehem: | 5.8% (7) |
| Connecticut: | 5.2% (19,083) |
| Bethlehem: | 5.0% (6) |
| Connecticut: | 7.2% (26,819) |
| Bethlehem: | 4.2% (5) |
| Connecticut: | 0.7% (2,646) |
| Bethlehem: | 4.2% (5) |
| Connecticut: | 2.1% (7,596) |
| Bethlehem: | 4.2% (5) |
| Connecticut: | 3.2% (12,009) |
| Bethlehem: | 3.3% (4) |
| Connecticut: | 1.2% (4,344) |
Place of birth for U.S.-born residents:
- This state: 2,517
- Other state: 781
- Northeast: 555
- Midwest: 137
- South: 52
- West: 37
72% of Bethlehem residents lived in the same house 5 years ago.
Out of people who lived in different houses, 53% lived in this county.
Out of people who lived in different counties, 60% lived in Connecticut.
Education attainment for males 25 years and older:
- No schooling: 9
- Nursery to 4th grade: 0
- 5th and 6th grade: 0
- 7th and 8th grade: 8
- 9th grade: 0
- 10th grade: 12
- 11th grade: 0
- 12th grade, no diploma: 51
- High school graduate (or equivalency): 322
- Less than 1 year of college: 66
- Some college more than 1 year, no degree: 203
- Associate degree: 109
- Bachelor's degree: 223
- Master's degree: 126
- Professional school degree: 17
- Doctorate degree: 14

Education attainment for females 25 years and older:
- No schooling: 21
- Nursery to 4th grade: 0
- 5th and 6th grade: 0
- 7th and 8th grade: 14
- 9th grade: 10
- 10th grade: 6
- 11th grade: 33
- 12th grade, no diploma: 63
- High school graduate (or equivalency): 279
- Less than 1 year of college: 61
- Some college more than 1 year, no degree: 164
- Associate degree: 139
- Bachelor's degree: 303
- Master's degree: 159
- Professional school degree: 9
- Doctorate degree: 5


Housing units in structures:
- One, detached: 1,269
- One, attached: 5
- Two: 61
- 3 or 4: 25
- 5 to 9: 7
- 20 to 49: 6
- Mobile homes: 15
Median worth of mobile homes: $170,372

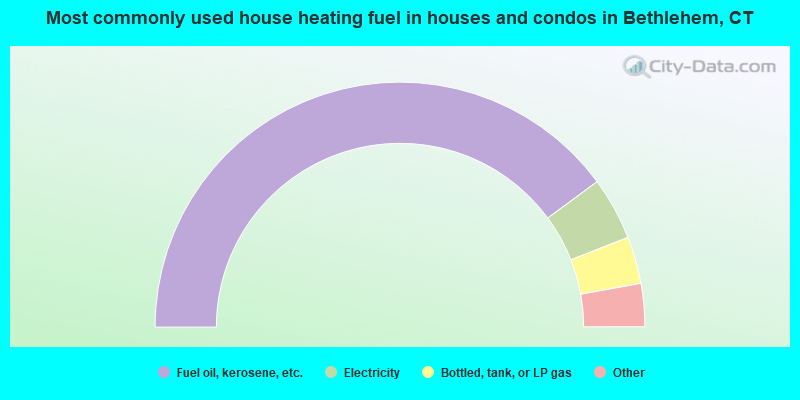
- 79.8%Fuel oil, kerosene, etc.
- 8.3%Electricity
- 6.2%Bottled, tank, or LP gas
- 3.7%Wood
- 1.0%Solar energy
- 0.6%Coal or coke
- 0.5%Utility gas
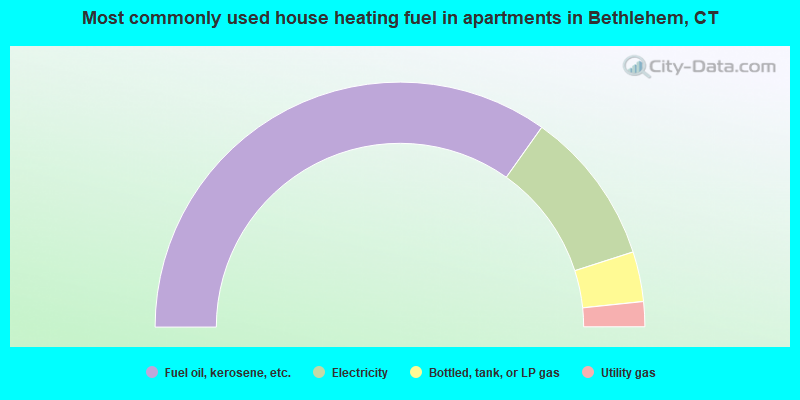
- 69.6%Fuel oil, kerosene, etc.
- 20.4%Electricity
- 6.6%Bottled, tank, or LP gas
- 3.3%Utility gas
Private vs. public school enrollment:
| Here: | 5.3% |
| Connecticut: | 9.9% |
| Here: | 24.5% |
| Connecticut: | 11.0% |
| Here: | 18.0% |
| Connecticut: | 33.4% |


