Bethlehem, Connecticut (CT) income map, earnings map, and wages data
The median household income in Bethlehem, CT in 2022 was $115,982, which was 23.8% greater than the median annual income of $88,429 across the entire state of Connecticut. Compared to the median income of $68,542 in 2000 this represents an increase of 40.9%. The per capita income in 2022 was $54,278, which means an increase of 45.3% compared to 2000 when it was $29,672.
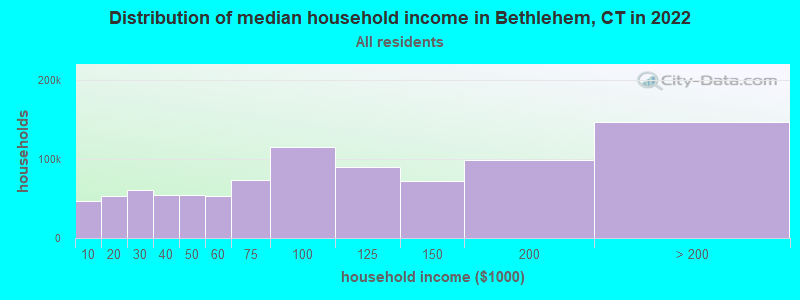
Income statistics for all residents
Median household income in Bethlehem, CT in 2022:| Bethlehem: | $115,983 |
| State: | $88,429 |
Change in median household income between 2000 and 2022:| Bethlehem, Connecticut: | +69.2% |
| State: | +64.0% |
Number of households with income < $10k:| Bethlehem: | 5.2% (47,242) |
| State: | 5.1% (72,746) |
Number of households with income $10k - 20k:| Bethlehem: | 5.8% (53,272) |
| State: | 5.7% (81,643) |
Number of households with income $20k - 30k:| Bethlehem: | 6.6% (60,299) |
| State: | 6.5% (92,844) |
Number of households with income $30k - 40k:| Bethlehem: | 5.9% (54,115) |
| State: | 5.9% (83,934) |
Number of households with income $40k - 50k:| Bethlehem: | 5.9% (53,767) |
| Connecticut: | 5.8% (83,025) |
Number of households with income $50k - 60k:| Bethlehem: | 5.8% (52,722) |
| Connecticut: | 5.7% (81,788) |
Number of households with income $60k - 75k:| Bethlehem: | 8.1% (73,871) |
| State: | 8.1% (115,651) |
Number of households with income $75k - 100k:| Bethlehem: | 12.6% (115,369) |
| State: | 12.6% (180,173) |
Number of households with income $100k - 125k:| Bethlehem: | 9.8% (89,814) |
| State: | 9.9% (141,231) |
Number of households with income $125k - 150k:| Bethlehem: | 7.8% (71,725) |
| State: | 7.9% (112,826) |
Number of households with income $150k - 200k:| Bethlehem: | 10.7% (98,114) |
| State: | 10.8% (154,641) |
Number of households with income > $200k:| Bethlehem: | 16.0% (146,576) |
| Connecticut: | 16.3% (233,133) |
Aggregate household income in Bethlehem in 2022: $4,264,299,636
Median family income in Bethlehem in 2022:| Bethlehem: | $140,849 |
| State: | $115,183 |
Median non-family income in Bethlehem in 2022:| Bethlehem: | $53,871 |
| State: | $50,964 |
Change in median non-family income between 2000 and 2022:| Bethlehem, Connecticut: | +71.5% |
| State: | +65.1% |
Median per capita income in Bethlehem in 2022:| Bethlehem: | $54,279 |
| State: | $51,581 |
Change in median per capita income between 2000 and 2022:| Bethlehem, Connecticut: | +82.9% |
| Connecticut: | +79.3% |
Income statistics for White residents
Median household income in Bethlehem, CT in 2022:| Bethlehem: | $116,659 |
| Connecticut: | $96,890 |
Change in median household income between 2000 and 2022:| Bethlehem, Connecticut: | +69.4% |
| Connecticut: | +68.5% |
Number of households with income < $10k:| Bethlehem: | 4.2% (25,516) |
| Connecticut: | 4.2% (42,265) |
Number of households with income $10k - 20k:| Bethlehem: | 4.9% (29,336) |
| State: | 4.8% (48,323) |
Number of households with income $20k - 30k:| Bethlehem: | 5.8% (34,888) |
| Connecticut: | 5.7% (57,716) |
Number of households with income $30k - 40k:| Bethlehem: | 5.4% (32,293) |
| State: | 5.3% (53,827) |
Number of households with income $40k - 50k:| Bethlehem: | 5.3% (32,161) |
| State: | 5.3% (53,301) |
Number of households with income $50k - 60k:| Bethlehem: | 5.6% (33,469) |
| Connecticut: | 5.5% (55,690) |
Number of households with income $60k - 75k:| Bethlehem: | 7.9% (47,829) |
| State: | 8.0% (80,329) |
Number of households with income $75k - 100k:| Bethlehem: | 12.7% (76,640) |
| State: | 12.7% (128,070) |
Number of households with income $100k - 125k:| Bethlehem: | 10.0% (60,181) |
| State: | 10.0% (101,210) |
Number of households with income $125k - 150k:| Bethlehem: | 8.0% (48,315) |
| State: | 8.0% (81,250) |
Number of households with income $150k - 200k:| Bethlehem: | 11.8% (71,042) |
| Connecticut: | 11.8% (119,527) |
Number of households with income > $200k:| Bethlehem: | 18.4% (111,213) |
| State: | 18.6% (187,875) |
Aggregate household income in Bethlehem in 2022: $3,198,484,889
Median family income in Bethlehem in 2022:| Bethlehem: | $144,605 |
| Connecticut: | $128,955 |
Number of families with income < $10k:| Bethlehem: | 0.7% (6) |
| Connecticut: | 1.9% (11,537) |
Number of families with income $10k - 20k:| Bethlehem: | 1.0% (8) |
| State: | 1.8% (11,289) |
Number of families with income $20k - 30k:| Bethlehem: | 1.1% (9) |
| State: | 3.0% (18,506) |
Number of families with income $30k - 40k:| Bethlehem: | 1.5% (12) |
| State: | 2.9% (18,160) |
Number of families with income $40k - 50k:| Bethlehem: | 4.0% (34) |
| State: | 3.9% (24,550) |
Number of families with income $50k - 60k:| Bethlehem: | 5.0% (42) |
| Connecticut: | 4.3% (26,723) |
Number of families with income $60k - 75k:| Bethlehem: | 7.7% (64) |
| State: | 7.1% (44,075) |
Number of families with income $75k - 100k:| Bethlehem: | 16.6% (139) |
| Connecticut: | 12.5% (77,679) |
Number of families with income $100k - 125k:| Bethlehem: | 13.8% (116) |
| State: | 11.1% (69,086) |
Number of families with income $125k - 150k:| Bethlehem: | 19.1% (160) |
| Connecticut: | 9.6% (59,616) |
Number of families with income $150k - 200k:| Bethlehem: | 19.4% (163) |
| Connecticut: | 15.7% (97,890) |
Number of families with income > $200k:| Bethlehem: | 10.2% (86) |
| State: | 26.3% (163,417) |
Median non-family income in Bethlehem in 2022:| Bethlehem: | $53,839 |
| Connecticut: | $54,067 |
Change in median non-family income between 2000 and 2022:| Bethlehem, Connecticut: | +73.7% |
| State: | +68.7% |
Median per capita income in Bethlehem in 2022:| Bethlehem: | $56,923 |
| State: | $59,916 |
Change in median per capita income between 2000 and 2022:| Bethlehem, Connecticut: | +92.1% |
| State: | +90.2% |
Income statistics for Black or African American residents
Median household income in Bethlehem, CT in 2022:| Bethlehem: | $63,469 |
| State: | $61,803 |
Change in median household income between 2000 and 2022:| Bethlehem, Connecticut: | +60.9% |
| State: | +76.1% |
Number of households with income < $10k:| Bethlehem: | 6.8% (10,668) |
| State: | 6.8% (9,494) |
Number of households with income $10k - 20k:| Bethlehem: | 7.9% (12,364) |
| Connecticut: | 7.9% (11,003) |
Number of households with income $20k - 30k:| Bethlehem: | 10.8% (16,905) |
| Connecticut: | 10.8% (15,045) |
Number of households with income $30k - 40k:| Bethlehem: | 8.2% (12,923) |
| State: | 8.2% (11,501) |
Number of households with income $40k - 50k:| Bethlehem: | 7.4% (11,704) |
| State: | 7.4% (10,416) |
Number of households with income $50k - 60k:| Bethlehem: | 7.5% (11,836) |
| Connecticut: | 7.5% (10,534) |
Number of households with income $60k - 75k:| Bethlehem: | 8.0% (12,634) |
| State: | 8.0% (11,244) |
Number of households with income $75k - 100k:| Bethlehem: | 9.6% (15,023) |
| State: | 9.6% (13,370) |
Number of households with income $100k - 125k:| Bethlehem: | 10.2% (16,005) |
| State: | 10.2% (14,244) |
Number of households with income $125k - 150k:| Bethlehem: | 8.0% (12,636) |
| State: | 8.0% (11,246) |
Number of households with income $150k - 200k:| Bethlehem: | 7.7% (12,053) |
| State: | 7.7% (10,727) |
Number of households with income > $200k:| Bethlehem: | 7.9% (12,457) |
| Connecticut: | 7.9% (11,086) |
Aggregate household income in Bethlehem in 2022: $3,261,547
Median family income in Bethlehem in 2022:| Bethlehem: | $86,101 |
| Connecticut: | $87,228 |
Median non-family income in Bethlehem in 2022:| Bethlehem: | $108,400 |
| State: | $38,608 |
Change in median non-family income between 2000 and 2022:| Bethlehem, Connecticut: | +77.0% |
| State: | +77.0% |
Median per capita income in Bethlehem in 2022:| Bethlehem: | $66,342 |
| State: | $36,289 |
Change in median per capita income between 2000 and 2022:| Bethlehem, Connecticut: | +115.2% |
| State: | +117.5% |
Income statistics for Hispanic or Latino residents
Median household income in Bethlehem, CT in 2022:| Bethlehem: | $31,461 |
| State: | $60,275 |
Change in median household income between 2000 and 2022:| Bethlehem, Connecticut: | +67.8% |
| State: | +87.9% |
Number of households with income < $10k:| Bethlehem: | 8.7% (10,864) |
| Connecticut: | 8.7% (18,584) |
Number of households with income $10k - 20k:| Bethlehem: | 9.1% (11,244) |
| State: | 9.1% (19,235) |
Number of households with income $20k - 30k:| Bethlehem: | 8.9% (11,101) |
| Connecticut: | 8.9% (18,989) |
Number of households with income $30k - 40k:| Bethlehem: | 7.5% (9,334) |
| State: | 7.5% (15,967) |
Number of households with income $40k - 50k:| Bethlehem: | 8.7% (10,795) |
| State: | 8.7% (18,466) |
Number of households with income $50k - 60k:| Bethlehem: | 6.9% (8,597) |
| Connecticut: | 6.9% (14,706) |
Number of households with income $60k - 75k:| Bethlehem: | 8.9% (11,041) |
| Connecticut: | 8.9% (18,888) |
Number of households with income $75k - 100k:| Bethlehem: | 13.5% (16,759) |
| Connecticut: | 13.5% (28,669) |
Number of households with income $100k - 125k:| Bethlehem: | 8.2% (10,191) |
| State: | 8.2% (17,434) |
Number of households with income $125k - 150k:| Bethlehem: | 6.5% (8,039) |
| Connecticut: | 6.5% (13,752) |
Number of households with income $150k - 200k:| Bethlehem: | 6.6% (8,251) |
| State: | 6.6% (14,114) |
Number of households with income > $200k:| Bethlehem: | 6.4% (7,968) |
| Connecticut: | 6.4% (13,630) |
Aggregate household income in Bethlehem in 2022: $625,216
Median non-family income in Bethlehem in 2022:| Bethlehem: | $32,603 |
| State: | $36,714 |
Change in median non-family income between 2000 and 2022:| Bethlehem, Connecticut: | +73.9% |
| Connecticut: | +90.0% |
Median per capita income in Bethlehem in 2022:| Bethlehem: | $112,200 |
| State: | $28,507 |
Change in median per capita income between 2000 and 2022:| Bethlehem, Connecticut: | +80.3% |
| State: | +117.2% |
Income statistics for American Indian and Alaska Native residents
Number of households with income < $10k:| Bethlehem: | 8.4% (301,812) |
| State: | 10.2% (340) |
Number of households with income $10k - 20k:| Bethlehem: | 9.4% (336,815) |
| State: | 8.5% (283) |
Number of households with income $20k - 30k:| Bethlehem: | 8.5% (304,653) |
| State: | 9.4% (314) |
Number of households with income $30k - 40k:| Bethlehem: | 9.1% (326,398) |
| Connecticut: | 10.1% (337) |
Number of households with income $40k - 50k:| Bethlehem: | 8.3% (299,395) |
| Connecticut: | 13.4% (447) |
Number of households with income $50k - 60k:| Bethlehem: | 7.8% (282,304) |
| State: | 3.1% (104) |
Number of households with income $60k - 75k:| Bethlehem: | 9.8% (351,879) |
| State: | 5.6% (188) |
Number of households with income $75k - 100k:| Bethlehem: | 12.6% (454,220) |
| State: | 13.4% (447) |
Number of households with income $100k - 125k:| Bethlehem: | 9.4% (339,666) |
| State: | 9.5% (317) |
Number of households with income $125k - 150k:| Bethlehem: | 5.6% (203,356) |
| State: | 3.9% (131) |
Number of households with income $150k - 200k:| Bethlehem: | 6.0% (214,376) |
| Connecticut: | 6.3% (212) |
Number of households with income > $200k:| Bethlehem: | 5.2% (185,555) |
| Connecticut: | 6.8% (228) |
Median per capita income in Bethlehem in 2022:| Bethlehem: | $65,238 |
| State: | $25,355 |
Change in median per capita income between 2000 and 2022:| Bethlehem, Connecticut: | +45.9% |
| Connecticut: | +39.4% |
Income statistics for other residents
Number of households with income < $10k:| Bethlehem: | 9.3% (5) |
| State: | 9.0% (8,596) |
Number of households with income $10k - 20k:| Bethlehem: | 11.1% (6) |
| State: | 10.2% (9,773) |
Number of households with income $20k - 30k:| Bethlehem: | 9.3% (5) |
| Connecticut: | 9.1% (8,691) |
Number of households with income $30k - 40k:| Bethlehem: | 7.4% (4) |
| Connecticut: | 7.8% (7,447) |
Number of households with income $40k - 50k:| Bethlehem: | 9.3% (5) |
| Connecticut: | 8.2% (7,860) |
Number of households with income $50k - 60k:| Bethlehem: | 5.6% (3) |
| Connecticut: | 6.0% (5,757) |
Number of households with income $60k - 75k:| Bethlehem: | 9.3% (5) |
| State: | 9.3% (8,942) |
Number of households with income $75k - 100k:| Bethlehem: | 14.8% (8) |
| State: | 14.3% (13,700) |
Number of households with income $100k - 125k:| Bethlehem: | 7.4% (4) |
| Connecticut: | 7.2% (6,906) |
Number of households with income $125k - 150k:| Bethlehem: | 5.6% (3) |
| State: | 6.5% (6,215) |
Number of households with income $150k - 200k:| Bethlehem: | 5.6% (3) |
| State: | 6.1% (5,865) |
Number of households with income > $200k:| Bethlehem: | 5.6% (3) |
| State: | 6.3% (6,065) |
Aggregate household income in Bethlehem in 2022: $7,541,567
Median family income in Bethlehem in 2022:| Bethlehem: | $240,302 |
| State: | $67,610 |
Number of families with income $100k - 125k:| Bethlehem: | 100.0% (47) |
| Connecticut: | 6.8% (4,502) |
Median per capita income in Bethlehem in 2022:| Bethlehem: | $93,589 |
| Connecticut: | $29,353 |