Bethesda, TN (Tennessee) Houses and Residents
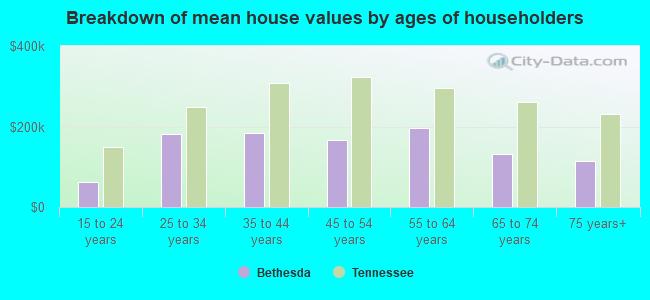
| Bethesda: | $240,102 |
| Tennessee: | $284,800 |
Total population: 6,697 (Urban population: 157, Rural population: 6,011 (420 farm, 5,591 nonfarm))
Houses: 2,660 (2,474 occupied: 2,103 owner occupied, 371 renter occupied)
| % of renters here: | 15% |
| State: | 33% |
Housing density: 45 houses/condos per square mile
Median price asked for vacant for-sale houses and condos in 2022 in this county: $342,342.
Median contract rent in 2022: $768 (lower quartile is $599, upper quartile is $946)
Median rent asked for vacant for-rent units in 2022: $753
Median gross rent in Bethesda, TN in 2022: $1,012
Housing units in Bethesda with a mortgage: 779 (93 second mortgage, 108 home equity loan, 0 both second mortgage and home equity loan)
Houses without a mortgage: 495


Household type by relationship:
Households: 118,330- In family households: 94,660 (23,497 male householders, 8,822 female householders)
24,570 spouses, 29,839 children (27,230 natural, 912 adopted, 1,697 stepchildren), 2,427 grandchildren, 849 brothers or sisters, 812 parents, foster children, 959 other relatives, 2,263 non-relatives
- In nonfamily households: 23,670 (8,833 male householders (6,790 living alone)), 10,170 female householders (8,536 living alone)), 4,667 nonrelatives
- In group quarters: 4,649 (1,446 institutionalized population)
15,721 married couples with children.
5,069 single-parent households (1,053 men, 4,016 women).
97.9% of residents of Bethesda speak English at home.
1.2% of residents speak Spanish at home (78% speak English very well, 22% speak English not well).
0.9% of residents speak other Indo-European language at home (52% speak English very well, 37% speak English well, 12% speak English not well).
Foreign born population: 78 (1.0%)
(0.0% of them are naturalized citizens)
| Here: | 5.7 |
| State: | 6.5 |
| Here: | 4.3 |
| State: | 4.4 |
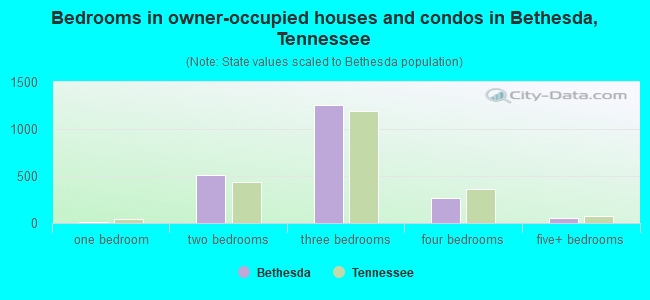
- Bedrooms in owner-occupied houses and condos in Bethesda, Tennessee
- 0no bedroom
- 151 bedroom
- 5122 bedrooms
- 1,2563 bedrooms
- 2714 bedrooms
- 495+ bedrooms
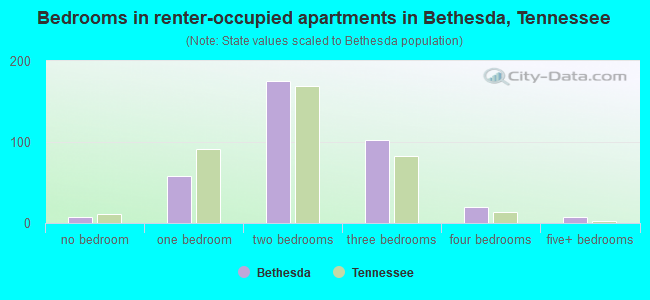
- Bedrooms in renter-occupied apartments in Bethesda, Tennessee
- 8no bedroom
- 581 bedroom
- 1752 bedrooms
- 1033 bedrooms
- 204 bedrooms
- 75+ bedrooms
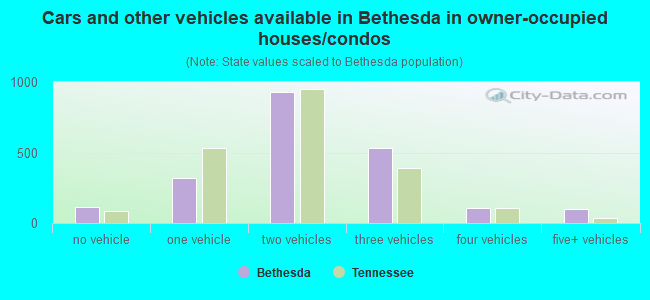
- Cars and other vehicles available in Bethesda in owner-occupied houses/condos
- 111no vehicle
- 3191 vehicle
- 9312 vehicles
- 5343 vehicles
- 1084 vehicles
- 1005+ vehicles
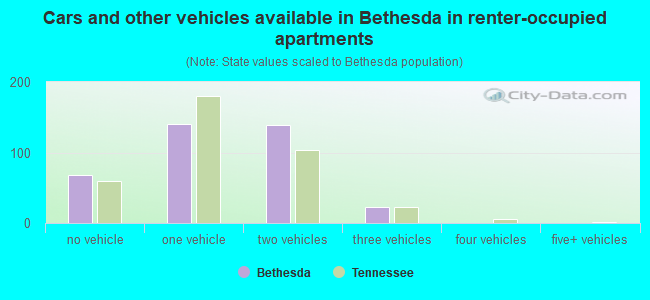
- Cars and other vehicles available in Bethesda in renter-occupied apartments
- 68no vehicle
- 1411 vehicle
- 1392 vehicles
- 233 vehicles
- 04 vehicles
- 05+ vehicles
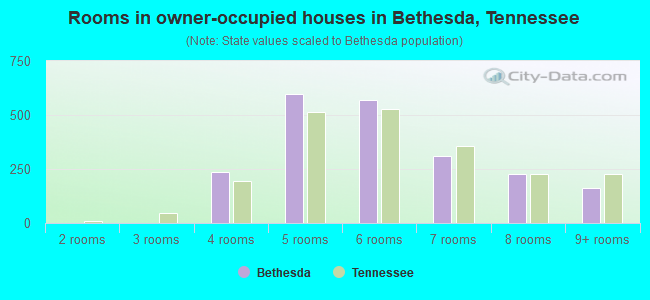
- Rooms in owner-occupied houses in Bethesda, Tennessee
- 01 room
- 02 rooms
- 03 rooms
- 2354 rooms
- 5965 rooms
- 5716 rooms
- 3117 rooms
- 2278 rooms
- 1639+ rooms
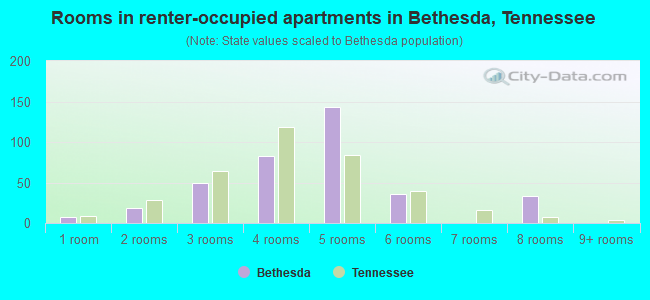
- Rooms in renter-occupied apartments in Bethesda, Tennessee
- 81 room
- 182 rooms
- 503 rooms
- 834 rooms
- 1435 rooms
- 366 rooms
- 07 rooms
- 338 rooms
- 09+ rooms
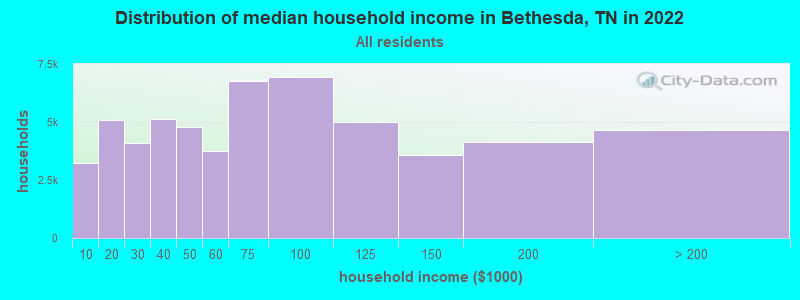
Bethesda, TN household income distribution

- 3,243Less than $10,000
- 5,084$10,000 to $19,999
- 4,082$20,000 to $29,999
- 5,123$30,000 to $39,999
- 4,776$40,000 to $49,999
- 3,769$50,000 to $59,999
- 6,772$60,000 to $74,999
- 6,941$75,000 to $99,999
- 5,002$100,000 to $124,999
- 3,565$125,000 to $149,999
- 4,133$150,000 to $199,999
- 4,666$200,000 or more
Percentage of workers working in this county: 75.3%
Number of people working at home: 322 (9.9% of all workers)
Travel time to work (commute)
- Less than 5 minutes: 39
- 5 to 9 minutes: 135
- 10 to 14 minutes: 296
- 15 to 19 minutes: 459
- 20 to 24 minutes: 700
- 25 to 29 minutes: 258
- 30 to 34 minutes: 548
- 35 to 39 minutes: 70
- 40 to 44 minutes: 104
- 45 to 59 minutes: 105
- 60 to 89 minutes: 52
- 90 or more minutes: 51
Means of transportation to work:
- Drove a car alone: 2,521 (87.6%)
- Carpooled: 267 (9.3%)
- Bus or trolley bus: 4 (0.1%)
- Walked: 7 (0.2%)
- Other means: 18 (0.6%)
- Worked at home: 62 (2.2%)
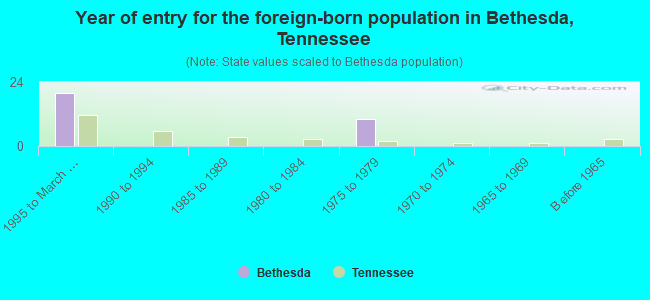
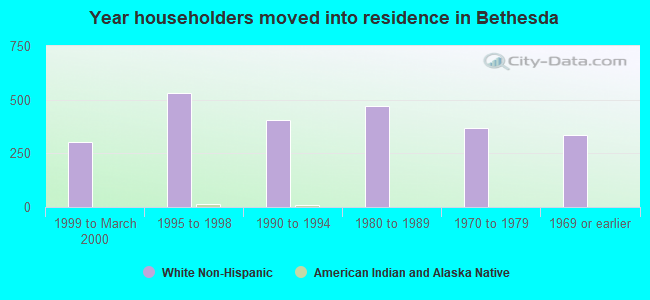
- Year of entry for the foreign-born population in Bethesda, Tennessee
- 201995 to March 2000
- 01990 to 1994
- 01985 to 1989
- 01980 to 1984
- 101975 to 1979
- 01970 to 1974
- 01965 to 1969
- 0Before 1965
Most common places of birth for foreign-born residents (%):
| Bethesda: | 100.0% (30) |
| Tennessee: | 1.1% (1,694) |
Place of birth for U.S.-born residents:
- This state: 4,864
- Other state: 1,264
- Northeast: 121
- Midwest: 299
- South: 696
- West: 148
70% of Bethesda residents lived in the same house 5 years ago.
Out of people who lived in different houses, 64% lived in this county.
Out of people who lived in different counties, 69% lived in Tennessee.
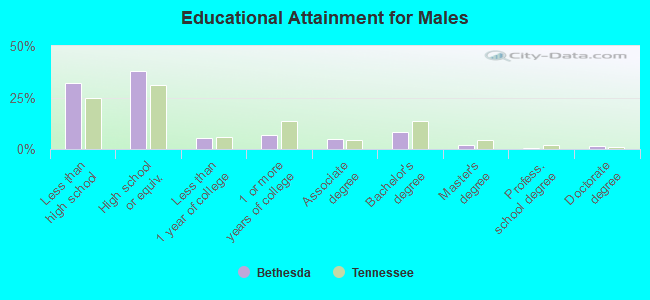
Education attainment for males 25 years and older:
- No schooling: 55
- Nursery to 4th grade: 21
- 5th and 6th grade: 50
- 7th and 8th grade: 95
- 9th grade: 105
- 10th grade: 148
- 11th grade: 109
- 12th grade, no diploma: 104
- High school graduate (or equivalency): 811
- Less than 1 year of college: 113
- Some college more than 1 year, no degree: 150
- Associate degree: 103
- Bachelor's degree: 181
- Master's degree: 41
- Professional school degree: 13
- Doctorate degree: 34
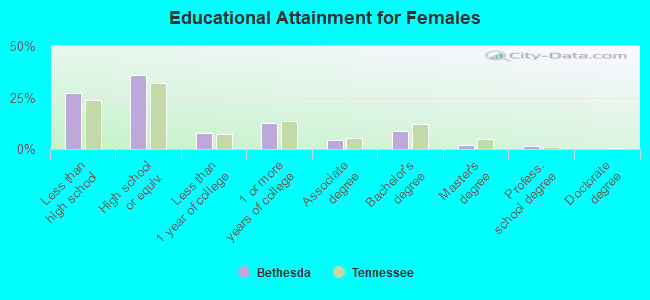
Education attainment for females 25 years and older:
- No schooling: 18
- Nursery to 4th grade: 0
- 5th and 6th grade: 66
- 7th and 8th grade: 126
- 9th grade: 102
- 10th grade: 98
- 11th grade: 117
- 12th grade, no diploma: 66
- High school graduate (or equivalency): 788
- Less than 1 year of college: 174
- Some college more than 1 year, no degree: 279
- Associate degree: 99
- Bachelor's degree: 190
- Master's degree: 47
- Professional school degree: 30
- Doctorate degree: 0


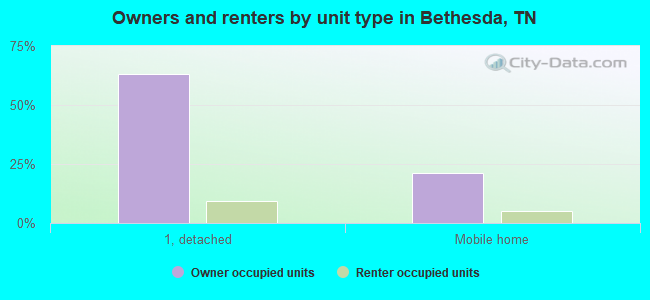
Housing units in structures:
- One, detached: 1,913
- One, attached: 9
- Two: 15
- 3 or 4: 31
- 5 to 9: 9
- Mobile homes: 683
Median worth of mobile homes: $97,716
Housing units lacking complete kitchen facilities: 1.2%
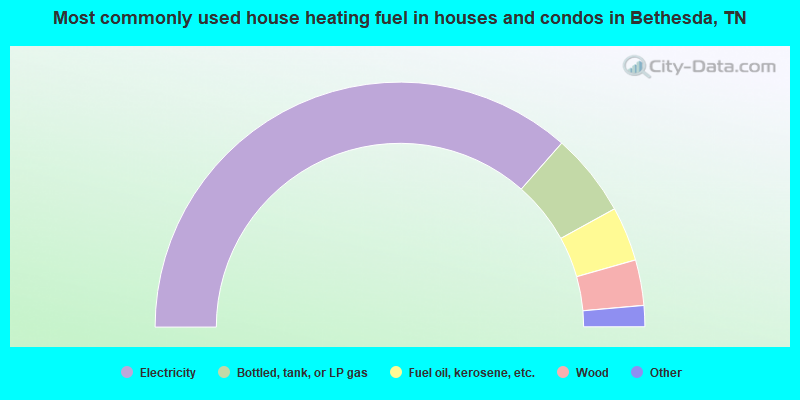
- 72.9%Electricity
- 11.0%Bottled, tank, or LP gas
- 7.2%Fuel oil, kerosene, etc.
- 6.0%Wood
- 2.4%Utility gas
- 0.4%No fuel used
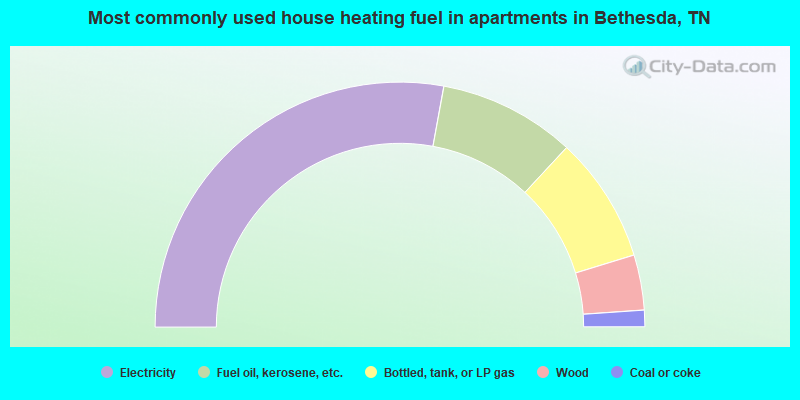
- 55.8%Electricity
- 18.1%Fuel oil, kerosene, etc.
- 16.7%Bottled, tank, or LP gas
- 7.3%Wood
- 2.2%Coal or coke
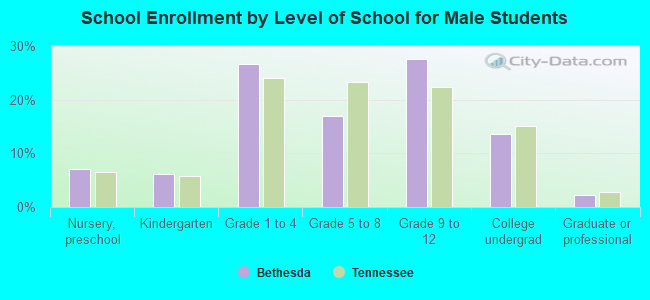
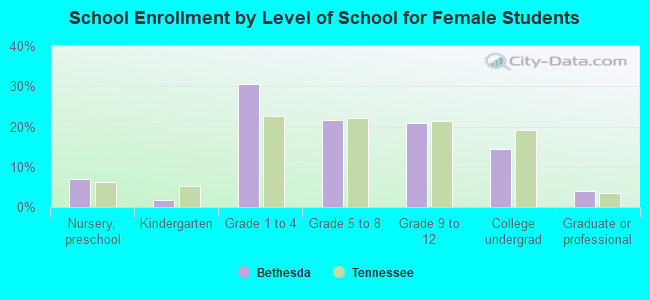
Private vs. public school enrollment:
| Here: | 2.9% |
| Tennessee: | 9.5% |
| Here: | 0.0% |
| Tennessee: | 10.4% |
| Here: | 0.0% |
| Tennessee: | 22.8% |