Races in Bethesda, Tennessee (TN) Detailed Stats
Ancestries, Foreign-born residents, place of birth
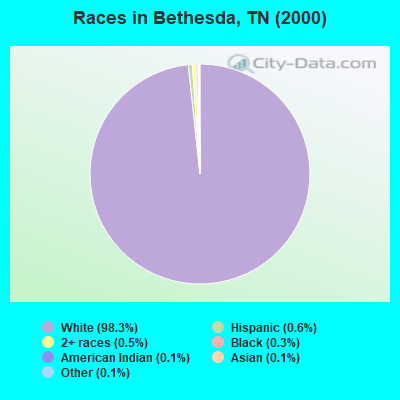
Race distribution in Bethesda

- 6,06298.3%White alone
- 340.6%Hispanic
- 320.5%Two or more races
- 160.3%Black alone
- 80.1%Asian alone
- 70.1%Other race alone
- 90.1%American Indian alone
2000
2022
-
- 4,505,93079.2%White alone
- 928,20416.3%Black alone
- 123,8382.2%Hispanic
- 54,8241.0%Two or more races
- 56,0771.0%Asian alone
- 13,8200.2%American Indian alone
- 4,7800.08%Other race alone
- 1,8100.03%Native Hawaiian and Other
Pacific Islander alone

-
- 5,070,02671.9%White alone
- 1,089,73815.5%Black alone
- 442,6296.3%Hispanic
- 279,3814.0%Two or more races
- 131,8171.9%Asian alone
- 26,9720.4%Other race alone
- 6,3870.09%American Indian alone
- 4,3890.06%Native Hawaiian and Other
Pacific Islander alone

Income and house value in Bethesda
- Median household income in 2022
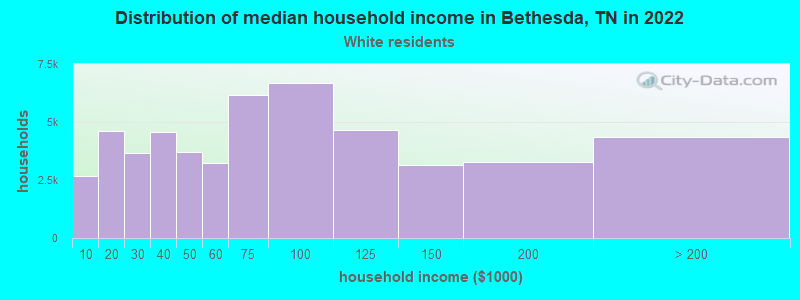
- $67,798White non-Hispanic householders
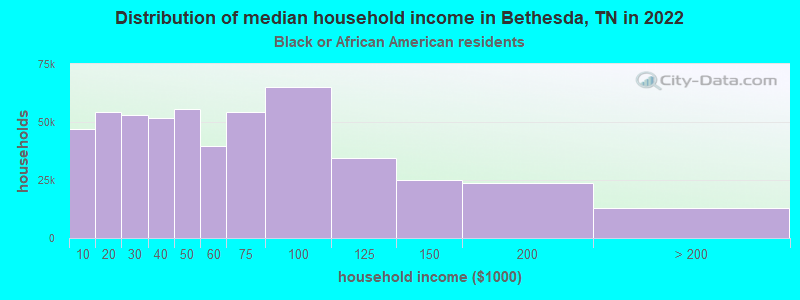
- $96,400Black householders
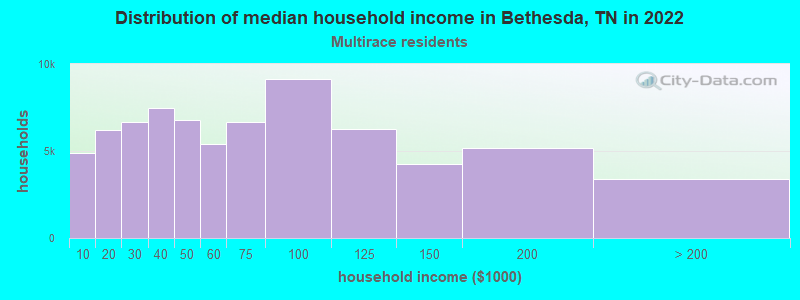
- $49,449Two or more races householders
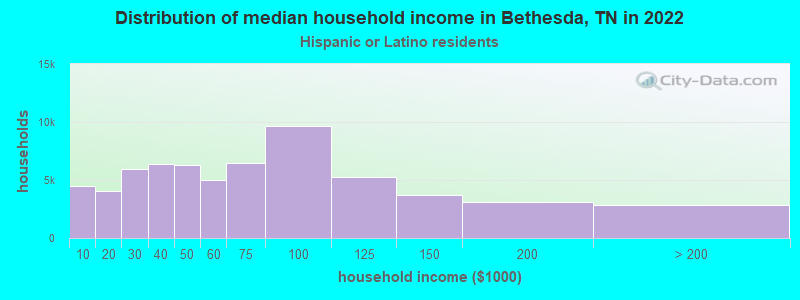
- $105,410Hispanic or Latino race householders
- Median 2022 house value
- $264,311White Non-Hispanic householders
- $156,650Black or African American householders
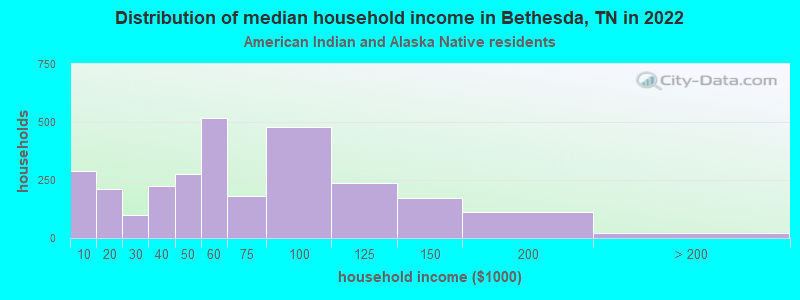
- $996,864American Indian or Alaska Native householders
- $366,846Two or more races householders
- $213,613Hispanic or Latino householders
Household income for White non-Hispanic householders
Household income for Black householders
Household income for American Indian and Alaska Native householders
Household income for Two or more races householders
Household income for Hispanic or Latino race householders
Zip code: 37046