Bend, OR (Oregon) Houses and Residents
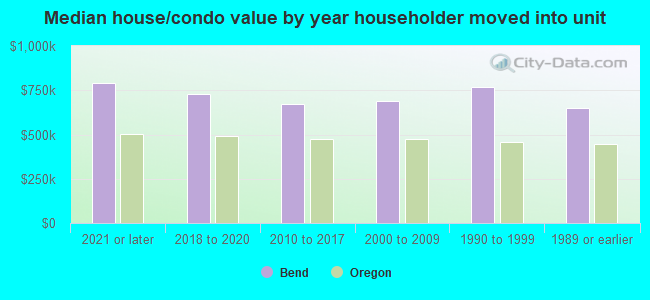
| Bend: | $709,100 |
| Oregon: | $475,600 |
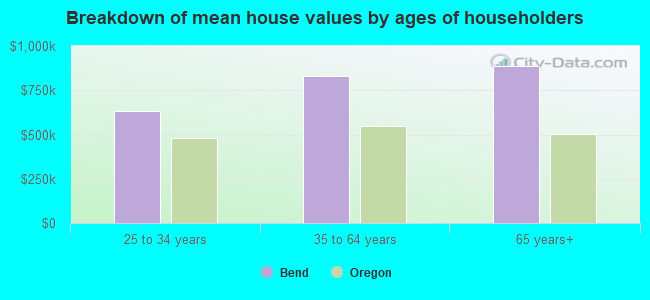
Mean price in 2022:
Detached houses: $628,950
Here: $628,950 State: $562,872 Townhouses or other attached units: $513,896
Here: $513,896 State: $463,029 In 2-unit structures: $356,587
Here: $356,587 State: $505,105 In 3-to-4-unit structures: $510,219
Here: $510,219 State: $419,673 In 5-or-more-unit structures: $633,092
Here: $633,092 State: $420,389 Mobile homes: $138,582
Here: $138,582 State: $214,044
Total population: 84,080 (Urban population: 50,706, Rural population: 1,102 (all nonfarm))
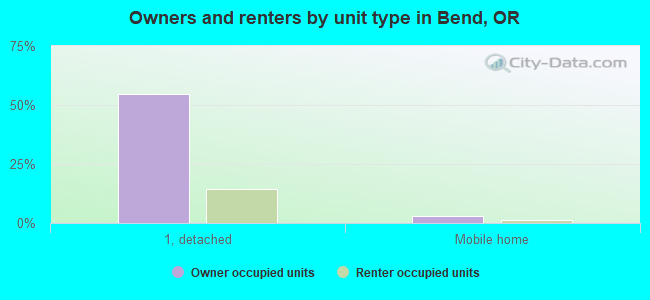
Houses: 47,631 (43,897 occupied: 26,827 owner occupied, 17,070 renter occupied)
| % of renters here: | 39% |
| State: | 37% |
Housing density: 1,487 houses/condos per square mile
Median price asked for vacant for-sale houses and condos in 2022: $1,146,015.
Median contract rent in 2022: $1,598 (lower quartile is $1,165, upper quartile is over $2,000)
Median rent asked for vacant for-rent units in 2022: $2,461
Median gross rent in Bend, OR in 2022: $1,768
Housing units in Bend with a mortgage: 17,751 (1,728 second mortgage, 0 home equity loan, 1,630 both second mortgage and home equity loan)
Houses without a mortgage: 523
Median household income for houses/condos with a mortgage: $121,022
Median household income for apartments without a mortgage: $95,437
Median monthly housing costs: $1,742
Compare current foreclosures in Bend, OR:
| Photo | Address | Area | Beds / Baths | Price | Details |
|---|---|---|---|---|---|

|
#1
Oakview Dr
Bend, OR 97701
|
2,040 sq. feet
|
2 baths 3 beds |
show details | |

|
#2
Wood Duck Dr
Bend, OR 97707
|
2,440 sq. feet
|
2 baths 4 beds |
show details | |

|
#3
SE Ironwood Ct
Bend, OR 97702
|
1,663 sq. feet
|
2 baths 3 beds |
show details | |

|
#4
Nisika Ct
Bend, OR 97702
|
1,956 sq. feet
|
2 baths 3 beds |
show details | |

|
#5
Neff Rd
Bend, OR 97701
|
1,680 sq. feet
|
2 baths 3 beds |
show details | |

|
#6
Spinnaker St
Bend, OR 97701
|
1,316 sq. feet
|
2 baths 3 beds |
show details | |

|
#7
NE Daggett Ln
Bend, OR 97701
|
1,112 sq. feet
|
2 baths 3 beds |
show details | |

|
#8
Prong Horn Dr
Bend, OR 97707
|
1,512 sq. feet
|
2 baths 3 beds |
show details | |

|
#9
Obsidian Rd
Bend, OR 97702
|
1,620 sq. feet
|
2 baths 3 beds |
show details | |

|
#10
NE Wells Acres Rd
Bend, OR 97701
|
1,488 sq. feet
|
2 baths 3 beds |
show details |
| Photo | Address | Area | Beds / Baths | Price | Details |
|---|---|---|---|---|---|

|
#11
Cinder Butte Rd
Bend, OR 97702
|
1,368 sq. feet
|
2 baths 2 beds |
show details | |

|
#12
Cinder Butte Rd
Bend, OR 97702
|
1,368 sq. feet
|
2 baths 3 beds |
show details | |

|
#13
Honeysuckle Ln
Bend, OR 97702
|
1,064 sq. feet
|
2 baths 3 beds |
show details | |

|
#14
Salmonberry Ct
Bend, OR 97702
|
1,596 sq. feet
|
2 baths 3 beds |
show details | |

|
#15
Cinder Butte Rd
Bend, OR 97702
|
968 sq. feet
|
1 baths 2 beds |
show details | |

|
#16
Hitching Post Ln
Bend, OR 97702
|
1,916 sq. feet
|
2 baths 3 beds |
show details | |

|
#17
SE Ramsay Rd
Bend, OR 97702
|
1,120 sq. feet
|
1 baths 3 beds |
show details | |

|
#18
Mayfield Dr
Bend, OR 97707
|
1,296 sq. feet
|
2 baths 3 beds |
show details | |

|
#19
Baker Rd
Bend, OR 97702
|
2,456 sq. feet
|
2 baths 3 beds |
show details | |

|
#20
Shahala Ct
Bend, OR 97702
|
1,416 sq. feet
|
2 baths 3 beds |
show details |
| Photo | Address | Area | Beds / Baths | Price | Details |
|---|---|---|---|---|---|

|
#21
Cinder Butte Rd
Bend, OR 97702
|
1,296 sq. feet
|
2 baths 3 beds |
show details | |

|
#22
NE Altura Dr
Bend, OR 97701
|
2,216 sq. feet
|
2 baths 4 beds |
show details | |

|
#23
NE Keats Dr
Bend, OR 97701
|
2,324 sq. feet
|
2 baths 3 beds |
show details | |

|
#24
Sierra Dr
Bend, OR 97701
|
2,059 sq. feet
|
2 baths 4 beds |
show details | |

|
#25
High Desert Ln
Bend, OR 97701
|
1,006 sq. feet
|
2 baths 3 beds |
show details | |

|
#26
Rock Bluff Cir
Bend, OR 97702
|
2,098 sq. feet
|
3 baths 5 beds |
show details | |

|
#27
Cirrus Ct
Bend, OR 97702
|
2,218 sq. feet
|
2 baths 3 beds |
show details | |

|
#28
Borden Dr
Bend, OR 97702
|
1,461 sq. feet
|
2 baths 3 beds |
show details | |

|
#29
Spinnaker St
Bend, OR 97701
|
1,825 sq. feet
|
2 baths 4 beds |
show details | |

|
#30
Indian Summer Rd
Bend, OR 97702
|
2,080 sq. feet
|
2 baths 3 beds |
show details |
| Photo | Address | Area | Beds / Baths | Price | Details |
|---|---|---|---|---|---|

|
#31
Clairaway Ave
Bend, OR 97702
|
2,980 sq. feet
|
3 baths 5 beds |
show details | |

|
#32
Snow Peaks Dr
Bend, OR 97701
|
1,796 sq. feet
|
2 baths 3 beds |
show details | |

|
#33
Greenmont Dr
Bend, OR 97702
|
2,120 sq. feet
|
3 baths 3 beds |
show details | |

|
#34
Pecoraro Loop
Bend, OR 97701
|
1,768 sq. feet
|
2 baths 3 beds |
show details | |

|
#35
Eastview Dr
Bend, OR 97701
|
1,186 sq. feet
|
1 baths 4 beds |
show details | |

|
#36
Brentwood Ave
Bend, OR 97702
|
1,940 sq. feet
|
2 baths 3 beds |
show details | |

|
#37
Gallop Rd
Bend, OR 97701
|
1,307 sq. feet
|
2 baths 3 beds |
show details | |

|
#38
NE Tombstone Way
Bend, OR 97701
|
1,249 sq. feet
|
2 baths 3 beds |
show details | |

|
#39
NE Mark Ct
Bend, OR 97701
|
1,262 sq. feet
|
2 baths 3 beds |
show details | |

|
#40
Limelight Dr Unit 421
Bend, OR 97702
|
1,440 sq. feet
|
2 baths 3 beds |
show details |
| Photo | Address | Area | Beds / Baths | Price | Details |
|---|---|---|---|---|---|

|
#41
Gross Dr
Bend, OR 97707
|
1,260 sq. feet
|
2 baths 3 beds |
show details | |

|
#42
Calgary Dr
Bend, OR 97702
|
1,584 sq. feet
|
3 baths 3 beds |
show details | |

|
#43
Huntington Rd
Bend, OR 97707
|
840 sq. feet
|
1 baths 2 beds |
show details | |

|
#44
Alderwood Cir
Bend, OR 97702
|
982 sq. feet
|
1 baths 3 beds |
show details | |

|
#45
Kiowa Rd
Bend, OR 97702
|
1,972 sq. feet
|
2 baths 3 beds |
show details | |

|
#46
NE 10th St
Bend, OR 97701
|
1,050 sq. feet
|
2 baths 3 beds |
show details | |

|
#47
Choctaw Rd
Bend, OR 97702
|
1,920 sq. feet
|
2 baths 3 beds |
show details | |

|
#48
Parr Ln
Bend, OR 97702
|
2,574 sq. feet
|
3 baths 4 beds |
show details | |

|
#49
NW Newport Ave
Bend, OR 97701
|
- sq. feet
|
- baths - beds |
show details | |

|
Check over 1 million property listings on Foreclosure.com!
|
browse all offers | |||

Latest news about housing in Bend, OR collected exclusively by city-data.com from local newspapers, TV, and radio stations

 | Tiny Homes in Bend (1 reply) |
| How's the condo rental market? (3 replies) |
| Are there homes for RENT available in Bend? (3 replies) |
| Bend Median Home Price Record (2 replies) |
| Need help renter/legal question Bend. (11 replies) |
| 99% chance of relocating to Bend(area options for housing) (41 replies) |

Median year apartment built: 1999
Household type by relationship:
Households: 103,263- Male householders: 21,047 (6,026 living alone), Female householders: 22,850 (6,430 living alone)
21,244 spouses (21,031 opposite-sex spouses), 5,091 unmarried partners, (4,943 opposite-sex unmarried partners), 23,138 children (21,940 natural, 374 adopted, 824 stepchildren), 818 grandchildren, 1,394 brothers or sisters, 1,748 parents, 0 foster children, 165 other relatives, 5,007 non-relatives
- In group quarters: 761
Size of family households: 12,832 2-persons, 6,547 3-persons, 5,692 4-persons, 673 5-persons, 287 7-or-more-persons.
Size of nonfamily households: 12,456 1-person, 4,407 2-persons, 586 3-persons, 417 4-persons.
14,407 married couples with children.
3,610 single-parent households (722 men, 2,888 women).
91.4% of residents of Bend speak English at home.
5.6% of residents speak Spanish at home (71% speak English very well, 22% speak English well, 6% speak English not well, 1% don't speak English at all).
1.6% of residents speak other Indo-European language at home (85% speak English very well, 13% speak English well, 2% speak English not well).
1.1% of residents speak Asian or Pacific Island language at home (75% speak English very well, 16% speak English well, 9% speak English not well).
0.2% of residents speak other language at home (100% speak English very well).
Foreign born population: 5,047 (4.9%)
(43.5% of them are naturalized citizens)
| Here: | 6.0 |
| State: | 6.2 |
| Here: | 4.2 |
| State: | 4.0 |
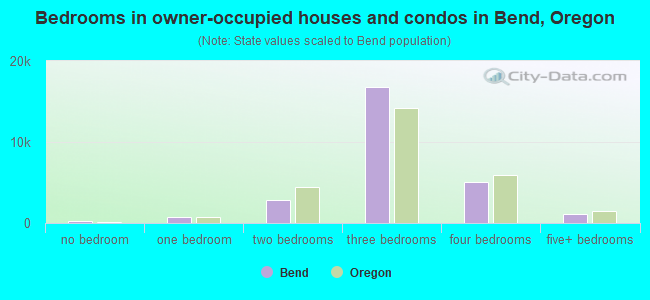
- Bedrooms in owner-occupied houses and condos in Bend, Oregon
- 227no bedroom
- 7381 bedroom
- 2,7982 bedrooms
- 16,8223 bedrooms
- 5,0854 bedrooms
- 1,1575+ bedrooms
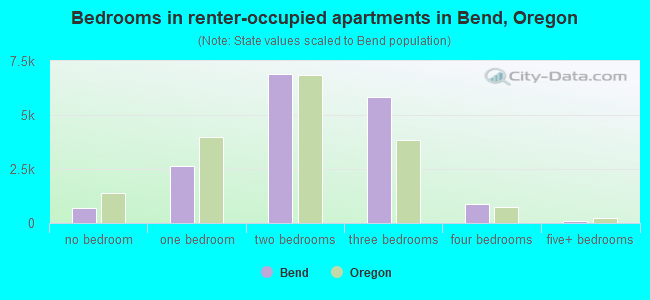
- Bedrooms in renter-occupied apartments in Bend, Oregon
- 696no bedroom
- 2,6441 bedroom
- 6,9042 bedrooms
- 5,8503 bedrooms
- 8694 bedrooms
- 1075+ bedrooms
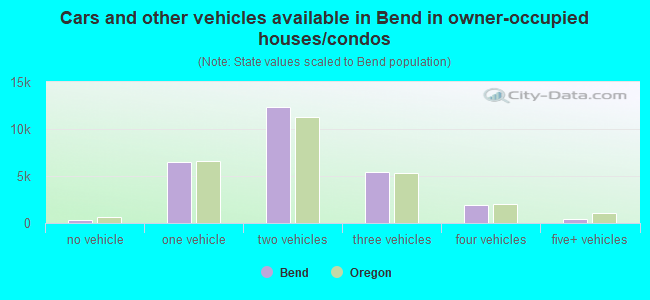
- Cars and other vehicles available in Bend in owner-occupied houses/condos
- 372no vehicle
- 6,4411 vehicle
- 12,3432 vehicles
- 5,4203 vehicles
- 1,8724 vehicles
- 3795+ vehicles
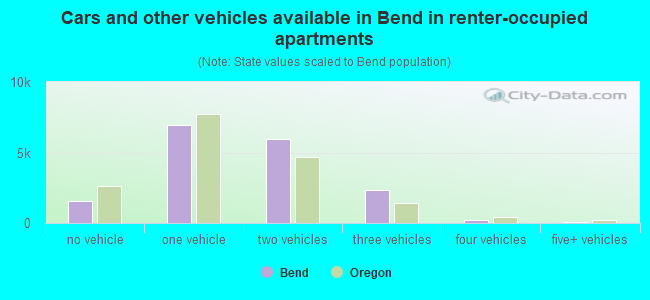
- Cars and other vehicles available in Bend in renter-occupied apartments
- 1,589no vehicle
- 6,9571 vehicle
- 5,9702 vehicles
- 2,3223 vehicles
- 1884 vehicles
- 445+ vehicles
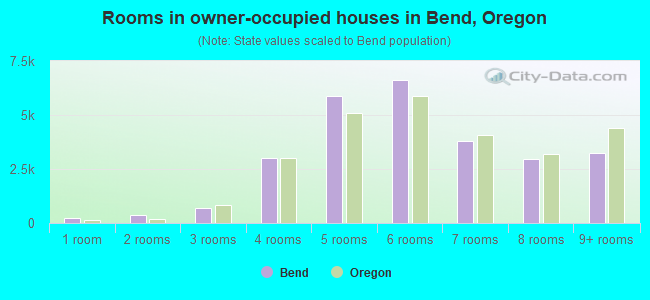
- Rooms in owner-occupied houses in Bend, Oregon
- 2271 room
- 3832 rooms
- 6983 rooms
- 3,0324 rooms
- 5,8935 rooms
- 6,6096 rooms
- 3,7807 rooms
- 2,9678 rooms
- 3,2389+ rooms
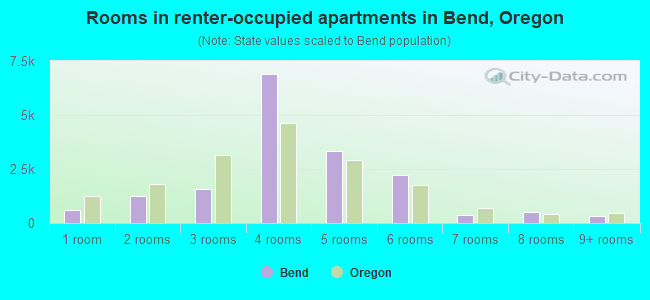
- Rooms in renter-occupied apartments in Bend, Oregon
- 6051 room
- 1,2332 rooms
- 1,5843 rooms
- 6,9034 rooms
- 3,3415 rooms
- 2,2096 rooms
- 3747 rooms
- 5018 rooms
- 3209+ rooms
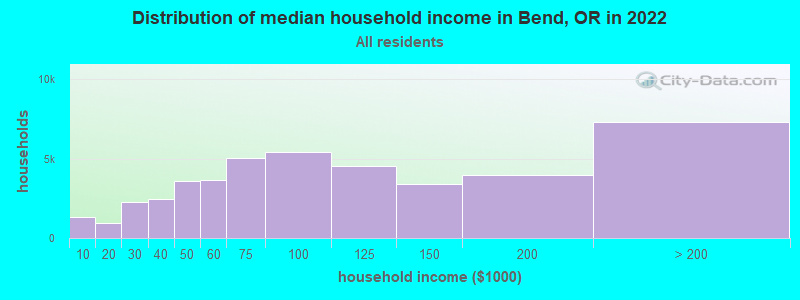
Bend, OR household income distribution

- 1,333Less than $10,000
- 977$10,000 to $19,999
- 2,239$20,000 to $29,999
- 2,451$30,000 to $39,999
- 3,596$40,000 to $49,999
- 3,681$50,000 to $59,999
- 5,012$60,000 to $74,999
- 5,418$75,000 to $99,999
- 4,510$100,000 to $124,999
- 3,398$125,000 to $149,999
- 3,970$150,000 to $199,999
- 7,312$200,000 or more
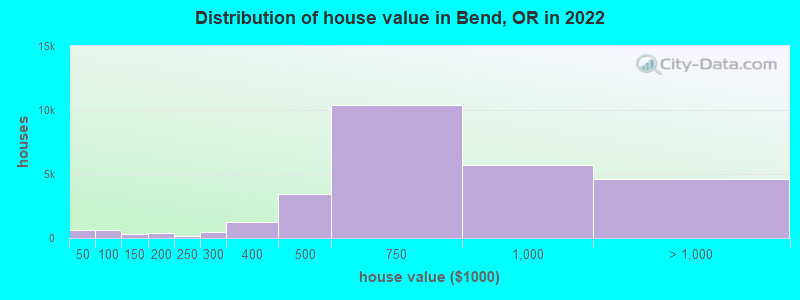
Home value of owner - occupied houses in 2022 in Bend, OR
-
- 322Less than $10,000
- 25$15,000 to $19,999
- 31$20,000 to $24,999
- 52$25,000 to $29,999
- 50$30,000 to $34,999
- 174$40,000 to $49,999
- 80$50,000 to $59,999
- 62$60,000 to $69,999
- 88$70,000 to $79,999
- 173$80,000 to $89,999
- 41$90,000 to $99,999
- 267$100,000 to $124,999
- 47$125,000 to $149,999
- 207$150,000 to $174,999
- 218$175,000 to $199,999
- 158$200,000 to $249,999
- 451$250,000 to $299,999
- 1,224$300,000 to $399,999
- 3,431$400,000 to $499,999
- 10,429$500,000 to $749,999
- 5,728$750,000 to $999,999
- 3,183$1,000,000 to $1,499,999
- 756$1,500,000 to $1,999,999
- 670$2,000,000 or more
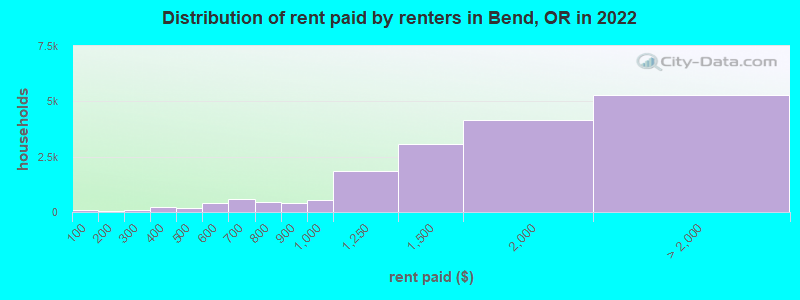
Rent paid by renters in 2022 in Bend, OR
-
- 94Less than $100
- 43$150 to $199
- 13$200 to $249
- 65$250 to $299
- 116$300 to $349
- 110$350 to $399
- 65$400 to $449
- 127$450 to $499
- 257$500 to $549
- 153$550 to $599
- 315$600 to $649
- 264$650 to $699
- 195$700 to $749
- 246$750 to $799
- 418$800 to $899
- 557$900 to $999
- 1,841$1,000 to $1,249
- 3,085$1,250 to $1,499
- 4,136$1,500 to $1,999
- 2,295$2,000 to $2,499
- 1,042$2,500 to $2,999
- 367$3,000 to $3,499
- 784$3,500 or more
- 776No cash rent
Percentage of workers working in this county: 97.5%
Number of people working at home: 14,249 (25.7% of all workers)
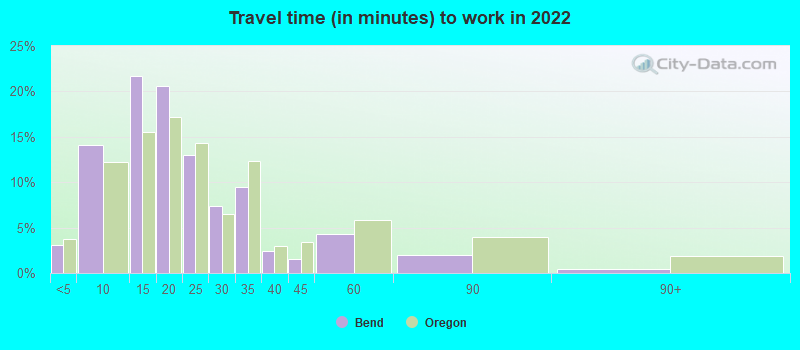
Travel time to work (commute)
- Less than 5 minutes: 1,363
- 5 to 9 minutes: 7,696
- 10 to 14 minutes: 10,575
- 15 to 19 minutes: 9,904
- 20 to 24 minutes: 4,046
- 25 to 29 minutes: 2,545
- 30 to 34 minutes: 2,833
- 35 to 39 minutes: 888
- 40 to 44 minutes: 666
- 45 to 59 minutes: 1,267
- 60 to 89 minutes: 498
- 90 or more minutes: 155
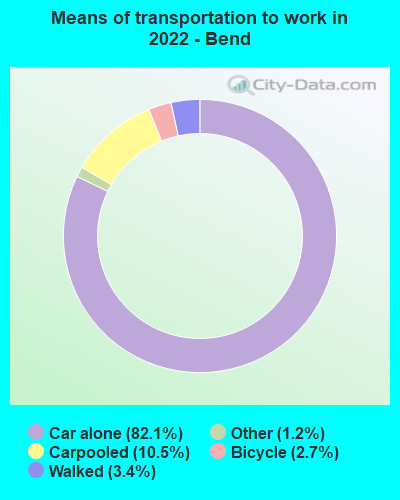
Means of transportation to work:
- Drove a car alone: 42,315 (64.5%)
- Carpooled: 5,436 (8.3%)
- Bus: 14 (0.0%)
- Taxi: 627 (1.0%)
- Bicycle: 1,409 (2.1%)
- Walked: 1,756 (2.7%)
- Worked at home: 14,002 (21.4%)
- Unemployment by race in 2022
- Unemployment rate for White non-Hispanic residents
- 3.4%Males
- 1.9%Females
- Unemployment rate for Black residents
- 28.9%Males
- Unemployment rate for Asian residents
- 0.6%Females
- Unemployment rate for other race residents
- 3.8%Females
- Unemployment rate for two or more race residents
- 4.2%Females
- Unemployment rate for Hispanic or Latino residents
- 1.0%Males
- 4.9%Females
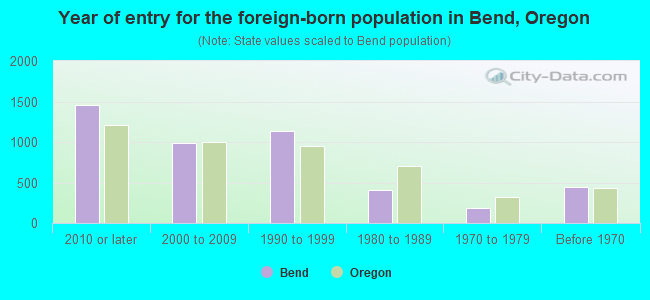
- Year of entry for the foreign-born population in Bend, Oregon
- 1,4562010 or later
- 9872000 to 2009
- 1,1341990 to 1999
- 4051980 to 1989
- 1801970 to 1979
- 449Before 1970
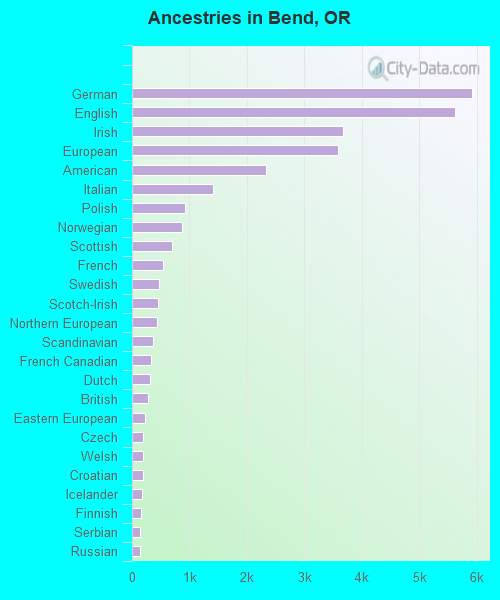
First ancestries reported:
- German: 5,921 (13.8%)
- English: 5,626 (13.1%)
- Irish: 3,673 (8.6%)
- European: 3,592 (8.4%)
- American: 2,329 (5.4%)
- Italian: 1,415 (3.3%)
- Polish: 920 (2.1%)
- Norwegian: 870 (2.0%)
- Scottish: 694 (1.6%)
- French: 533 (1.2%)
- Swedish: 475 (1.1%)
- Scotch-Irish: 458 (1.1%)
- Northern European: 430 (1.0%)
- Scandinavian: 359 (0.8%)
- French Canadian: 326 (0.8%)
- Dutch: 307 (0.7%)
- British: 281 (0.7%)
- Eastern European: 224 (0.5%)
- Czech: 192 (0.4%)
- Welsh: 192 (0.4%)
- Croatian: 188 (0.4%)
- Icelander: 176 (0.4%)
- Finnish: 158 (0.4%)
- Serbian: 144 (0.3%)
- Russian: 141 (0.3%)
- Danish: 138 (0.3%)
- Canadian: 122 (0.3%)
- Hungarian: 115 (0.3%)
- Lebanese: 108 (0.3%)
- Greek: 90 (0.2%)
- Romanian: 70 (0.2%)
- Slovak: 49 (0.1%)
- Basque: 42 (0.10%)
- Lithuanian: 40 (0.09%)
- Nigerian: 40 (0.09%)
- Slovene: 30 (0.07%)
- Iranian: 28 (0.07%)
- Yugoslavian: 28 (0.07%)
- Latvian: 27 (0.06%)
- Austrian: 24 (0.06%)
- Cajun: 23 (0.05%)
- Slavic: 22 (0.05%)
- Palestinian: 20 (0.05%)
- Ethiopian: 19 (0.04%)
- Swiss: 16 (0.04%)
- Portuguese: 11 (0.03%)
- Brazilian: 9 (0.02%)
- Israeli: 6 (0.01%)
- African: 3 (0.01%)
Most common places of birth for foreign-born residents (%):
| Bend: | 35.8% (1,895) |
| Oregon: | 33.9% (140,109) |
| Bend: | 8.9% (471) |
| Oregon: | 1.0% (4,175) |
| Bend: | 6.7% (354) |
| Oregon: | 3.7% (15,229) |
| Bend: | 4.3% (227) |
| Oregon: | 0.7% (2,761) |
| Bend: | 4.2% (224) |
| Oregon: | 3.5% (14,530) |
| Bend: | 4.1% (218) |
| Oregon: | 5.2% (21,429) |
| Bend: | 3.8% (204) |
| Oregon: | 5.5% (22,563) |
| Bend: | 3.8% (201) |
| Oregon: | 1.2% (5,082) |
| Bend: | 2.9% (153) |
| Oregon: | 1.9% (8,005) |
| Bend: | 2.4% (127) |
| Oregon: | 2.8% (11,450) |
| Bend: | 2.0% (104) |
| Oregon: | 0.2% (931) |
| Bend: | 1.5% (81) |
| Oregon: | 1.5% (6,313) |
Place of birth for U.S.-born residents:
- This state: 37,282
- Other state: 59,310
- Northeast: 6,070
- Midwest: 9,898
- South: 7,870
- West: 35,472
82.7% of Bend residents lived in the same house 1 years ago.
Out of people who lived in different houses, 31.3% lived in this county.
Out of people who lived in different counties, 46.6% lived in Oregon.
| Bend: | 82.7% |
| State average: | 85.5% |
Education attainment for males 25 years and older:
- No schooling: 55
- Nursery to 4th grade: 0
- 5th and 6th grade: 531
- 7th and 8th grade: 96
- 9th grade: 0
- 10th grade: 98
- 11th grade: 195
- 12th grade, no diploma: 357
- High school graduate (or equivalency): 5,451
- Less than 1 year of college: 2,452
- Some college more than 1 year, no degree: 5,431
- Associate degree: 3,763
- Bachelor's degree: 11,717
- Master's degree: 4,460
- Professional school degree: 1,440
- Doctorate degree: 1,168

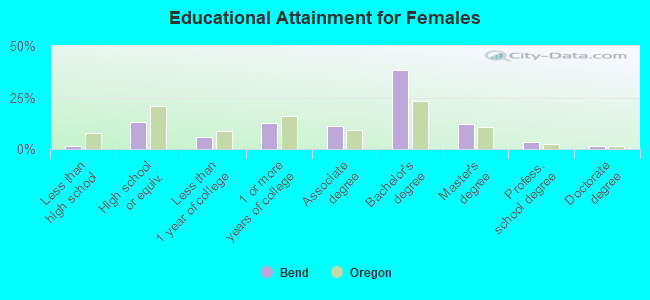
Education attainment for females 25 years and older:
- No schooling: 71
- Nursery to 4th grade: 190
- 5th and 6th grade: 0
- 7th and 8th grade: 0
- 9th grade: 40
- 10th grade: 13
- 11th grade: 153
- 12th grade, no diploma: 72
- High school graduate (or equivalency): 5,002
- Less than 1 year of college: 2,218
- Some college more than 1 year, no degree: 4,816
- Associate degree: 4,262
- Bachelor's degree: 14,498
- Master's degree: 4,608
- Professional school degree: 1,373
- Doctorate degree: 550


Housing units in structures:
- One, detached: 34,838
- One, attached: 2,108
- Two: 1,055
- 3 or 4: 2,562
- 5 to 9: 1,277
- 10 to 19: 966
- 20 to 49: 921
- 50 or more: 2,425
- Mobile homes: 796
- Boats, RVs, vans, etc.: 683
Median worth of mobile homes: $79,100
Housing units lacking complete kitchen facilities in 2022: 1.6%
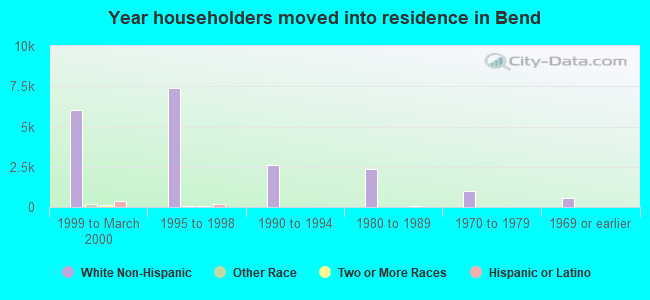
House/condo owner moved in on average 7 years ago
Renter moved in on average 1 years ago
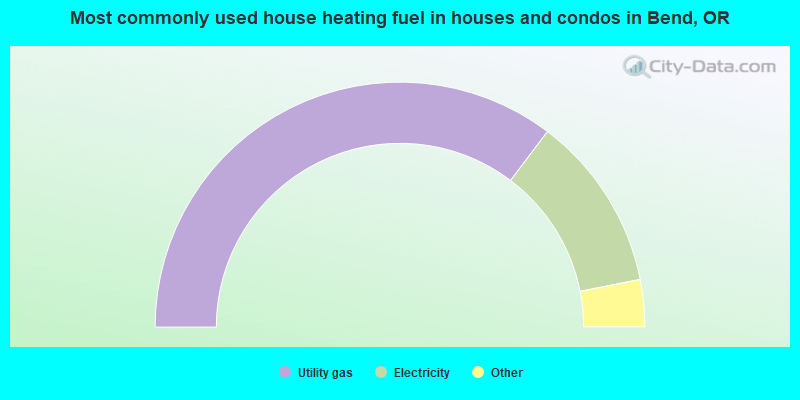
- 70.6%Utility gas
- 23.2%Electricity
- 3.4%Wood
- 1.4%Bottled, tank, or LP gas
- 0.7%Other fuel
- 0.3%Fuel oil, kerosene, etc.
- 0.3%Solar energy
- 0.2%No fuel used
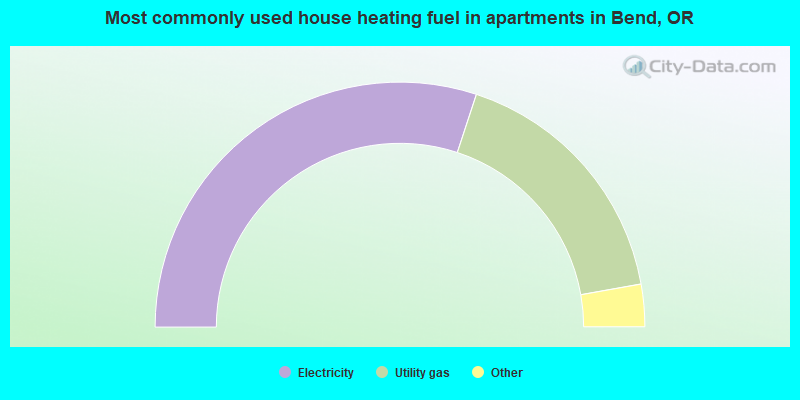
- 60.1%Electricity
- 34.3%Utility gas
- 2.6%Wood
- 1.9%Bottled, tank, or LP gas
- 0.5%Fuel oil, kerosene, etc.
- 0.5%No fuel used
- 0.1%Solar energy
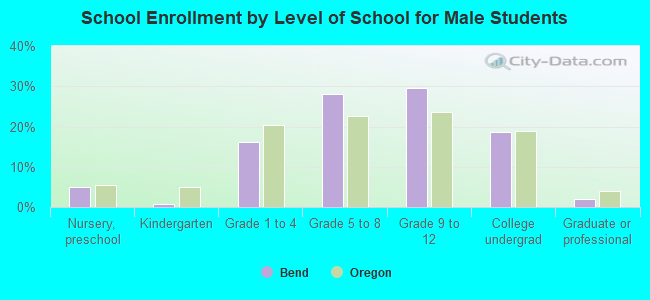
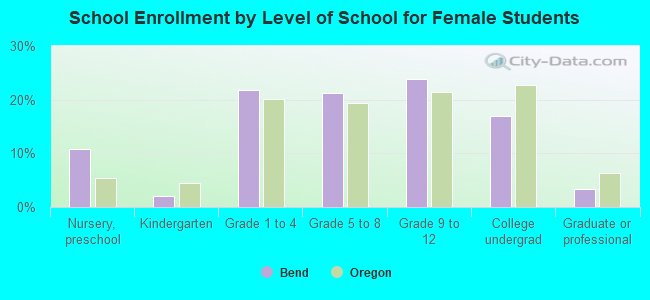
Private vs. public school enrollment:
| Here: | 16.4% |
| Oregon: | 13.7% |
| Here: | 2.4% |
| Oregon: | 8.8% |
| Here: | 22.5% |
| Oregon: | 17.7% |