Races in Bend, Oregon (OR) Detailed Stats
Data:
Races - White alone (%)
Races - White alone (% change since 2000)
Races - Black alone (%)
Races - Black alone (% change since 2000)
Races - American Indian alone (%)
Races - American Indian alone (% change since 2000)
Races - Asian alone (%)
Races - Asian alone (% change since 2000)
Races - Hispanic (%)
Races - Hispanic (% change since 2000)
Races - Native Hawaiian and Other Pacific Islander alone (%)
Races - Native Hawaiian and Other Pacific Islander alone (% change since 2000)
Races - Two or more races(%)
Races - Two or more races(% change since 2000)
Races - Other race alone (%)
Races - Other race alone (% change since 2000)
Racial diversity
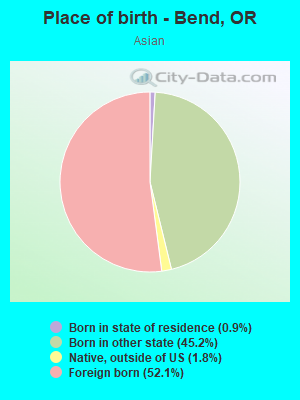
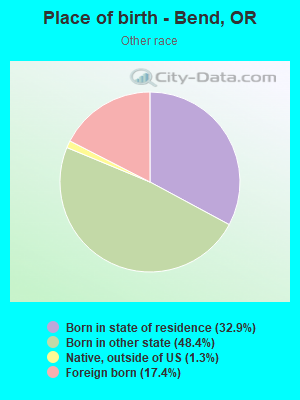
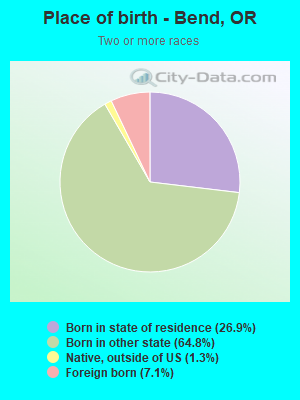
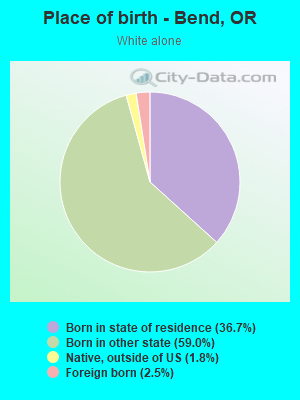
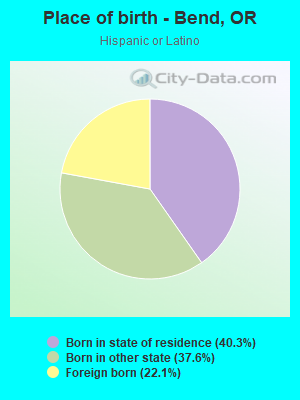
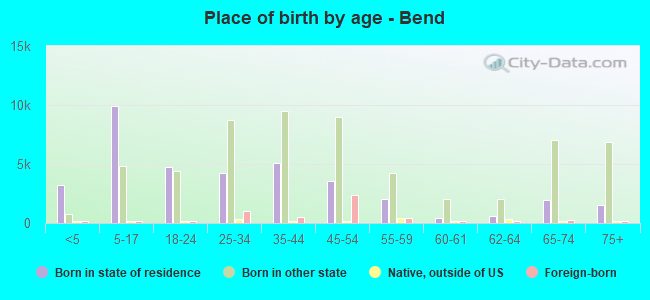
Place of birth - Born in state of residence (%)
Place of birth - Born in state of residence (%) - White
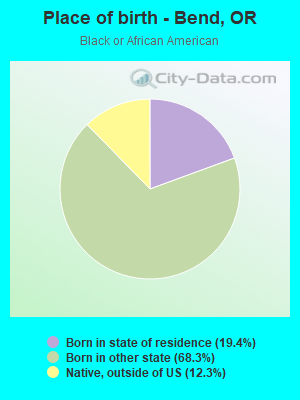
Place of birth - Born in state of residence (%) - Black or African American
Place of birth - Born in state of residence (%) - Asian
Place of birth - Born in state of residence (%) - Hispanic or Latino
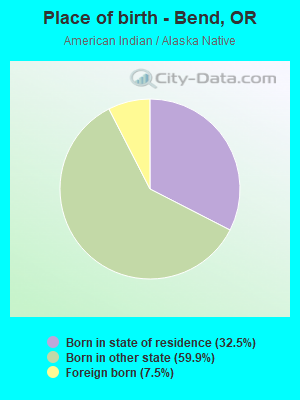
Place of birth - Born in state of residence (%) - American Indian and Alaska Native
Place of birth - Born in state of residence (%) - Multirace
Place of birth - Born in state of residence (%) - Other Race
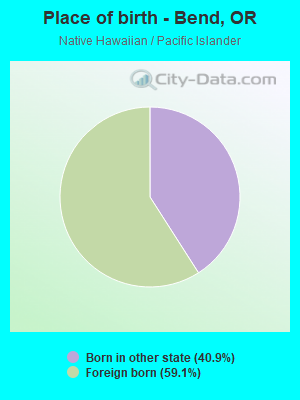
Place of birth - Born in other state (%)
Place of birth - Born in other state (%) - White
Place of birth - Born in other state (%) - Black or African American
Place of birth - Born in other state (%) - Asian
Place of birth - Born in other state (%) - Hispanic or Latino
Place of birth - Born in other state (%) - American Indian and Alaska Native
Place of birth - Born in other state (%) - Multirace
Place of birth - Born in other state (%) - Other Race
Place of birth - Native, outside of US (%)
Place of birth - Native, outside of US (%) - White
Place of birth - Native, outside of US (%) - Black or African American
Place of birth - Native, outside of US (%) - Asian
Place of birth - Native, outside of US (%) - Hispanic or Latino
Place of birth - Native, outside of US (%) - American Indian and Alaska Native
Place of birth - Native, outside of US (%) - Multirace
Place of birth - Native, outside of US (%) - Other Race
Place of birth - Foreign born (%)
Place of birth - Foreign born (%) - White
Place of birth - Foreign born (%) - Black or African American
Place of birth - Foreign born (%) - Asian
Place of birth - Foreign born (%) - Hispanic or Latino
Place of birth - Foreign born (%) - American Indian and Alaska Native
Place of birth - Foreign born (%) - Multirace
Place of birth - Foreign born (%) - Other Race
Residents speaking English at home (%)
Residents speaking English at home - Born in the United States (%)
Residents speaking English at home - Native, born elsewhere (%)
Residents speaking English at home - Foreign born (%)
Residents speaking Spanish at home (%)
Residents speaking Spanish at home - Born in the United States (%)
Residents speaking Spanish at home - Native, born elsewhere (%)
Residents speaking Spanish at home - Foreign born (%)
Residents speaking other language at home (%)
Residents speaking other language at home - Born in the United States (%)
Residents speaking other language at home - Native, born elsewhere (%)
Residents speaking other language at home - Foreign born (%)
Marital status - Never married (%)
Marital status - Now married (%)
Marital status - Separated (%)
Marital status - Widowed (%)
Marital status - Divorced (%)
Ancestries Reported - Arab (%)
Ancestries Reported - Czech (%)
Ancestries Reported - Danish (%)
Ancestries Reported - Dutch (%)
Ancestries Reported - English (%)
Ancestries Reported - French (%)
Ancestries Reported - French Canadian (%)
Ancestries Reported - German (%)
Ancestries Reported - Greek (%)
Ancestries Reported - Hungarian (%)
Ancestries Reported - Irish (%)
Ancestries Reported - Italian (%)
Ancestries Reported - Lithuanian (%)
Ancestries Reported - Norwegian (%)
Ancestries Reported - Polish (%)
Ancestries Reported - Portuguese (%)
Ancestries Reported - Russian (%)
Ancestries Reported - Scotch-Irish (%)
Ancestries Reported - Scottish (%)
Ancestries Reported - Slovak (%)
Ancestries Reported - Subsaharan African (%)
Ancestries Reported - Swedish (%)
Ancestries Reported - Swiss (%)
Ancestries Reported - Ukrainian (%)
Ancestries Reported - United States (%)
Ancestries Reported - Welsh (%)
Ancestries Reported - West Indian (%)
Ancestries Reported - Other (%)
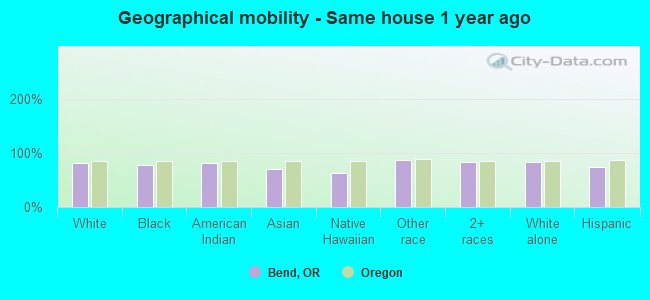
Geographical mobility - Same house 1 year ago (%)
Geographical mobility - Same house 1 year ago (%) - White
Geographical mobility - Same house 1 year ago (%) - Black or African American
Geographical mobility - Same house 1 year ago (%) - Asian
Geographical mobility - Same house 1 year ago (%) - Hispanic or Latino
Geographical mobility - Same house 1 year ago (%) - American Indian and Alaska Native
Geographical mobility - Same house 1 year ago (%) - Multirace
Geographical mobility - Same house 1 year ago (%) - Other Race
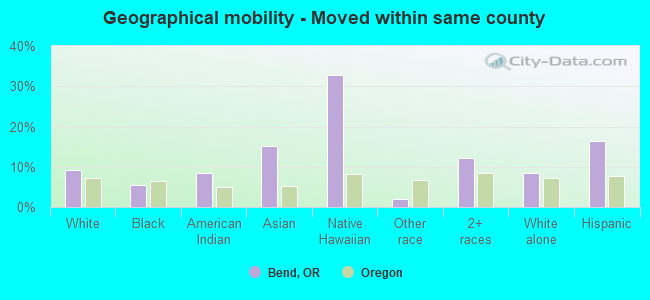
Geographical mobility - Moved within same county (%)
Geographical mobility - Moved within same county (%) - White
Geographical mobility - Moved within same county (%) - Black or African American
Geographical mobility - Moved within same county (%) - Asian
Geographical mobility - Moved within same county (%) - Hispanic or Latino
Geographical mobility - Moved within same county (%) - American Indian and Alaska Native
Geographical mobility - Moved within same county (%) - Multirace
Geographical mobility - Moved within same county (%) - Other Race
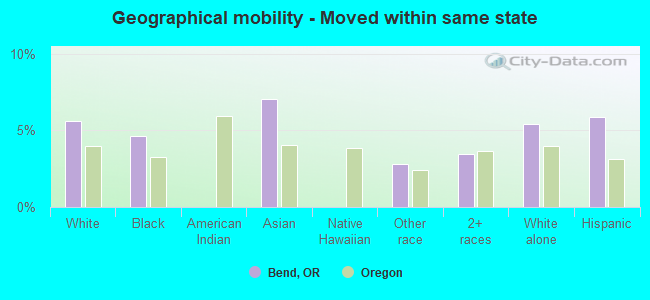
Geographical mobility - Moved from different county within same state (%)
Geographical mobility - Moved from different county within same state (%) - White
Geographical mobility - Moved from different county within same state (%) - Black or African American
Geographical mobility - Moved from different county within same state (%) - Asian
Geographical mobility - Moved from different county within same state (%) - Hispanic or Latino
Geographical mobility - Moved from different county within same state (%) - American Indian and Alaska Native
Geographical mobility - Moved from different county within same state (%) - Multirace
Geographical mobility - Moved from different county within same state (%) - Other Race
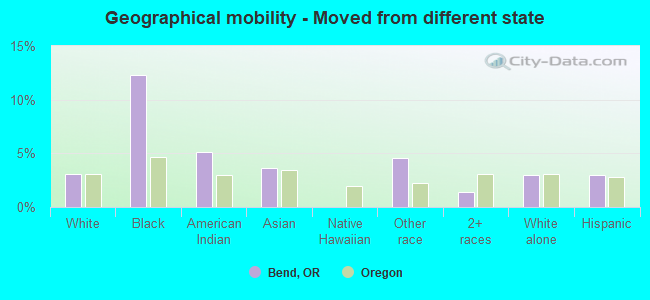
Geographical mobility - Moved from different state (%)
Geographical mobility - Moved from different state (%) - White
Geographical mobility - Moved from different state (%) - Black or African American
Geographical mobility - Moved from different state (%) - Asian
Geographical mobility - Moved from different state (%) - Hispanic or Latino
Geographical mobility - Moved from different state (%) - American Indian and Alaska Native
Geographical mobility - Moved from different state (%) - Multirace
Geographical mobility - Moved from different state (%) - Other Race
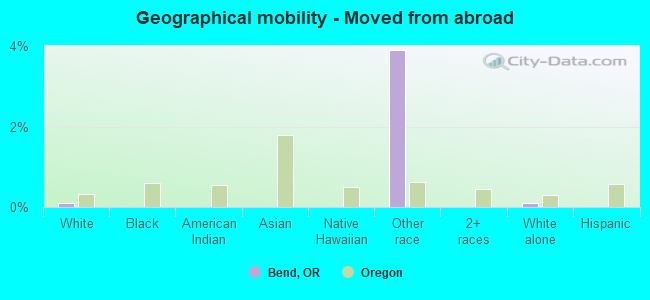
Geographical mobility - Moved from abroad (%)
Geographical mobility - Moved from abroad (%) - White
Geographical mobility - Moved from abroad (%) - Black or African American
Geographical mobility - Moved from abroad (%) - Asian
Geographical mobility - Moved from abroad (%) - Hispanic or Latino
Geographical mobility - Moved from abroad (%) - American Indian and Alaska Native
Geographical mobility - Moved from abroad (%) - Multirace
Geographical mobility - Moved from abroad (%) - Other Race
Place of birth for the foreign-born population - Ireland (%)
Place of birth for the foreign-born population - Denmark (%)
Place of birth for the foreign-born population - Norway (%)
Place of birth for the foreign-born population - Sweden (%)
Place of birth for the foreign-born population - United Kingdom (%)
Place of birth for the foreign-born population - England (%)
Place of birth for the foreign-born population - Scotland (%)
Place of birth for the foreign-born population - Other Northern Europe (%)
Place of birth for the foreign-born population - Austria (%)
Place of birth for the foreign-born population - Belgium (%)
Place of birth for the foreign-born population - France (%)
Place of birth for the foreign-born population - Germany (%)
Place of birth for the foreign-born population - Netherlands (%)
Place of birth for the foreign-born population - Switzerland (%)
Place of birth for the foreign-born population - Other Western Europe (%)
Place of birth for the foreign-born population - Greece (%)
Place of birth for the foreign-born population - Italy (%)
Place of birth for the foreign-born population - Portugal (%)
Place of birth for the foreign-born population - Spain (%)
Place of birth for the foreign-born population - Other Southern Europe (%)
Place of birth for the foreign-born population - Albania (%)
Place of birth for the foreign-born population - Belarus (%)
Place of birth for the foreign-born population - Bosnia and Herzegovina (%)
Place of birth for the foreign-born population - Bulgaria (%)
Place of birth for the foreign-born population - Croatia (%)
Place of birth for the foreign-born population - Czechoslovakia (%)
Place of birth for the foreign-born population - Hungary (%)
Place of birth for the foreign-born population - Latvia (%)
Place of birth for the foreign-born population - Lithuania (%)
Place of birth for the foreign-born population - North Macedonia (Macedonia) (%)
Place of birth for the foreign-born population - Moldova (%)
Place of birth for the foreign-born population - Poland (%)
Place of birth for the foreign-born population - Romania (%)
Place of birth for the foreign-born population - Russia (%)
Place of birth for the foreign-born population - Serbia (%)
Place of birth for the foreign-born population - Ukraine (%)
Place of birth for the foreign-born population - Other Eastern Europe (%)
Place of birth for the foreign-born population - China (%)
Place of birth for the foreign-born population - Hong Kong (%)
Place of birth for the foreign-born population - Taiwan (%)
Place of birth for the foreign-born population - Japan (%)
Place of birth for the foreign-born population - Korea (%)
Place of birth for the foreign-born population - Other Eastern Asia (%)
Place of birth for the foreign-born population - Afghanistan (%)
Place of birth for the foreign-born population - Bangladesh (%)
Place of birth for the foreign-born population - India (%)
Place of birth for the foreign-born population - Iran (%)
Place of birth for the foreign-born population - Kazakhstan (%)
Place of birth for the foreign-born population - Nepal (%)
Place of birth for the foreign-born population - Pakistan (%)
Place of birth for the foreign-born population - Sri Lanka (%)
Place of birth for the foreign-born population - Uzbekistan (%)
Place of birth for the foreign-born population - Other South Central Asia (%)
Place of birth for the foreign-born population - Burma (%)
Place of birth for the foreign-born population - Cambodia (%)
Place of birth for the foreign-born population - Indonesia (%)
Place of birth for the foreign-born population - Laos (%)
Place of birth for the foreign-born population - Malaysia (%)
Place of birth for the foreign-born population - Philippines (%)
Place of birth for the foreign-born population - Singapore (%)
Place of birth for the foreign-born population - Thailand (%)
Place of birth for the foreign-born population - Vietnam (%)
Place of birth for the foreign-born population - Other South Eastern Asia (%)
Place of birth for the foreign-born population - Armenia (%)
Place of birth for the foreign-born population - Iraq (%)
Place of birth for the foreign-born population - Israel (%)
Place of birth for the foreign-born population - Jordan (%)
Place of birth for the foreign-born population - Kuwait (%)
Place of birth for the foreign-born population - Lebanon (%)
Place of birth for the foreign-born population - Saudi Arabia (%)
Place of birth for the foreign-born population - Syria (%)
Place of birth for the foreign-born population - Turkey (%)
Place of birth for the foreign-born population - Yemen (%)
Place of birth for the foreign-born population - Other Western Asia (%)
Place of birth for the foreign-born population - Eritrea (%)
Place of birth for the foreign-born population - Ethiopia (%)
Place of birth for the foreign-born population - Kenya (%)
Place of birth for the foreign-born population - Somalia (%)
Place of birth for the foreign-born population - Uganda (%)
Place of birth for the foreign-born population - Zimbabwe (%)
Place of birth for the foreign-born population - Other Eastern Africa (%)
Place of birth for the foreign-born population - Cameroon (%)
Place of birth for the foreign-born population - Congo (%)
Place of birth for the foreign-born population - Democratic Republic of Congo (Zaire) (%)
Place of birth for the foreign-born population - Other Middle Africa (%)
Place of birth for the foreign-born population - Egypt (%)
Place of birth for the foreign-born population - Morocco (%)
Place of birth for the foreign-born population - Sudan (%)
Place of birth for the foreign-born population - Other Northern Africa (%)
Place of birth for the foreign-born population - South Africa (%)
Place of birth for the foreign-born population - Other Southern Africa (%)
Place of birth for the foreign-born population - Cabo Verde (%)
Place of birth for the foreign-born population - Ghana (%)
Place of birth for the foreign-born population - Liberia (%)
Place of birth for the foreign-born population - Nigeria (%)
Place of birth for the foreign-born population - Senegal (%)
Place of birth for the foreign-born population - Sierra Leone (%)
Place of birth for the foreign-born population - Other Western Africa (%)
Place of birth for the foreign-born population - Australia (%)
Place of birth for the foreign-born population - New Zealand (%)
Place of birth for the foreign-born population - Fiji (%)
Place of birth for the foreign-born population - Micronesia (%)
Place of birth for the foreign-born population - Bahamas (%)
Place of birth for the foreign-born population - Barbados (%)
Place of birth for the foreign-born population - Cuba (%)
Place of birth for the foreign-born population - Dominica (%)
Place of birth for the foreign-born population - Dominican Republic (%)
Place of birth for the foreign-born population - Grenada (%)
Place of birth for the foreign-born population - Haiti (%)
Place of birth for the foreign-born population - Jamaica (%)
Place of birth for the foreign-born population - St. Vincent and the Grenadines (%)
Place of birth for the foreign-born population - Trinidad and Tobago (%)
Place of birth for the foreign-born population - West Indies (%)
Place of birth for the foreign-born population - Other Caribbean (%)
Place of birth for the foreign-born population - Belize (%)
Place of birth for the foreign-born population - Costa Rica (%)
Place of birth for the foreign-born population - El Salvador (%)
Place of birth for the foreign-born population - Guatemala (%)
Place of birth for the foreign-born population - Honduras (%)
Place of birth for the foreign-born population - Mexico (%)
Place of birth for the foreign-born population - Nicaragua (%)
Place of birth for the foreign-born population - Panama (%)
Place of birth for the foreign-born population - Other Central America (%)
Place of birth for the foreign-born population - Argentina (%)
Place of birth for the foreign-born population - Bolivia (%)
Place of birth for the foreign-born population - Brazil (%)
Place of birth for the foreign-born population - Chile (%)
Place of birth for the foreign-born population - Colombia (%)
Place of birth for the foreign-born population - Ecuador (%)
Place of birth for the foreign-born population - Guyana (%)
Place of birth for the foreign-born population - Peru (%)
Place of birth for the foreign-born population - Uruguay (%)
Place of birth for the foreign-born population - Venezuela (%)
Place of birth for the foreign-born population - Other South America (%)
Place of birth for the foreign-born population - Canada (%)
Place of birth for the foreign-born population - Other Northern America (%)
Place of birth for the foreign-born population - Other (%)
Latest news about races in Bend, OR collected exclusively by city-data.com from local newspapers, TV, and radio stations
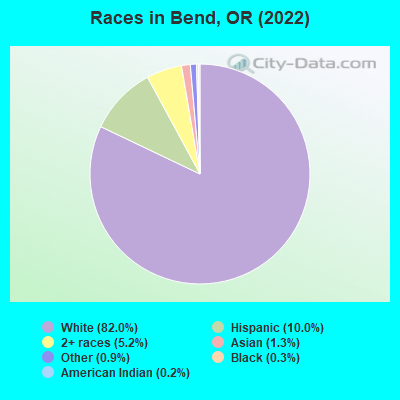
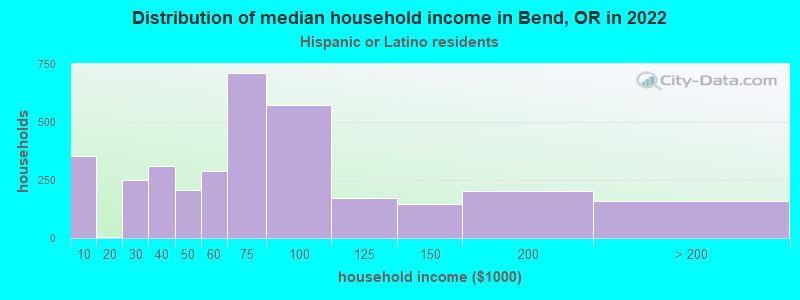
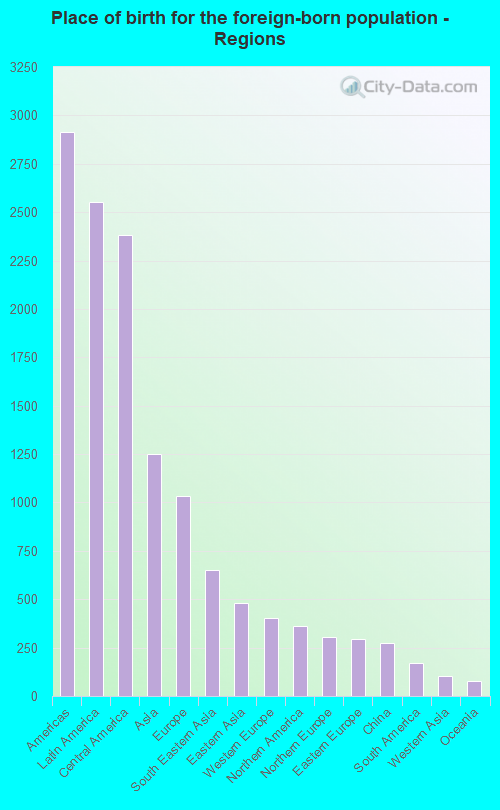
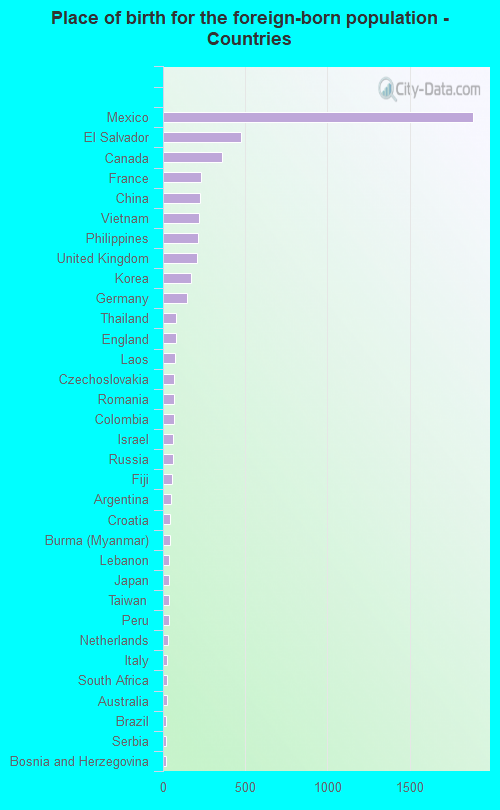
According to 2022 data, the most numerous races in Bend, OR are White alone (84,666 residents), Hispanic (10,346 residents), and Two or more races (5,420 residents). 92.4% of Bend residents speak English at home. 5.1% of Bend, OR residents are foreign-born (2.5% born in Latin America, 1.2% born in Asia, 1.0% born in Europe), which is 75.0% less than the foreign-born rate of 9.0% across the entire state of Oregon.
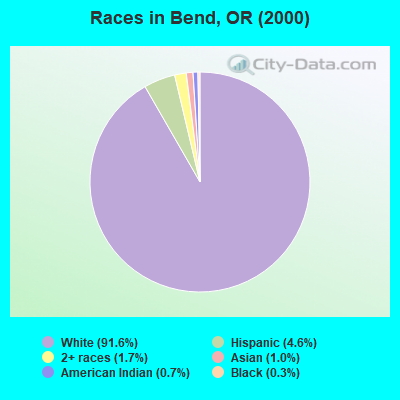
Race distribution in Bend
2000 2022
2,857,616 83.5% White alone 275,314 8.0% Hispanic 100,333 2.9% Asian alone 82,733 2.4% Two or more races 53,325 1.6% Black alone 40,130 1.2% American Indian alone 7,398 0.2% Native Hawaiian and Other 4,550 0.1% Other race alone
3,037,571 71.6% White alone 609,538 14.4% Hispanic 252,744 6.0% Two or more races 191,283 4.5% Asian alone 78,228 1.8% Black alone 29,399 0.7% American Indian alone 25,731 0.6% Other race alone 15,643 0.4% Native Hawaiian and Other
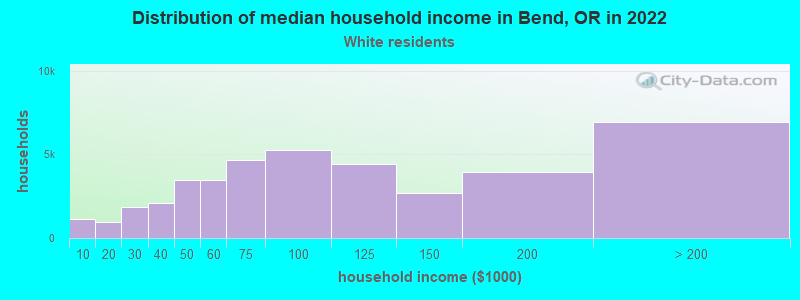
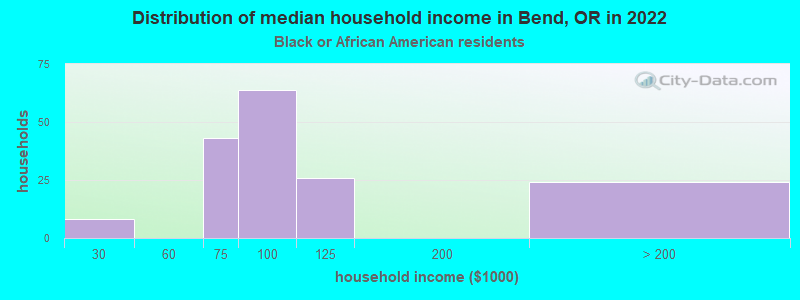
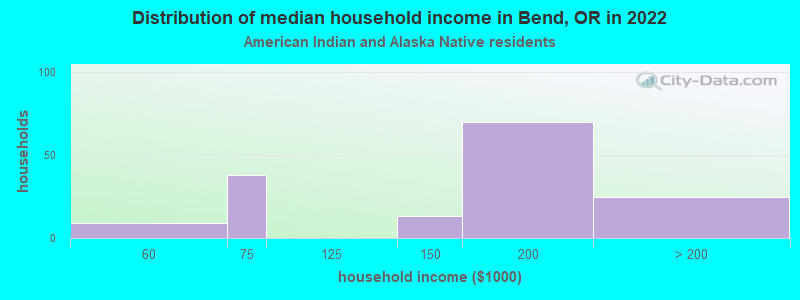
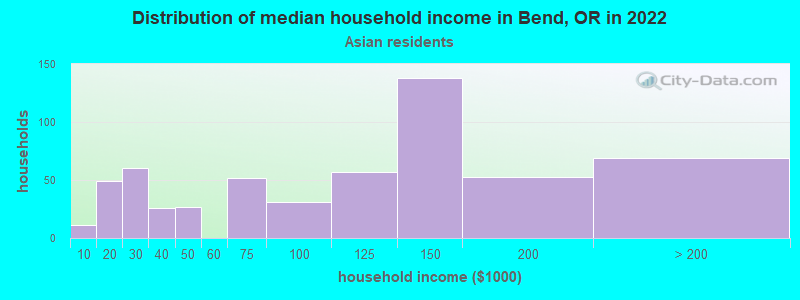
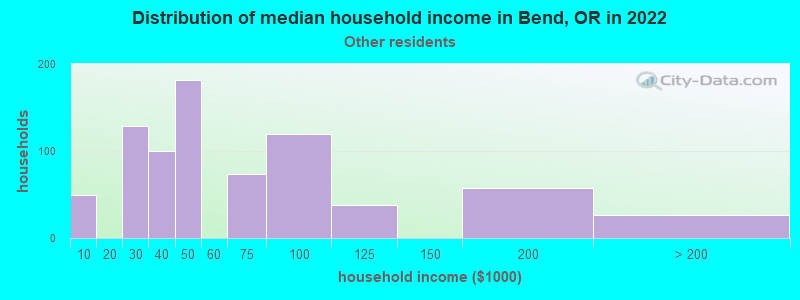
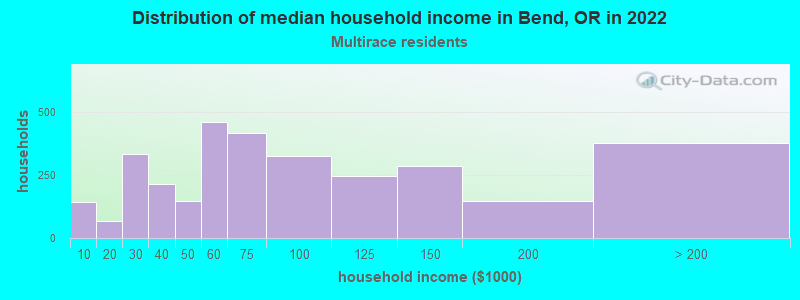
Income and house value in Bend Median household income in 2022 $90,753 White non-Hispanic householders$139,342 Asian householders$48,424 Some other race householders$55,931 Two or more races householders$64,521 Hispanic or Latino race householdersMedian 2022 house value $750,177 White Non-Hispanic householders$603,838 American Indian or Alaska Native householders $630,025 Asian householders$577,652 Native Hawaiian and other Pacific Islander householders$636,700 Some other race householders$818,468 Two or more races householders$697,290 Hispanic or Latino householders
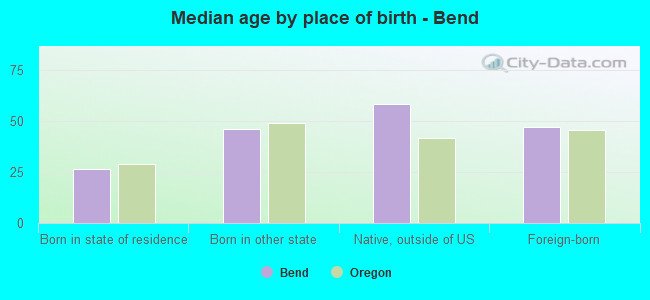
Median age by race in Bend
42.6 Median age for White residents42.5 42.6 54.1 Median age for Black or African American residents-666,666,666.0 -666,666,666.0 51.6 Median age for American Indian / Alaska Native residents32.5 50.7 32.8 Median age for Asian residents30.5 38.6 -666,666,666.0 Median age for Native Hawaiian / Pacific Islander residents-666,666,666.0 -666,666,666.0 32.5 Median age for Other race residents33.7 23.1 23.4 Median age for Two or more races residents27.1 23.3 43.2 Median age for White alone residents42.6 43.6 27.4 Median age for Hispanic or Latino residents37.0 22.5
Owner/renter occupied households by race in Bend
House owners and renters - White residents 24,988 61.1% Owner occupied15,942 38.9% Renter occupiedHouse owners and renters - Black or African American residents 18 9.6% Owner occupied172 90.4% Renter occupiedHouse owners and renters - American Indian / Alaska Native residents 41 25.1% Owner occupied124 74.9% Renter occupiedHouse owners and renters - Asian residents 439 59.5% Owner occupied299 40.5% Renter occupiedHouse owners and renters - Native Hawaiian / Pacific Islander residents 39 100.0% Owner occupiedHouse owners and renters - Other race residents 280 57.8% Owner occupied204 42.2% Renter occupiedHouse owners and renters - Two or more races residents 1,122 54.5% Owner occupied937 45.5% Renter occupiedHouse owners and renters - White alone residents 24,094 62.6% Owner occupied14,376 37.4% Renter occupiedHouse owners and renters - Hispanic or Latino residents 1,389 41.8% Owner occupied1,937 58.2% Renter occupied
Language usage in Bend
English speakers - Total 92.4% of residents of Bend speak English at home.
5.7% of residents speak Spanish at home 3,782 66.9% Speak English very well1,875 33.1% Speak English less than very well1.9% of residents speak other language at home 1,736 92.7% Speak English very well136 7.3% Speak English less than very well
English speakers - Born in the United States 97.0% of residents of Bend speak English at home.
1.8% of residents speak Spanish at home 873 85.2% Speak English very well152 14.8% Speak English less than very well1.3% of residents speak other language at home 654 86.1% Speak English very well106 13.9% Speak English less than very well
English speakers - Native, born elsewhere 88.9% of residents of Bend speak English at home.
11.1% of residents speak other language at home 180 100.0% Speak English very well
English speakers - Foreign-born 41.4% of residents of Bend speak English at home.
43.4% of residents speak Spanish at home 564 25.8% Speak English very well1,625 74.2% Speak English less than very well15.3% of residents speak other language at home 770 100.0% Speak English very well
White (Caucasian) - Speak only English Native:
95.8% (80,912)Foreign-born:
44.3% (1,637)
White (Caucasian) - Speak another language Native:
4.2% (3,562)Foreign-born:
55.7% (2,058)
American Indian / Alaska Native - Speak another language Native:
24.8% (113)Foreign-born:
100.0% (36)
Asian - Speak only English Native:
67.2% (627)Foreign-born:
28.8% (332)
Asian - Speak another language Native:
34.1% (319)Foreign-born:
69.8% (804)
Other race - Speak another language Native:
19.9% (337)Foreign-born:
100.0% (759)
Two or more races - Speak only English Native:
89.7% (6,557)Foreign-born:
1.9% (17)
Two or more races - Speak another language Native:
10.2% (743)Foreign-born:
100.0% (895)
White alone - Speak only English Native:
98.3% (78,885)Foreign-born:
73.8% (1,538)
White alone - Speak another language Native:
1.7% (1,338)Foreign-born:
26.2% (546)
Hispanic or Latino - Speak only English Native:
62.3% (4,680)Foreign-born:
4.3% (99)
Hispanic or Latino - Speak another language Native:
37.7% (2,837)Foreign-born:
95.7% (2,189)
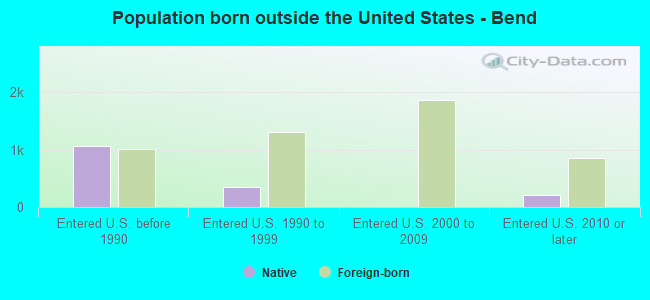
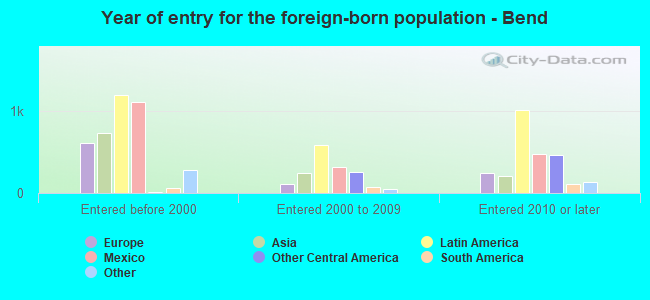
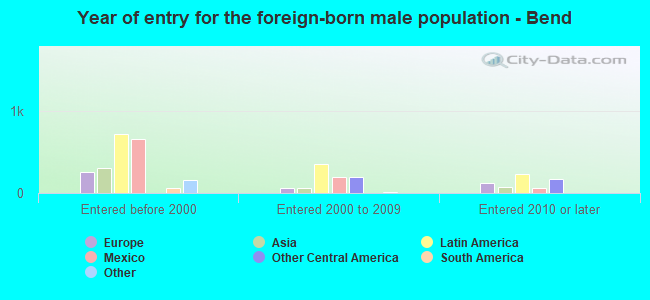
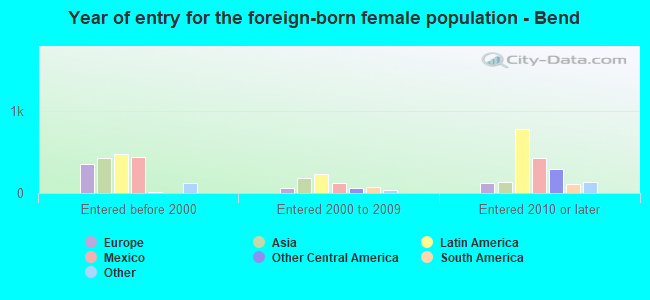
Foreign-born residents in Bend 5,300 residents are foreign born (2.5% Latin America , 1.2% Asia , 1.0% Europe ).
This city:
5.1%Oregon:
9.8%
Marital status for residents in Bend Marital status - White (Caucasian) population 15 years and over
Males 32.7% Never married51.9% Now married1.5% Separated2.1% Widowed11.9% DivorcedFemales 28.0% Never married46.2% Now married1.8% Separated8.0% Widowed16.1% DivorcedWomen who gave birth in the past 12 months Now married:
73.7% (554)Unmarried:
26.3% (198)
Women who did not give birth in the past 12 months Now married:
43.1% (10,123)Unmarried:
56.9% (13,339)
Marital status - Black or African American population 15 years and over
Males 67.1% Never married32.9% Now married0.0% Separated0.0% Widowed0.0% DivorcedFemales 85.1% Never married10.6% Now married0.0% Separated0.0% Widowed4.3% DivorcedWomen who gave birth in the past 12 months Now married:
0.0% (0)Unmarried:
100.0% (1)
Women who did not give birth in the past 12 months Now married:
11.2% (27)Unmarried:
88.8% (213)
Marital status - American Indian / Alaska Native population 15 years and over
Males 48.4% Never married33.1% Now married0.0% Separated1.7% Widowed16.7% DivorcedFemales 0.0% Never married100.0% Now married0.0% Separated0.0% Widowed0.0% DivorcedMarital status - Asian population 15 years and over
Males 75.1% Never married23.1% Now married0.0% Separated1.9% Widowed0.0% DivorcedFemales 39.1% Never married48.9% Now married0.0% Separated3.2% Widowed8.7% DivorcedWomen who gave birth in the past 12 months Now married:
59.7% (45)Unmarried:
40.3% (30)
Women who did not give birth in the past 12 months Now married:
45.2% (268)Unmarried:
54.8% (326)
Marital status - Native Hawaiian / Pacific Islander population 15 years and over
Males 0.0% Never married0.0% Now married0.0% Separated0.0% Widowed100.0% DivorcedFemales 0.0% Never married100.0% Now married0.0% Separated0.0% Widowed0.0% DivorcedWomen who did not give birth in the past 12 months Now married:
100.0% (29)Unmarried:
0.0% (0)
Marital status - Other race population 15 years and over
Males 51.6% Never married39.2% Now married6.5% Separated0.0% Widowed2.7% DivorcedFemales 38.6% Never married47.5% Now married2.9% Separated0.0% Widowed11.0% DivorcedWomen who gave birth in the past 12 months Now married:
100.0% (26)Unmarried:
0.0% (0)
Women who did not give birth in the past 12 months Now married:
34.7% (165)Unmarried:
65.3% (311)
Marital status - Two or more races population 15 years and over
Males 59.6% Never married30.9% Now married0.3% Separated2.3% Widowed6.9% DivorcedFemales 24.1% Never married64.7% Now married1.2% Separated3.7% Widowed6.2% DivorcedWomen who gave birth in the past 12 months Now married:
61.4% (54)Unmarried:
38.6% (34)
Women who did not give birth in the past 12 months Now married:
68.1% (1,540)Unmarried:
31.9% (721)
Marital status - White alone, not Hispanic / Latino population 15 years and over
Males 32.8% Never married51.3% Now married1.5% Separated2.2% Widowed12.2% DivorcedFemales 25.5% Never married47.5% Now married1.9% Separated8.5% Widowed16.7% DivorcedWomen who gave birth in the past 12 months Now married:
100.0% (554)Unmarried:
0.0% (0)
Women who did not give birth in the past 12 months Now married:
44.3% (9,288)Unmarried:
55.7% (11,661)
Marital status - Hispanic or Latino population 15 years and over
Males 48.7% Never married43.0% Now married2.1% Separated0.6% Widowed5.5% DivorcedFemales 44.9% Never married40.9% Now married1.4% Separated2.2% Widowed10.6% DivorcedWomen who gave birth in the past 12 months Now married:
16.4% (9)Unmarried:
83.6% (47)
Women who did not give birth in the past 12 months Now married:
38.6% (1,078)Unmarried:
61.4% (1,714)
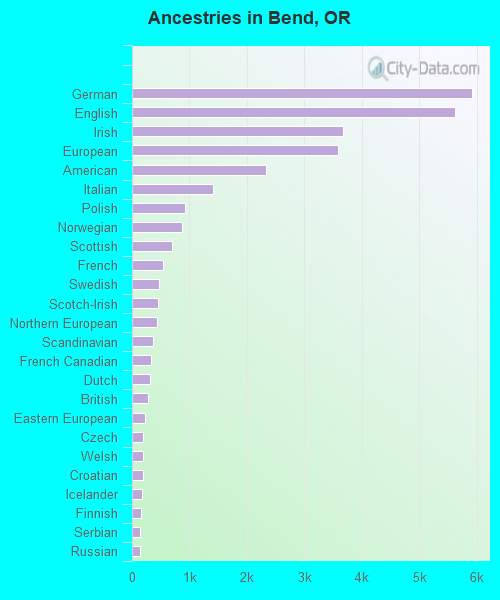
Ancestries in Bend
5,921 13.8% German5,626 13.1% English3,673 8.6% Irish3,592 8.4% European2,329 5.4% American1,415 3.3% Italian920 2.1% Polish870 2.0% Norwegian694 1.6% Scottish533 1.2% French475 1.1% Swedish458 1.1% Scotch-Irish430 1.0% Northern European359 0.8% Scandinavian326 0.8% French Canadian307 0.7% Dutch281 0.7% British224 0.5% Eastern European192 0.4% Czech192 0.4% Welsh188 0.4% Croatian176 0.4% Icelander158 0.4% Finnish144 0.3% Serbian141 0.3% Russian138 0.3% Danish122 0.3% Canadian115 0.3% Hungarian108 0.3% Lebanese90 0.2% Greek70 0.2% Romanian49 0.1% Slovak42 0.10% Basque40 0.09% Lithuanian40 0.09% Nigerian30 0.07% Slovene28 0.07% Iranian28 0.07% Yugoslavian27 0.06% Latvian24 0.06% Austrian23 0.05% Cajun22 0.05% Slavic20 0.05% Palestinian19 0.04% Ethiopian16 0.04% Swiss11 0.03% Portuguese9 0.02% Brazilian6 0.01% Israeli3 0.01% African
Geographical mobility in Bend Same house 1 year ago 74,100 82.0% White (Caucasian)406 76.9% Black or African American413 82.1% American Indian / Alaska Native1,008 70.0% Asian50 63.0% Native Hawaiian / Pacific Islander2,345 86.6% Other race6,582 83.1% Two or more races69,889 83.1% White alone, not Hispanic / Latino7,595 74.7% Hispanic or LatinoMoved within same county 8,305 9.2% White / Caucasian28 5.4% Black or African American43 8.5% American Indian / Alaska Native218 15.1% Asian26 32.8% Native Hawaiian / Pacific Islander51 1.9% Other race957 12.1% Two or more races7,104 8.4% White alone, not Hispanic / Latino1,667 16.4% Hispanic or LatinoMoved within same state 5,052 5.6% White / Caucasian24 4.6% Black or African American101 7.0% Asian76 2.8% Other race272 3.4% Two or more races4,546 5.4% White alone, not Hispanic / Latino599 5.9% Hispanic or LatinoMoved from different state 2,806 3.1% White / Caucasian65 12.3% Black or African American26 5.1% American Indian / Alaska Native53 3.7% Asian124 4.6% Other race114 1.4% Two or more races2,500 3.0% White alone, not Hispanic / Latino306 3.0% Hispanic or LatinoMoved from abroad 87 0.1% White106 3.9% Other race87 0.1% White alone, not Hispanic / Latino
Children Nativity (place of birth) in Bend
Children under 6 years - Living with two parents Both parents native 3,156 100.0% NativeBoth parents foreign-born 174 91.4% Native16 8.6% Foreign-bornOne native, one foreign-born parent 659 100.0% NativeChildren under 6 years - Living with one parent Native parent 1,830 100.0% NativeChildren 6 to 17 years - Living with two parents Both parents native 7,874 98.2% Native143 1.8% Foreign-bornBoth parents foreign-born 511 75.0% Native171 25.0% Foreign-bornOne native, one foreign-born parent 508 100.0% NativeChildren 6 to 17 years - Living with one parent Native parent 4,263 100.0% NativeForeign-born parent 232 50.1% Native231 49.9% Foreign-born
Grandparents responsible for own grandchildren in Bend
Grandparents (30 to 59 years) White / Caucasian 96 17.2% Responsible for grandchildren465 82.8% Not responsible for grandchildrenWhite alone, not Hispanic / Latino 50 10.0% Responsible for grandchildren451 90.0% Not responsible for grandchildrenHispanic or Latino 32 100.0% Not responsible for grandchildrenGrandparents (60 years and over) White / Caucasian 49 12.8% Responsible for grandchildren333 87.2% Not responsible for grandchildrenWhite alone, not Hispanic / Latino 49 13.5% Responsible for grandchildren313 86.5% Not responsible for grandchildrenHispanic or Latino 65 100.0% Not responsible for grandchildren