Bayview, WA (Washington) Houses and Residents
| Bayview: | $657,853 |
| Washington: | $569,500 |
Total population: 3,823 (Urban population: 2,062, Rural population: 1,292 (all nonfarm))
Houses: 1,428 (1,371 occupied: 1,191 owner occupied, 180 renter occupied)
| % of renters here: | 13% |
| State: | 36% |
Housing density: 63 houses/condos per square mile
Median price asked for vacant for-sale houses and condos in 2022 in this county: $430,980.
Median contract rent in 2022: $1,477 (lower quartile is $1,098, upper quartile is $1,804)
Median gross rent in Bayview, WA in 2022: $1,708
Housing units in Bayview with a mortgage: 630 (90 second mortgage, 75 home equity loan, 0 both second mortgage and home equity loan)
Houses without a mortgage: 328
Compare current foreclosures near Bayview, WA:
| Photo | Address | Area | Beds / Baths | Price | Details |
|---|---|---|---|---|---|

|
#1
SW Roeder Dr
Oak Harbor, WA 98277
|
1,802 sq. feet
|
2 baths 3 beds |
$560,000
|
show details |

|
#2
268th St NW
Stanwood, WA 98292
|
1,420 sq. feet
|
4 baths 6 beds |
show details | |

|
#3
Wildflower Way
Sedro Woolley, WA 98284
|
908 sq. feet
|
1 baths 2 beds |
show details | |

|
#4
74th Dr NW
Stanwood, WA 98292
|
1,461 sq. feet
|
3 baths 3 beds |
show details | |

|
#5
M Ave
Anacortes, WA 98221
|
1,420 sq. feet
|
2 baths 3 beds |
show details | |

|
#6
Mount Baker Loop
Mount Vernon, WA 98273
|
2,743 sq. feet
|
2 baths 4 beds |
show details | |

|
#7
Mashie St
Anacortes, WA 98221
|
1,152 sq. feet
|
1 baths 2 beds |
show details | |

|
#8
285th Pl NW
Stanwood, WA 98292
|
2,268 sq. feet
|
3 baths 3 beds |
show details | |

|
#9
74th Dr NW
Stanwood, WA 98292
|
1,653 sq. feet
|
2 baths 4 beds |
show details | |

|
#10
Arrowhead Rd
Camano Island, WA 98282
|
1,364 sq. feet
|
1 baths 2 beds |
show details |
| Photo | Address | Area | Beds / Baths | Price | Details |
|---|---|---|---|---|---|

|
#11
NE 3rd Ave
Oak Harbor, WA 98277
|
1,138 sq. feet
|
1 baths 3 beds |
show details | |

|
#12
96th Ct NW
Stanwood, WA 98292
|
- sq. feet
|
2 baths 3 beds |
show details | |

|
#13
SE 8th Ave
Oak Harbor, WA 98277
|
3,464 sq. feet
|
4 baths 6 beds |
show details | |

|
#14
NE Midway Blvd
Oak Harbor, WA 98277
|
2,102 sq. feet
|
2 baths 3 beds |
show details | |

|
#15
F And S Grade Rd
Sedro Woolley, WA 98284
|
1,888 sq. feet
|
2 baths 4 beds |
show details | |

|
#16
Fruitdale Rd
Sedro Woolley, WA 98284
|
1,188 sq. feet
|
2 baths 3 beds |
show details | |

|
#17
Fidalgo Pl
Sedro Woolley, WA 98284
|
1,259 sq. feet
|
2 baths 3 beds |
show details | |

|
#18
Wildflower Way
Sedro Woolley, WA 98284
|
904 sq. feet
|
1 baths 2 beds |
show details | |

|
#19
Tweed Pl
Anacortes, WA 98221
|
1,902 sq. feet
|
3 baths 3 beds |
show details | |

|
#20
Whitney Dr
Oak Harbor, WA 98277
|
1,200 sq. feet
|
2 baths 3 beds |
show details |
| Photo | Address | Area | Beds / Baths | Price | Details |
|---|---|---|---|---|---|

|
#21
W Lake Ketchum Rd
Stanwood, WA 98292
|
2,613 sq. feet
|
2 baths 3 beds |
show details | |

|
#22
Orchard Loop
Oak Harbor, WA 98277
|
2,238 sq. feet
|
2 baths 5 beds |
show details | |

|
#23
Banta Rd
Oak Harbor, WA 98277
|
3,129 sq. feet
|
2 baths 3 beds |
show details | |

|
#24
Tenneson Rd
Sedro Woolley, WA 98284
|
2,380 sq. feet
|
2 baths 3 beds |
show details | |

|
#25
Porter St
Mount Vernon, WA 98273
|
2,116 sq. feet
|
1 baths 3 beds |
show details | |

|
#26
Lake Cavanaugh Rd
Mount Vernon, WA 98274
|
3,630 sq. feet
|
3 baths 4 beds |
show details | |

|
#27
Sunset Ave
Anacortes, WA 98221
|
1,584 sq. feet
|
1 baths 2 beds |
show details | |

|
#28
Dusty Ln
Burlington, WA 98233
|
2,112 sq. feet
|
2 baths 3 beds |
show details | |

|
#29
64th Ave NW
Stanwood, WA 98292
|
- sq. feet
|
2 baths 3 beds |
show details | |

|
#30
Cascadia Dr
Sedro Woolley, WA 98284
|
1,177 sq. feet
|
2 baths 3 beds |
show details |
| Photo | Address | Area | Beds / Baths | Price | Details |
|---|---|---|---|---|---|

|
#31
26th St
Anacortes, WA 98221
|
1,359 sq. feet
|
1 baths 3 beds |
show details | |

|
#32
78th Dr NW
Stanwood, WA 98292
|
1,072 sq. feet
|
1 baths 3 beds |
show details | |

|
#33
27th St
Anacortes, WA 98221
|
1,579 sq. feet
|
2 baths 4 beds |
show details | |

|
#34
S Lake Ketchum Rd
Stanwood, WA 98292
|
1,028 sq. feet
|
2 baths 3 beds |
show details | |

|
#35
Marine Heights Way
Anacortes, WA 98221
|
2,175 sq. feet
|
2 baths 3 beds |
show details | |

|
#36
38th St
Anacortes, WA 98221
|
2,033 sq. feet
|
2 baths 3 beds |
show details | |

|
#37
W Lake Ketchum Rd
Stanwood, WA 98292
|
2,613 sq. feet
|
2 baths 3 beds |
show details | |

|
#38
287th Pl NW
Stanwood, WA 98292
|
2,949 sq. feet
|
2 baths 4 beds |
show details | |

|
#39
W 3rd St
Anacortes, WA 98221
|
1,028 sq. feet
|
3 baths 4 beds |
show details | |

|
#40
Jameson St
Sedro Woolley, WA 98284
|
912 sq. feet
|
1 baths 2 beds |
show details |
| Photo | Address | Area | Beds / Baths | Price | Details |
|---|---|---|---|---|---|

|
#41
15th St
Anacortes, WA 98221
|
1,040 sq. feet
|
1 baths 3 beds |
show details | |

|
#42
Lakeside Dr
Sedro Woolley, WA 98284
|
1,040 sq. feet
|
1 baths 3 beds |
show details | |

|
#43
NE 8th Ave
Oak Harbor, WA 98277
|
1,680 sq. feet
|
2 baths 3 beds |
show details | |

|
#44
Pacific St
Sedro Woolley, WA 98284
|
1,458 sq. feet
|
1 baths 3 beds |
show details | |

|
#45
289th Pl NW
Stanwood, WA 98292
|
1,628 sq. feet
|
2 baths 3 beds |
show details | |

|
#46
Prairie Rd
Sedro Woolley, WA 98284
|
1,024 sq. feet
|
1 baths 3 beds |
show details | |

|
#47
W Lake Samish Dr
Bellingham, WA 98229
|
4,242 sq. feet
|
2 baths 3 beds |
show details | |

|
#48
Puget Ave
Sedro Woolley, WA 98284
|
1,356 sq. feet
|
2 baths 3 beds |
show details | |

|
#49
Alderwood Ln
Sedro Woolley, WA 98284
|
1,735 sq. feet
|
2 baths 3 beds |
show details | |

|
Check over 1 million property listings on Foreclosure.com!
|
browse all offers | |||

Household type by relationship:
Households: 115,277- In family households: 96,098 (22,309 male householders, 8,347 female householders)
23,747 spouses, 31,478 children (28,838 natural, 950 adopted, 1,690 stepchildren), 2,114 grandchildren, 1,110 brothers or sisters, 871 parents, foster children, 1,654 other relatives, 3,690 non-relatives
- In nonfamily households: 19,179 (7,200 male householders (5,248 living alone)), 7,701 female householders (6,396 living alone)), 4,278 nonrelatives
- In group quarters: 1,624 (650 institutionalized population)
18,368 married couples with children.
5,970 single-parent households (1,535 men, 4,435 women).
96.1% of residents of Bayview speak English at home.
2.8% of residents speak Spanish at home (52% speak English very well, 21% speak English well, 27% speak English not well).
0.9% of residents speak other Indo-European language at home (75% speak English very well, 25% speak English well).
0.2% of residents speak Asian or Pacific Island language at home (100% speak English very well).
Foreign born population: 170 (4.0%)
(77.6% of them are naturalized citizens)
| Here: | 6.2 |
| State: | 6.5 |
| Here: | 4.0 |
| State: | 3.9 |

- Bedrooms in owner-occupied houses and condos in Bayview, Washington
- 0no bedroom
- 331 bedroom
- 2032 bedrooms
- 6753 bedrooms
- 2434 bedrooms
- 375+ bedrooms

- Bedrooms in renter-occupied apartments in Bayview, Washington
- 0no bedroom
- 391 bedroom
- 612 bedrooms
- 623 bedrooms
- 184 bedrooms
- 05+ bedrooms

- Cars and other vehicles available in Bayview in owner-occupied houses/condos
- 23no vehicle
- 2661 vehicle
- 5532 vehicles
- 2863 vehicles
- 344 vehicles
- 295+ vehicles

- Cars and other vehicles available in Bayview in renter-occupied apartments
- 0no vehicle
- 1061 vehicle
- 432 vehicles
- 313 vehicles
- 04 vehicles
- 05+ vehicles

- Rooms in owner-occupied houses in Bayview, Washington
- 01 room
- 02 rooms
- 643 rooms
- 514 rooms
- 1485 rooms
- 3596 rooms
- 2087 rooms
- 1758 rooms
- 1869+ rooms

- Rooms in renter-occupied apartments in Bayview, Washington
- 01 room
- 92 rooms
- 223 rooms
- 604 rooms
- 625 rooms
- 186 rooms
- 07 rooms
- 08 rooms
- 99+ rooms


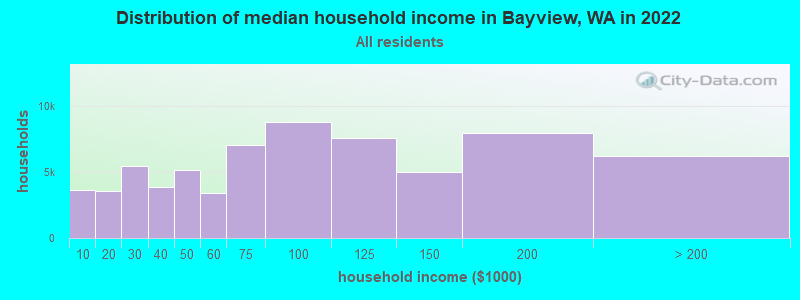
Bayview, WA household income distribution

- 3,674Less than $10,000
- 3,529$10,000 to $19,999
- 5,422$20,000 to $29,999
- 3,833$30,000 to $39,999
- 5,133$40,000 to $49,999
- 3,380$50,000 to $59,999
- 7,084$60,000 to $74,999
- 8,792$75,000 to $99,999
- 7,583$100,000 to $124,999
- 4,985$125,000 to $149,999
- 7,973$150,000 to $199,999
- 6,242$200,000 or more
Percentage of workers working in this county: 79.6%
Number of people working at home: 392 (19.5% of all workers)
Travel time to work (commute)
- Less than 5 minutes: 55
- 5 to 9 minutes: 118
- 10 to 14 minutes: 393
- 15 to 19 minutes: 323
- 20 to 24 minutes: 222
- 25 to 29 minutes: 35
- 30 to 34 minutes: 101
- 35 to 39 minutes: 24
- 40 to 44 minutes: 27
- 45 to 59 minutes: 79
- 60 to 89 minutes: 64
- 90 or more minutes: 19
Means of transportation to work:
- Drove a car alone: 1,320 (87.9%)
- Carpooled: 130 (8.7%)
- Walked: 10 (0.7%)
- Worked at home: 41 (2.7%)


- Year of entry for the foreign-born population in Bayview, Washington
- 201995 to March 2000
- 01990 to 1994
- 91985 to 1989
- 01980 to 1984
- 01975 to 1979
- 81970 to 1974
- 01965 to 1969
- 87Before 1965
Most common places of birth for foreign-born residents (%):
| Bayview: | 66.1% (82) |
| Washington: | 7.7% (47,568) |
| Bayview: | 20.2% (25) |
| Washington: | 3.3% (20,321) |
| Bayview: | 7.3% (9) |
| Washington: | 6.2% (38,172) |
| Bayview: | 6.5% (8) |
| Washington: | 0.6% (3,795) |
Place of birth for U.S.-born residents:
- This state: 1,706
- Other state: 1,503
- Northeast: 89
- Midwest: 621
- South: 139
- West: 654
58% of Bayview residents lived in the same house 5 years ago.
Out of people who lived in different houses, 53% lived in this county.
Out of people who lived in different counties, 46% lived in Washington.
Education attainment for males 25 years and older:
- No schooling: 0
- Nursery to 4th grade: 9
- 5th and 6th grade: 0
- 7th and 8th grade: 15
- 9th grade: 30
- 10th grade: 0
- 11th grade: 12
- 12th grade, no diploma: 30
- High school graduate (or equivalency): 274
- Less than 1 year of college: 111
- Some college more than 1 year, no degree: 200
- Associate degree: 94
- Bachelor's degree: 244
- Master's degree: 61
- Professional school degree: 95
- Doctorate degree: 0

Education attainment for females 25 years and older:
- No schooling: 0
- Nursery to 4th grade: 0
- 5th and 6th grade: 0
- 7th and 8th grade: 34
- 9th grade: 14
- 10th grade: 11
- 11th grade: 10
- 12th grade, no diploma: 30
- High school graduate (or equivalency): 299
- Less than 1 year of college: 180
- Some college more than 1 year, no degree: 254
- Associate degree: 135
- Bachelor's degree: 197
- Master's degree: 58
- Professional school degree: 25
- Doctorate degree: 11


Housing units in structures:
- One, detached: 1,147
- One, attached: 77
- Two: 29
- 3 or 4: 8
- 20 to 49: 9
- Mobile homes: 146
- Boats, RVs, vans, etc.: 12
Median worth of mobile homes: $364,569
Housing units lacking complete kitchen facilities: 0.7%

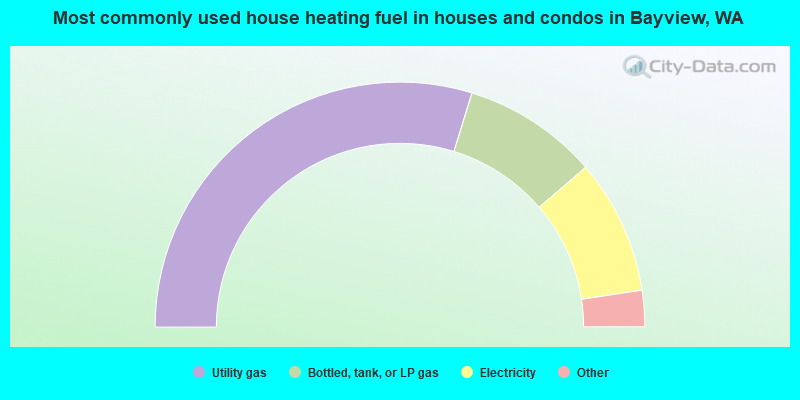
- 59.5%Utility gas
- 17.9%Bottled, tank, or LP gas
- 17.8%Electricity
- 3.3%Wood
- 1.5%Fuel oil, kerosene, etc.
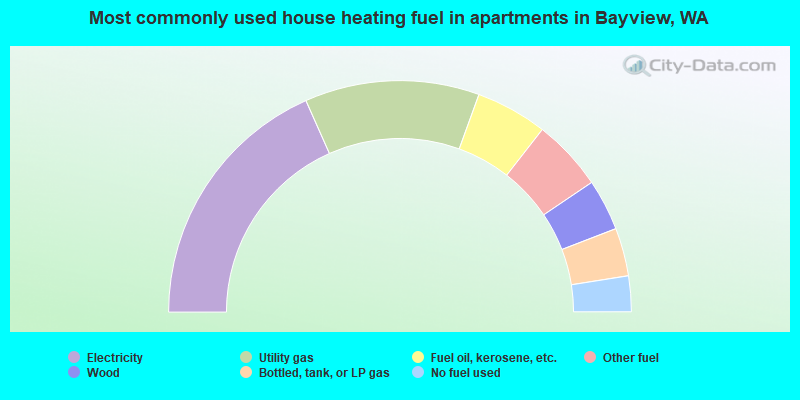
- 36.7%Electricity
- 24.4%Utility gas
- 10.0%Fuel oil, kerosene, etc.
- 10.0%Other fuel
- 7.2%Wood
- 6.7%Bottled, tank, or LP gas
- 5.0%No fuel used
Private vs. public school enrollment:
| Here: | 5.7% |
| Washington: | 9.2% |
| Here: | 0.0% |
| Washington: | 7.0% |
| Here: | 0.0% |
| Washington: | 15.7% |


