Bayview, Washington (WA) income map, earnings map, and wages data
The median household income in Bayview, WA in 2022 was $105,138, which was 13.2% greater than the median annual income of $91,306 across the entire state of Washington. Compared to the median income of $56,403 in 2000 this represents an increase of 46.4%. The per capita income in 2022 was $72,113, which means an increase of 46.4% compared to 2000 when it was $38,634.
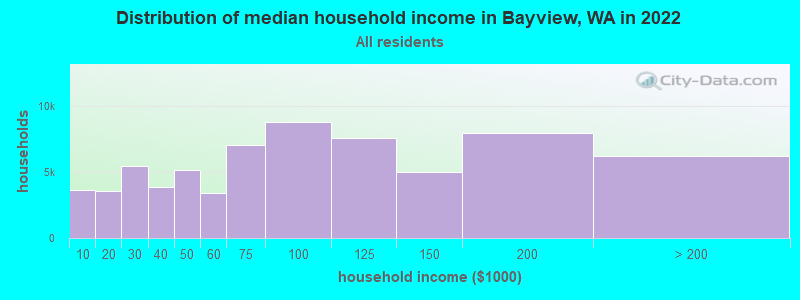
Income statistics for all residents
Median household income in Bayview, WA in 2022:| Bayview: | $105,139 |
| State: | $91,306 |
Change in median household income between 2000 and 2022:| Bayview, Washington: | +86.4% |
| State: | +99.5% |
Number of households with income < $10k:| Bayview: | 5.4% (3,674) |
| Washington: | 4.5% (139,331) |
Number of households with income $10k - 20k:| Bayview: | 5.2% (3,529) |
| State: | 5.0% (154,508) |
Number of households with income $20k - 30k:| Bayview: | 8.0% (5,422) |
| State: | 5.4% (166,555) |
Number of households with income $30k - 40k:| Bayview: | 5.7% (3,833) |
| Washington: | 5.5% (170,324) |
Number of households with income $40k - 50k:| Bayview: | 7.6% (5,133) |
| Washington: | 6.0% (183,941) |
Number of households with income $50k - 60k:| Bayview: | 5.0% (3,380) |
| State: | 6.1% (187,395) |
Number of households with income $60k - 75k:| Bayview: | 10.5% (7,084) |
| State: | 8.7% (266,771) |
Number of households with income $75k - 100k:| Bayview: | 13.0% (8,792) |
| State: | 13.1% (404,672) |
Number of households with income $100k - 125k:| Bayview: | 11.2% (7,583) |
| State: | 11.0% (337,911) |
Number of households with income $125k - 150k:| Bayview: | 7.4% (4,985) |
| State: | 8.0% (244,934) |
Number of households with income $150k - 200k:| Bayview: | 11.8% (7,973) |
| Washington: | 10.5% (323,812) |
Number of households with income > $200k:| Bayview: | 9.2% (6,242) |
| State: | 16.2% (499,799) |
Aggregate household income in Bayview in 2022: $305,137,989
Median family income in Bayview in 2022:| Bayview: | $130,678 |
| State: | $109,192 |
Median non-family income in Bayview in 2022:| Bayview: | $64,514 |
| State: | $57,299 |
Change in median non-family income between 2000 and 2022:| Bayview, Washington: | +59.1% |
| State: | +94.9% |
Median per capita income in Bayview in 2022:| Bayview: | $72,113 |
| Washington: | $50,764 |
Change in median per capita income between 2000 and 2022:| Bayview, Washington: | +86.7% |
| State: | +121.0% |
Income statistics for White residents
Median household income in Bayview, WA in 2022:| Bayview: | $102,453 |
| Washington: | $91,916 |
Change in median household income between 2000 and 2022:| Bayview, Washington: | +84.1% |
| State: | +95.4% |
Number of households with income < $10k:| Bayview: | 5.0% (2,707) |
| Washington: | 4.3% (95,850) |
Number of households with income $10k - 20k:| Bayview: | 5.0% (2,691) |
| State: | 4.8% (106,421) |
Number of households with income $20k - 30k:| Bayview: | 7.9% (4,279) |
| State: | 5.5% (122,860) |
Number of households with income $30k - 40k:| Bayview: | 6.0% (3,271) |
| State: | 5.4% (119,627) |
Number of households with income $40k - 50k:| Bayview: | 8.3% (4,511) |
| Washington: | 5.9% (132,276) |
Number of households with income $50k - 60k:| Bayview: | 4.6% (2,492) |
| State: | 6.1% (136,212) |
Number of households with income $60k - 75k:| Bayview: | 10.2% (5,507) |
| State: | 8.8% (196,086) |
Number of households with income $75k - 100k:| Bayview: | 12.6% (6,802) |
| Washington: | 13.4% (299,192) |
Number of households with income $100k - 125k:| Bayview: | 10.7% (5,772) |
| State: | 11.3% (252,209) |
Number of households with income $125k - 150k:| Bayview: | 7.1% (3,865) |
| Washington: | 7.9% (175,962) |
Number of households with income $150k - 200k:| Bayview: | 12.4% (6,694) |
| State: | 10.7% (239,156) |
Number of households with income > $200k:| Bayview: | 10.2% (5,505) |
| State: | 16.1% (359,917) |
Aggregate household income in Bayview in 2022: $269,451,157
Median family income in Bayview in 2022:| Bayview: | $126,571 |
| State: | $112,511 |
Number of families with income < $10k:| Bayview: | 0.8% (11) |
| State: | 2.4% (33,676) |
Number of families with income $10k - 20k:| Bayview: | 0.7% (10) |
| State: | 2.0% (28,228) |
Number of families with income $20k - 30k:| Bayview: | 2.3% (33) |
| State: | 2.9% (39,288) |
Number of families with income $30k - 40k:| Bayview: | 2.8% (40) |
| Washington: | 3.6% (50,190) |
Number of families with income $40k - 50k:| Bayview: | 4.0% (57) |
| Washington: | 4.6% (63,009) |
Number of families with income $50k - 60k:| Bayview: | 2.9% (41) |
| Washington: | 5.0% (69,270) |
Number of families with income $60k - 75k:| Bayview: | 6.5% (92) |
| Washington: | 8.2% (112,369) |
Number of families with income $75k - 100k:| Bayview: | 13.7% (195) |
| Washington: | 14.1% (194,214) |
Number of families with income $100k - 125k:| Bayview: | 19.6% (279) |
| State: | 13.2% (182,184) |
Number of families with income $125k - 150k:| Bayview: | 2.0% (28) |
| State: | 9.5% (130,928) |
Number of families with income $150k - 200k:| Bayview: | 13.5% (192) |
| Washington: | 13.7% (188,621) |
Number of families with income > $200k:| Bayview: | 31.2% (443) |
| State: | 20.8% (285,982) |
Median non-family income in Bayview in 2022:| Bayview: | $65,382 |
| State: | $56,103 |
Change in median non-family income between 2000 and 2022:| Bayview, Washington: | +60.0% |
| Washington: | +87.7% |
Median per capita income in Bayview in 2022:| Bayview: | $79,340 |
| State: | $55,212 |
Change in median per capita income between 2000 and 2022:| Bayview, Washington: | +92.7% |
| Washington: | +123.8% |
Income statistics for Asian residents
Number of households with income < $10k:| Bayview: | 5.0% (788) |
| State: | 4.9% (14,099) |
Number of households with income $10k - 20k:| Bayview: | 3.5% (551) |
| State: | 3.5% (9,873) |
Number of households with income $20k - 30k:| Bayview: | 2.9% (467) |
| State: | 2.9% (8,352) |
Number of households with income $30k - 40k:| Bayview: | 4.0% (638) |
| State: | 4.0% (11,415) |
Number of households with income $40k - 50k:| Bayview: | 4.0% (638) |
| State: | 4.0% (11,421) |
Number of households with income $50k - 60k:| Bayview: | 4.2% (676) |
| Washington: | 4.2% (12,100) |
Number of households with income $60k - 75k:| Bayview: | 6.3% (1,000) |
| State: | 6.3% (17,903) |
Number of households with income $75k - 100k:| Bayview: | 10.4% (1,657) |
| State: | 10.4% (29,663) |
Number of households with income $100k - 125k:| Bayview: | 9.4% (1,499) |
| Washington: | 9.4% (26,839) |
Number of households with income $125k - 150k:| Bayview: | 8.5% (1,352) |
| Washington: | 8.5% (24,200) |
Number of households with income $150k - 200k:| Bayview: | 12.6% (2,010) |
| State: | 12.6% (35,976) |
Number of households with income > $200k:| Bayview: | 29.2% (4,642) |
| State: | 29.2% (83,109) |
Median per capita income in Bayview in 2022:| Bayview: | $4,599 |
| State: | $67,666 |
Change in median per capita income between 2000 and 2022:| Bayview, Washington: | +104.4% |
| State: | +236.0% |
Income statistics for Hispanic or Latino residents
Median household income in Bayview, WA in 2022:| Bayview: | $144,580 |
| State: | $74,770 |
Change in median household income between 2000 and 2022:| Bayview, Washington: | +118.2% |
| State: | +128.3% |
Number of households with income < $10k:| Bayview: | 4.9% (14,517) |
| Washington: | 4.9% (14,456) |
Number of households with income $10k - 20k:| Bayview: | 5.3% (15,630) |
| State: | 5.3% (15,449) |
Number of households with income $20k - 30k:| Bayview: | 6.8% (20,221) |
| State: | 6.8% (20,016) |
Number of households with income $30k - 40k:| Bayview: | 7.7% (22,795) |
| State: | 7.7% (22,548) |
Number of households with income $40k - 50k:| Bayview: | 7.3% (21,736) |
| State: | 7.3% (21,450) |
Number of households with income $50k - 60k:| Bayview: | 7.7% (22,956) |
| State: | 7.7% (22,744) |
Number of households with income $60k - 75k:| Bayview: | 10.4% (30,952) |
| Washington: | 10.5% (30,737) |
Number of households with income $75k - 100k:| Bayview: | 14.9% (44,122) |
| State: | 14.9% (43,843) |
Number of households with income $100k - 125k:| Bayview: | 11.1% (32,910) |
| State: | 11.1% (32,554) |
Number of households with income $125k - 150k:| Bayview: | 7.4% (21,799) |
| Washington: | 7.4% (21,624) |
Number of households with income $150k - 200k:| Bayview: | 7.3% (21,561) |
| State: | 7.3% (21,360) |
Number of households with income > $200k:| Bayview: | 9.2% (27,296) |
| State: | 9.2% (27,055) |
Aggregate household income in Bayview in 2022: $4,939,271
Median family income in Bayview in 2022:| Bayview: | $160,576 |
| State: | $76,866 |
Number of families with income < $10k:| Bayview: | 2.2% (4) |
| Washington: | 4.4% (9,443) |
Number of families with income $10k - 20k:| Bayview: | 1.7% (3) |
| State: | 3.5% (7,524) |
Number of families with income $20k - 30k:| Bayview: | 4.8% (8) |
| Washington: | 5.6% (12,052) |
Number of families with income $30k - 40k:| Bayview: | 7.8% (14) |
| Washington: | 8.3% (17,803) |
Number of families with income $40k - 50k:| Bayview: | 8.8% (15) |
| State: | 7.7% (16,361) |
Number of families with income $50k - 60k:| Bayview: | 6.0% (10) |
| Washington: | 7.9% (16,852) |
Number of families with income $60k - 75k:| Bayview: | 7.4% (13) |
| State: | 11.4% (24,342) |
Number of families with income $75k - 100k:| Bayview: | 14.1% (25) |
| State: | 14.4% (30,698) |
Number of families with income $100k - 125k:| Bayview: | 16.6% (29) |
| State: | 11.4% (24,331) |
Number of families with income $125k - 150k:| Bayview: | 1.7% (3) |
| Washington: | 7.5% (16,099) |
Number of families with income $150k - 200k:| Bayview: | 4.8% (8) |
| Washington: | 8.2% (17,551) |
Number of families with income > $200k:| Bayview: | 24.2% (42) |
| Washington: | 9.7% (20,653) |
Median per capita income in Bayview in 2022:| Bayview: | $29,365 |
| Washington: | $28,252 |
Income statistics for American Indian and Alaska Native residents
Median household income in Bayview, WA in 2022:| Bayview: | $224,947 |
| State: | $71,255 |
Number of households with income < $10k:| Bayview: | 5.9% (2,004) |
| State: | 5.9% (1,768) |
Number of households with income $10k - 20k:| Bayview: | 9.0% (3,059) |
| State: | 8.9% (2,694) |
Number of households with income $20k - 30k:| Bayview: | 8.0% (2,706) |
| State: | 8.0% (2,412) |
Number of households with income $30k - 40k:| Bayview: | 7.7% (2,622) |
| State: | 7.7% (2,327) |
Number of households with income $40k - 50k:| Bayview: | 5.9% (2,004) |
| State: | 5.8% (1,755) |
Number of households with income $50k - 60k:| Bayview: | 7.5% (2,549) |
| State: | 7.5% (2,259) |
Number of households with income $60k - 75k:| Bayview: | 8.8% (3,006) |
| Washington: | 8.8% (2,669) |
Number of households with income $75k - 100k:| Bayview: | 12.7% (4,334) |
| Washington: | 12.8% (3,861) |
Number of households with income $100k - 125k:| Bayview: | 12.0% (4,090) |
| State: | 12.0% (3,618) |
Number of households with income $125k - 150k:| Bayview: | 8.6% (2,921) |
| State: | 8.6% (2,580) |
Number of households with income $150k - 200k:| Bayview: | 5.9% (1,997) |
| State: | 5.9% (1,774) |
Number of households with income > $200k:| Bayview: | 8.0% (2,735) |
| State: | 8.1% (2,447) |
Aggregate household income in Bayview in 2022: $2,261,331
Median family income in Bayview in 2022:| Bayview: | $261,477 |
| State: | $79,010 |
Number of families with income $60k - 75k:| Bayview: | 100.0% (16) |
| State: | 10.5% (2,124) |
Median per capita income in Bayview in 2022:| Bayview: | $75,388 |
| State: | $27,053 |
Income statistics for Multirace residents
Median household income in Bayview, WA in 2022:| Bayview: | $163,436 |
| State: | $84,303 |
Number of households with income < $10k:| Bayview: | 9.3% (493) |
| Washington: | 4.3% (12,040) |
Number of households with income $10k - 20k:| Bayview: | 5.8% (308) |
| State: | 6.6% (18,437) |
Number of households with income $20k - 30k:| Bayview: | 7.5% (398) |
| State: | 5.2% (14,559) |
Number of households with income $30k - 40k:| Bayview: | 3.2% (172) |
| Washington: | 6.7% (18,491) |
Number of households with income $40k - 50k:| Bayview: | 3.4% (179) |
| State: | 6.3% (17,459) |
Number of households with income $50k - 60k:| Bayview: | 5.3% (280) |
| Washington: | 6.9% (19,086) |
Number of households with income $60k - 75k:| Bayview: | 9.8% (520) |
| State: | 9.1% (25,310) |
Number of households with income $75k - 100k:| Bayview: | 7.1% (374) |
| Washington: | 13.5% (37,493) |
Number of households with income $100k - 125k:| Bayview: | 20.3% (1,074) |
| Washington: | 10.7% (29,626) |
Number of households with income $125k - 150k:| Bayview: | 9.8% (521) |
| State: | 8.6% (23,899) |
Number of households with income $150k - 200k:| Bayview: | 13.6% (718) |
| State: | 10.2% (28,214) |
Number of households with income > $200k:| Bayview: | 4.9% (258) |
| State: | 11.9% (32,947) |
Aggregate household income in Bayview in 2022: $15,216,322
Median family income in Bayview in 2022:| Bayview: | $251,309 |
| State: | $95,629 |
Number of families with income $75k - 100k:| Bayview: | 100.0% (85) |
| State: | 13.6% (23,984) |
Median non-family income in Bayview in 2022:| Bayview: | $54,251 |
| State: | $56,573 |
Change in median non-family income between 2000 and 2022:| Bayview, Washington: | +128.4% |
| Washington: | +115.0% |
Median per capita income in Bayview in 2022:| Bayview: | $27,339 |
| Washington: | $32,496 |
Income statistics for other residents
Number of households with income < $10k:| Bayview: | 3.6% (2) |
| Washington: | 5.3% (6,540) |
Number of households with income $10k - 20k:| Bayview: | 7.3% (4) |
| State: | 6.0% (7,385) |
Number of households with income $20k - 30k:| Bayview: | 9.1% (5) |
| Washington: | 7.5% (9,289) |
Number of households with income $30k - 40k:| Bayview: | 9.1% (5) |
| State: | 8.9% (11,015) |
Number of households with income $40k - 50k:| Bayview: | 9.1% (5) |
| Washington: | 7.6% (9,399) |
Number of households with income $50k - 60k:| Bayview: | 9.1% (5) |
| State: | 7.2% (8,867) |
Number of households with income $60k - 75k:| Bayview: | 9.1% (5) |
| State: | 10.5% (13,032) |
Number of households with income $75k - 100k:| Bayview: | 12.7% (7) |
| State: | 14.6% (18,007) |
Number of households with income $100k - 125k:| Bayview: | 12.7% (7) |
| Washington: | 12.2% (15,128) |
Number of households with income $125k - 150k:| Bayview: | 5.5% (3) |
| State: | 5.6% (6,950) |
Number of households with income $150k - 200k:| Bayview: | 5.5% (3) |
| State: | 7.1% (8,749) |
Number of households with income > $200k:| Bayview: | 7.3% (4) |
| State: | 7.5% (9,208) |
Aggregate household income in Bayview in 2022: $4,019,170
Median family income in Bayview in 2022:| Bayview: | $150,581 |
| State: | $72,588 |
Number of families with income $60k - 75k:| Bayview: | 100.0% (44) |
| State: | 10.3% (9,864) |
Median per capita income in Bayview in 2022:| Bayview: | $23,695 |
| State: | $27,542 |
Change in median per capita income between 2000 and 2022:| Bayview, Washington: | +148.9% |
| Washington: | +167.8% |