Barnard, TN (Tennessee) Houses and Residents
| Barnard: | $248,073 |
| Tennessee: | $284,800 |
Total population: 6,335 (Urban population: 0, Rural population: 6,173 (161 farm, 6,012 nonfarm))
Houses: 2,794 (2,454 occupied: 2,083 owner occupied, 371 renter occupied)
| % of renters here: | 15% |
| State: | 33% |
Housing density: 28 houses/condos per square mile
Median price asked for vacant for-sale houses and condos in 2022 in this county: $104,957.
Median contract rent in 2022: $686 (lower quartile is $652, upper quartile is $840)
Median rent asked for vacant for-rent units in 2022: $664
Median gross rent in Barnard, TN in 2022: $845
Housing units in Barnard with a mortgage: 552 (30 second mortgage, 62 home equity loan, 0 both second mortgage and home equity loan)
Houses without a mortgage: 593


Household type by relationship:
Households: 53,535- In family households: 45,521 (11,449 male householders, 4,001 female householders)
12,040 spouses, 13,638 children (12,232 natural, 497 adopted, 909 stepchildren), 1,678 grandchildren, 371 brothers or sisters, 401 parents, foster children, 521 other relatives, 1,064 non-relatives
- In nonfamily households: 8,014 (3,262 male householders (2,727 living alone)), 3,664 female householders (3,297 living alone)), 1,088 nonrelatives
- In group quarters: 646 (431 institutionalized population)
7,940 married couples with children.
2,357 single-parent households (556 men, 1,801 women).
97.8% of residents of Barnard speak English at home.
1.1% of residents speak Spanish at home (39% speak English very well, 14% speak English well, 47% speak English not well).
0.8% of residents speak other Indo-European language at home (79% speak English very well, 21% speak English not well).
0.3% of residents speak other language at home (100% speak English very well).
Foreign born population: 94 (1.3%)
(124.5% of them are naturalized citizens)
| Here: | 6.3 |
| State: | 6.5 |
| Here: | 6.1 |
| State: | 4.4 |
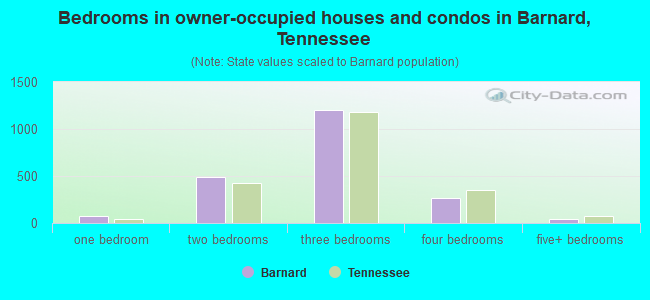
- Bedrooms in owner-occupied houses and condos in Barnard, Tennessee
- 0no bedroom
- 701 bedroom
- 4932 bedrooms
- 1,2023 bedrooms
- 2714 bedrooms
- 475+ bedrooms
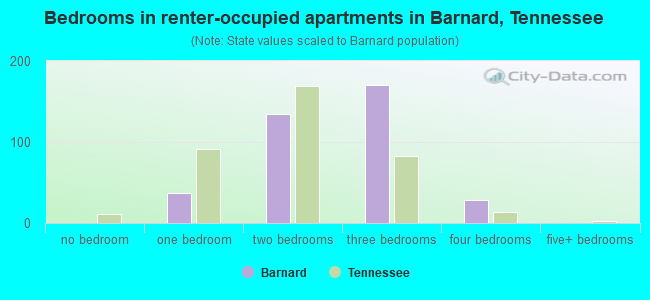
- Bedrooms in renter-occupied apartments in Barnard, Tennessee
- 0no bedroom
- 371 bedroom
- 1352 bedrooms
- 1703 bedrooms
- 294 bedrooms
- 05+ bedrooms
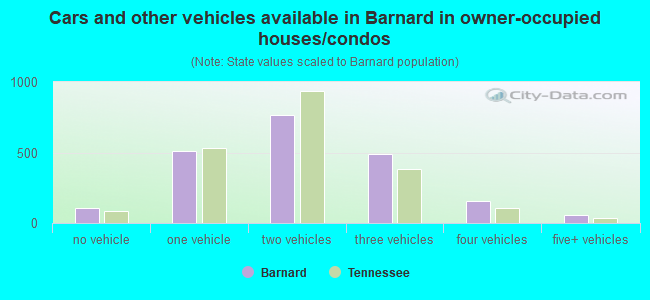
- Cars and other vehicles available in Barnard in owner-occupied houses/condos
- 104no vehicle
- 5081 vehicle
- 7692 vehicles
- 4913 vehicles
- 1544 vehicles
- 575+ vehicles
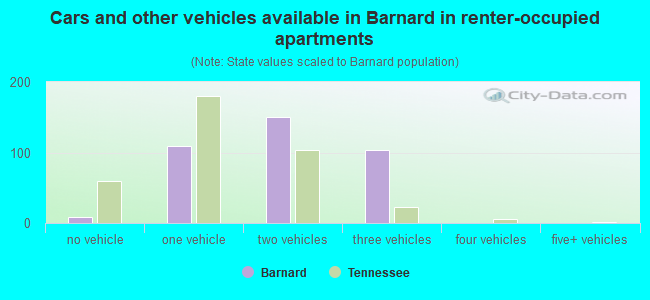
- Cars and other vehicles available in Barnard in renter-occupied apartments
- 9no vehicle
- 1091 vehicle
- 1502 vehicles
- 1033 vehicles
- 04 vehicles
- 05+ vehicles
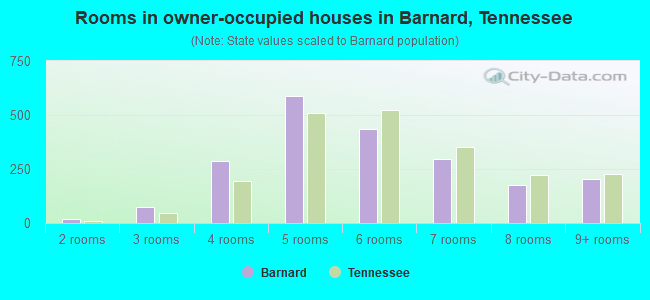
- Rooms in owner-occupied houses in Barnard, Tennessee
- 01 room
- 172 rooms
- 763 rooms
- 2894 rooms
- 5865 rooms
- 4376 rooms
- 2987 rooms
- 1788 rooms
- 2029+ rooms
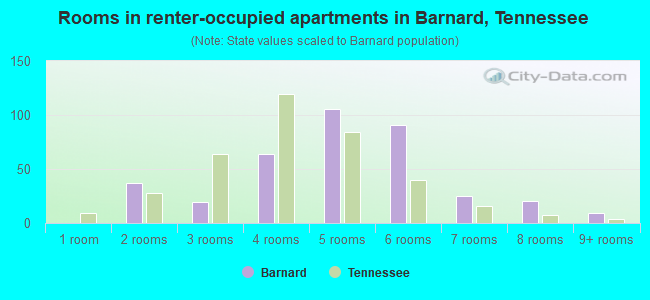
- Rooms in renter-occupied apartments in Barnard, Tennessee
- 01 room
- 372 rooms
- 193 rooms
- 644 rooms
- 1065 rooms
- 916 rooms
- 257 rooms
- 208 rooms
- 99+ rooms
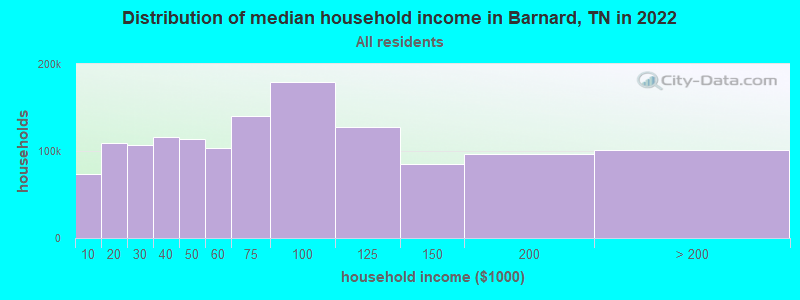
Barnard, TN household income distribution

- 48,621Less than $10,000
- 81,551$10,000 to $19,999
- 77,340$20,000 to $29,999
- 79,077$30,000 to $39,999
- 76,458$40,000 to $49,999
- 70,768$50,000 to $59,999
- 96,484$60,000 to $74,999
- 122,981$75,000 to $99,999
- 91,976$100,000 to $124,999
- 54,785$125,000 to $149,999
- 60,132$150,000 to $199,999
- 50,832$200,000 or more
Percentage of workers working in this county: 37.9%
Number of people working at home: 283 (9.8% of all workers)
Travel time to work (commute)
- Less than 5 minutes: 22
- 5 to 9 minutes: 54
- 10 to 14 minutes: 169
- 15 to 19 minutes: 260
- 20 to 24 minutes: 233
- 25 to 29 minutes: 310
- 30 to 34 minutes: 440
- 35 to 39 minutes: 171
- 40 to 44 minutes: 209
- 45 to 59 minutes: 441
- 60 to 89 minutes: 135
- 90 or more minutes: 23
Means of transportation to work:
- Drove a car alone: 2,142 (83.2%)
- Carpooled: 286 (11.1%)
- Bus or trolley bus: 8 (0.3%)
- Walked: 6 (0.2%)
- Other means: 25 (1.0%)
- Worked at home: 107 (4.2%)
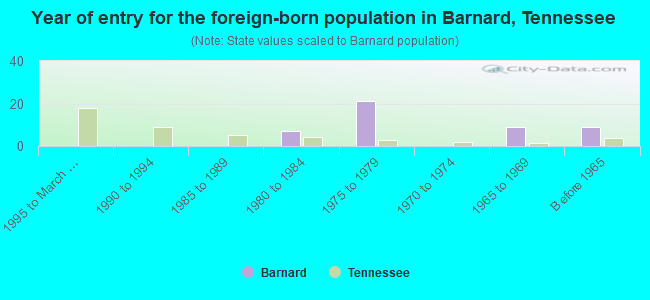
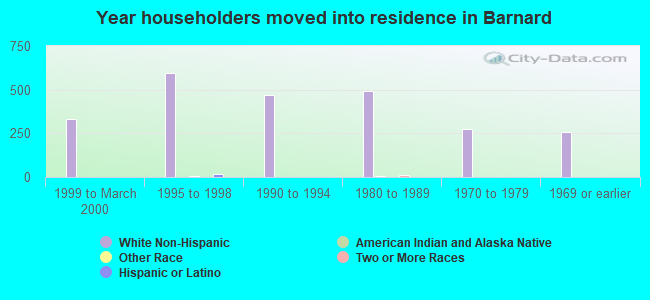
- Year of entry for the foreign-born population in Barnard, Tennessee
- 01995 to March 2000
- 01990 to 1994
- 01985 to 1989
- 71980 to 1984
- 211975 to 1979
- 01970 to 1974
- 91965 to 1969
- 9Before 1965
Most common places of birth for foreign-born residents (%):
| Barnard: | 45.7% (21) |
| Tennessee: | 1.1% (1,721) |
| Barnard: | 34.8% (16) |
| Tennessee: | 3.6% (5,726) |
| Barnard: | 19.6% (9) |
| Tennessee: | 0.9% (1,385) |
Place of birth for U.S.-born residents:
- This state: 4,533
- Other state: 1,559
- Northeast: 167
- Midwest: 439
- South: 784
- West: 169
66% of Barnard residents lived in the same house 5 years ago.
Out of people who lived in different houses, 52% lived in this county.
Out of people who lived in different counties, 50% lived in Tennessee.
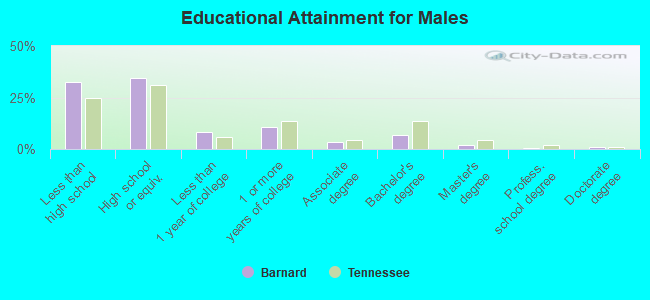
Education attainment for males 25 years and older:
- No schooling: 47
- Nursery to 4th grade: 8
- 5th and 6th grade: 149
- 7th and 8th grade: 167
- 9th grade: 86
- 10th grade: 74
- 11th grade: 97
- 12th grade, no diploma: 75
- High school graduate (or equivalency): 748
- Less than 1 year of college: 181
- Some college more than 1 year, no degree: 227
- Associate degree: 79
- Bachelor's degree: 149
- Master's degree: 46
- Professional school degree: 9
- Doctorate degree: 26
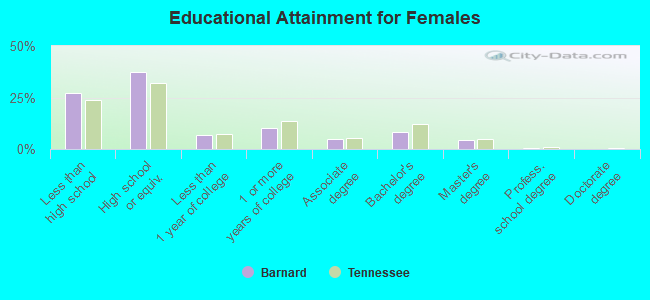
Education attainment for females 25 years and older:
- No schooling: 0
- Nursery to 4th grade: 8
- 5th and 6th grade: 67
- 7th and 8th grade: 186
- 9th grade: 97
- 10th grade: 109
- 11th grade: 70
- 12th grade, no diploma: 51
- High school graduate (or equivalency): 816
- Less than 1 year of college: 149
- Some college more than 1 year, no degree: 226
- Associate degree: 104
- Bachelor's degree: 179
- Master's degree: 95
- Professional school degree: 14
- Doctorate degree: 0
Housing units in structures:
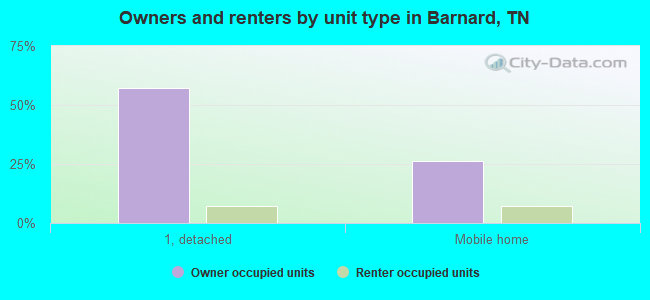
- One, detached: 1,804
- One, attached: 26
- Two: 14
- 5 to 9: 9
- 10 to 19: 9
- Mobile homes: 932
Median worth of mobile homes: $106,740
Housing units lacking complete kitchen facilities: 0.6%
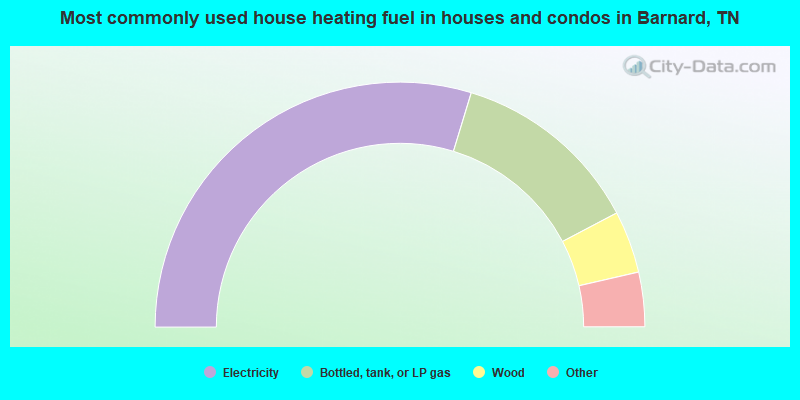
- 59.4%Electricity
- 25.2%Bottled, tank, or LP gas
- 8.2%Wood
- 3.3%Fuel oil, kerosene, etc.
- 2.3%Utility gas
- 1.6%No fuel used
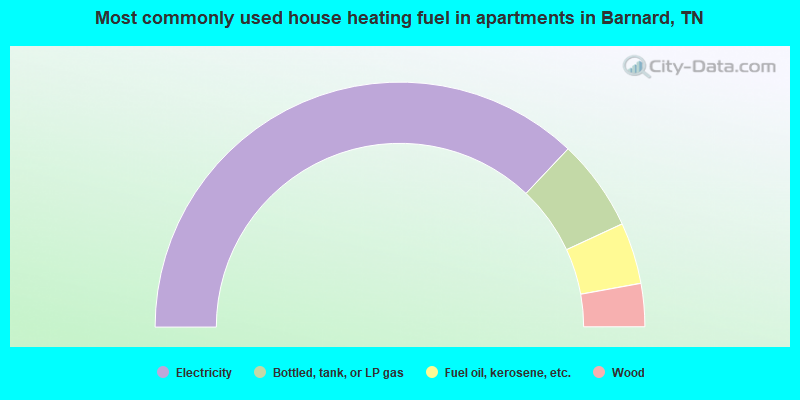
- 74.1%Electricity
- 12.1%Bottled, tank, or LP gas
- 8.1%Fuel oil, kerosene, etc.
- 5.7%Wood
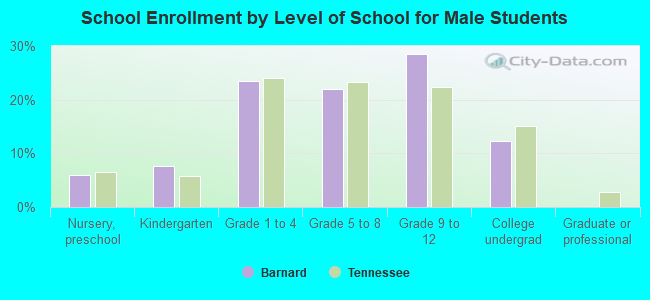
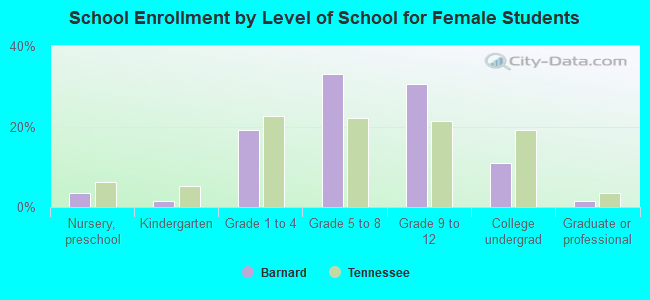
Private vs. public school enrollment:
| Here: | 11.6% |
| Tennessee: | 9.5% |
| Here: | 4.6% |
| Tennessee: | 10.4% |
| Here: | 0.0% |
| Tennessee: | 22.8% |