Please register to participate in our discussions with 2 million other members - it's free and quick! Some forums can only be seen by registered members. After you create your account, you'll be able to customize options and access all our 15,000 new posts/day with fewer ads.
It's in the top 5% of the whole population, which includes a lot of young people, students, unemployed, institutionalized, military, immigrants, minorities, and retired. For white families (husband, wife, kids) with jobs, it's just barely above average - last time I checked, the average for that group was over $90K.
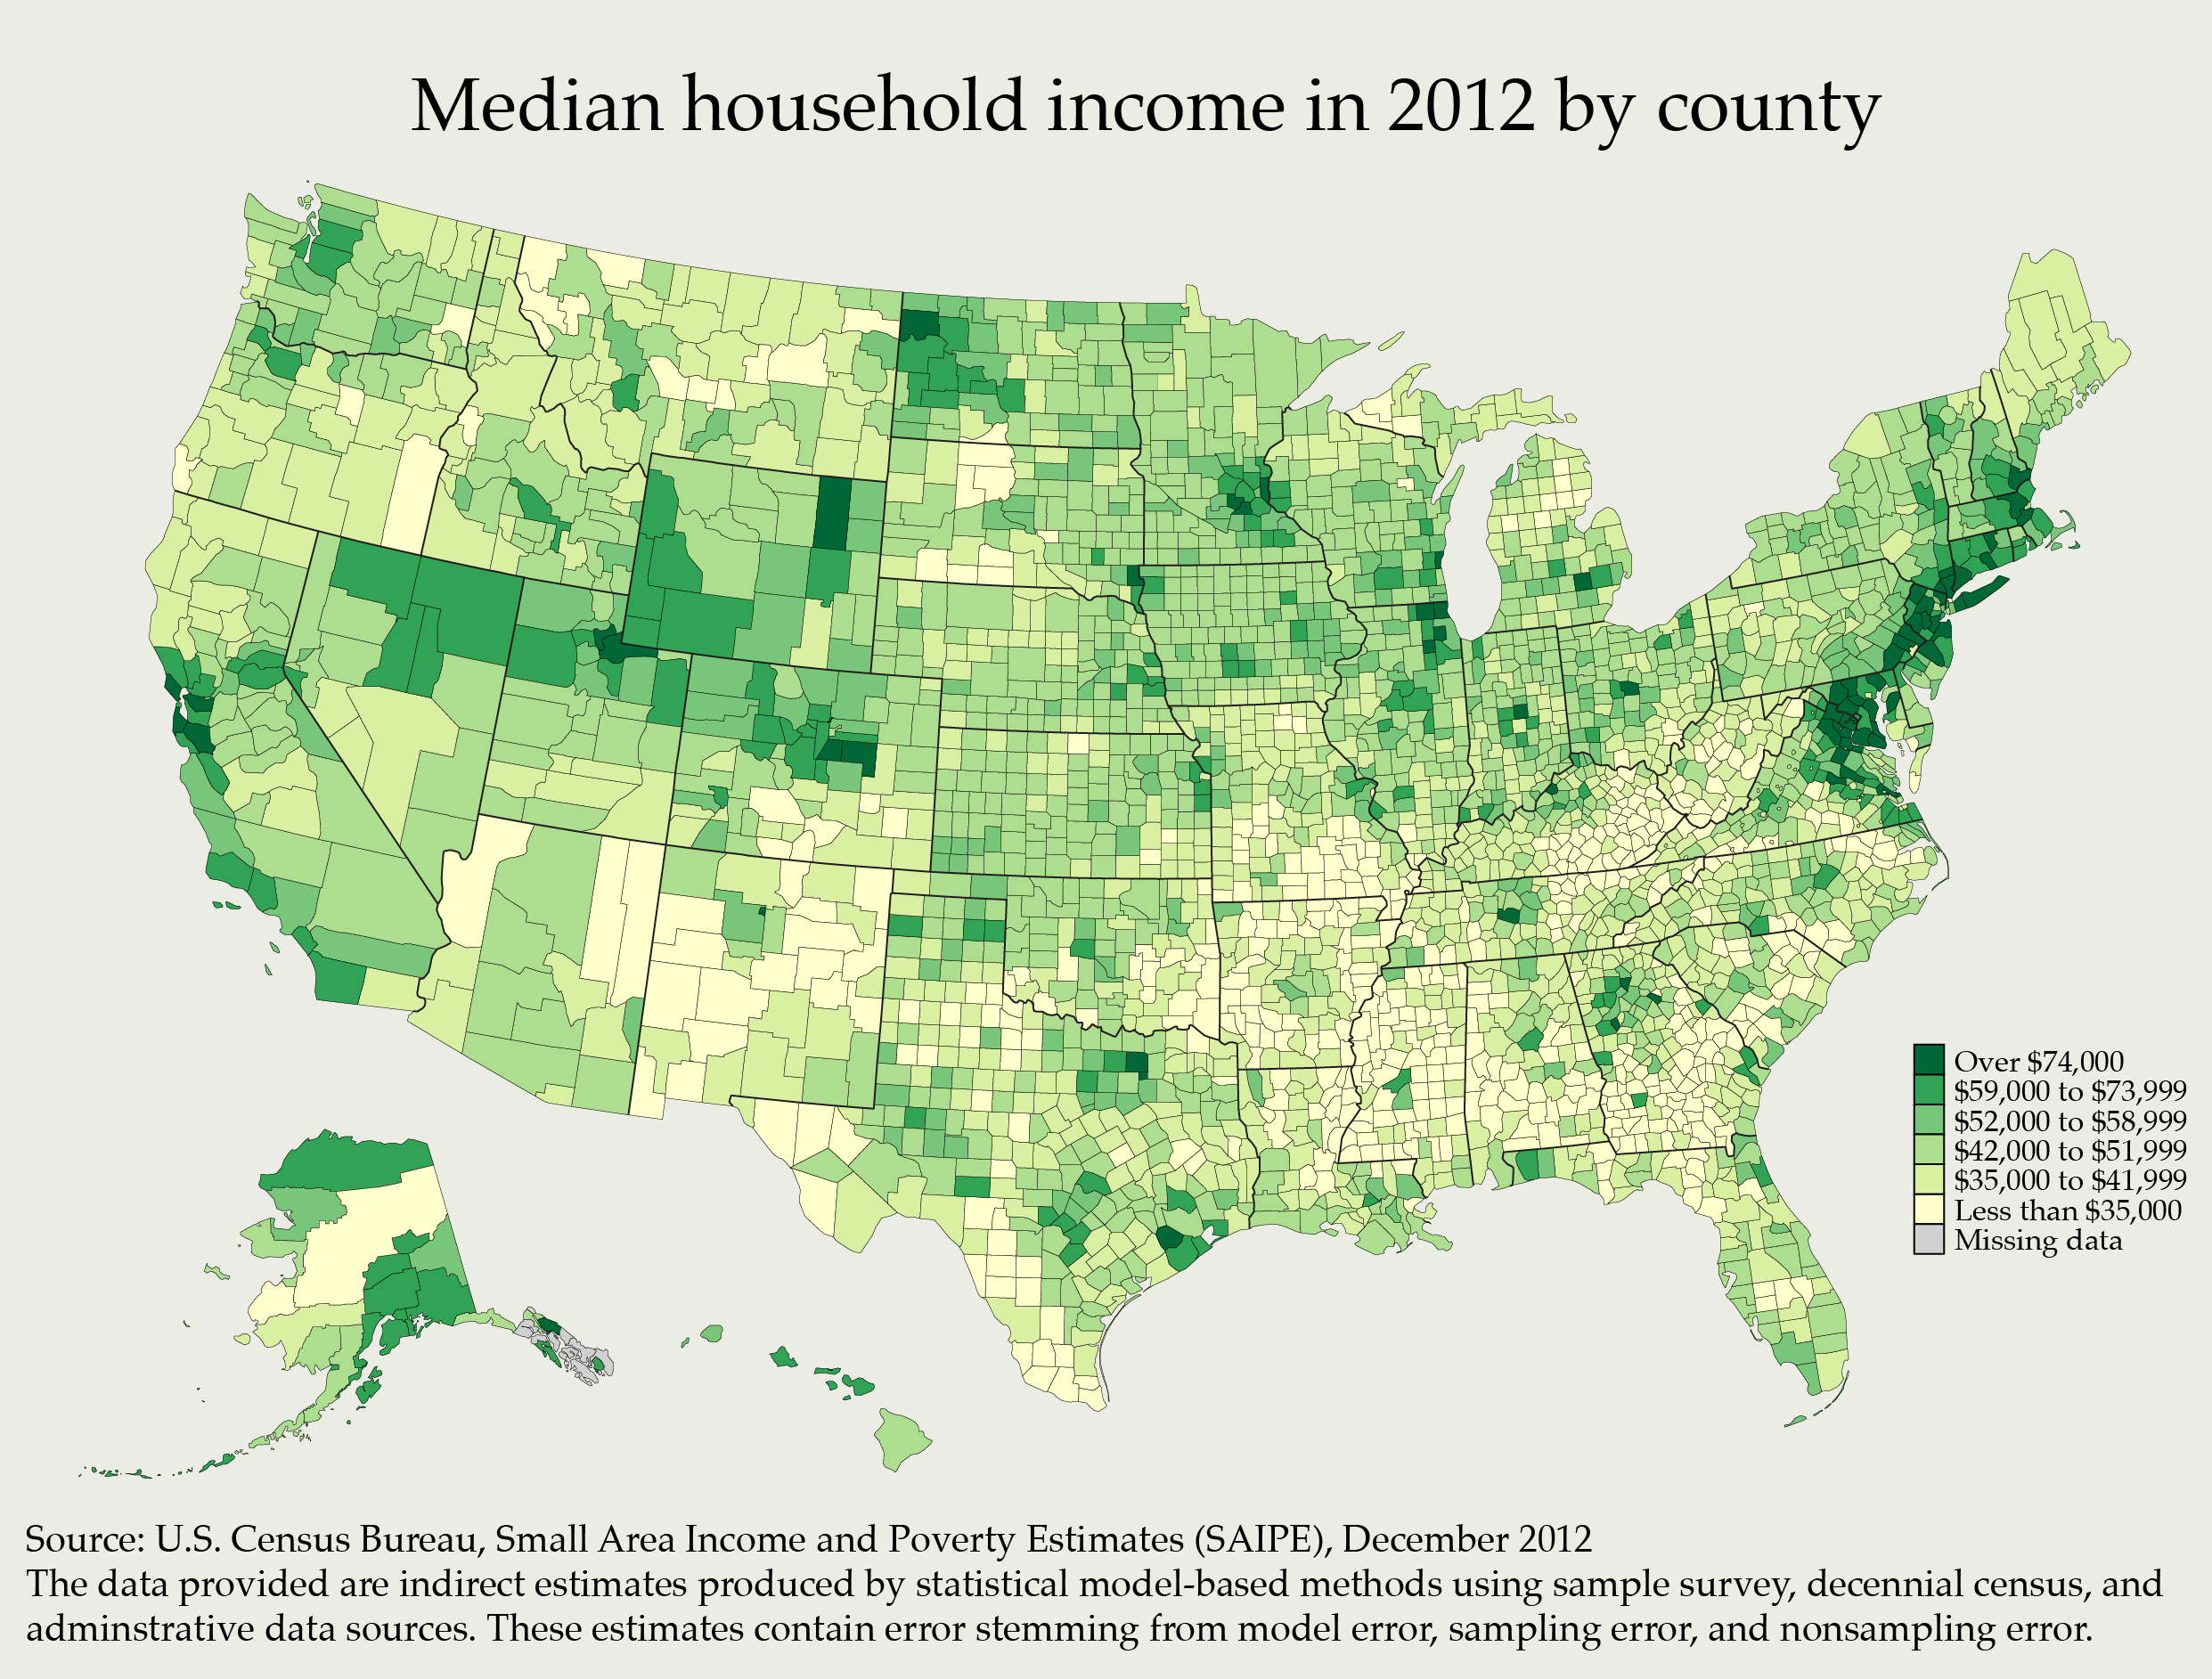
That's a pretty small group. The actual median family income in the US is a bit over $53,000. The only places that make a $90k median family income are geographically small areas on the east and west coasts, plus one county in Nebraska that Warren Buffet calls home. It's interesting to me that household income is down 7% since 2000. People have taken a big hit, and that goes a long way to explain middle class anger.
That's a pretty small group. The actual median family income in the US is a bit over $53,000. The only places that make a $90k median family income are geographically small areas on the east and west coasts, plus one county in Nebraska that Warren Buffet calls home. It's interesting to me that household income is down 7% since 2000. People have taken a big hit, and that goes a long way to explain middle class anger.
How could "white families with jobs" be a pretty small group? Your data is welcome, but the other poster was pointing out that median family income includes people who are students, retired, institutionalized, unemployed, etc. Therefore his "white families with jobs" was an interesting demographic.
How could "white families with jobs" be a pretty small group? Your data is welcome, but the other poster was pointing out that median family income includes people who are students, retired, institutionalized, unemployed, etc. Therefore his "white families with jobs" was an interesting demographic.
Thanks.
You don't choose to be white. I wish blacks, Hispanics, etc. had incomes as high as whites but they don't. Asians have on average higher incomes than whites.
But you do choose to be in an intact family. Singles make less money and drag the averages down...WAY down.
You don't choose to be white. I wish blacks, Hispanics, etc. had incomes as high as whites but they don't. Asians have on average higher incomes than whites.
But you do choose to be in an intact family. Singles make less money and drag the averages down...WAY down.
Larry, the reality that compounds much of this when discussing ethnic incomes is that average is being discussed. Actual individual incomes vary with members of all ethnic groups being in income classifications across the range. This creates misunderstanding and in some cases resentment when folks hear one thing and see another.
Larry. I understand the SSA chart did not include unearned income, (which in itself is a relatively small number) or retirees w/o income, which makes sense, and was for individuals....but it is NOT for the population as a whole. Look again. The $125k/year is the top 5% or earned income individuals, (only 158 million or so, where as the adult non retired population is a out 215 million) so based on your logic, as a percentage of the overall adult population, it is an even smaller percentage!!! AND the net compensation amounts include delayed pension and company match contributions, which means the actual salaries are even lower, as higher salaried people typically have even higher delayed payment benefits than low income people who typically have none! My delayed compensation benefit increases my apparant salary by more than 10%, which bumps me up a level or two in the chart. So the skew is even worse than the chart suggests.
And the graphic above is HOUSEHOLD incomes. In the more affluent sections shown it is more typical that the houshold consists of 2 high wage earners,mwhere as the poorer ones are a single low wage earner, possibly a single parent as well.
Looking at the graphic above it is obvious to me now that my personal observations are skewed because I typically ONLY ever spend much time in dark green locations.
Last edited by Perryinva; 05-29-2016 at 06:36 AM..
I understand the SSA chart did not include unearned income, and was for individuals....but it is NOT for the population as a whole. Look again. The $125k/year is the top 5% or earned income individuals, so based on your logic, as a percentage of the overall adult population, it is an even smaller percentage!!!
And the graphic above is HOUSEHOLD incomes. In the more affluent sections shown it is more typical that the houshold consists of 2 high wage earners,mwhere as the poorer ones are a single low wage earner, possibly a single parent as well.
Looking at the graphic above it is obvious to me now that my personal observations are skewed because I typically ONLY ever spend much time in dark green locations.
Yup, yup and yup. And consider those who spend little if any in the dark green areas. So what happens when they meet in a forum like this? Bada what they hey are you talking about! What the SSA chart does show when compared with data on overall annual income is that so much of it is out of the reach of SS taxation. Thus how much help will raising the cap on taxes be? Also as you know from living in the dark green area that many of the higher income folks are married to other higher income folks creating family income concentrations even more different than the light green areas. Add to the thought that pensions are not evenly distributed nationally nor are 401k plans and employer match opportunities. The darker green areas have more intense competition for higher end talent and the result is more higher end benefits. So how many in your neck of the woods during their working years in addition to earned income also had decent to very decent investment income not included in the SS tables?
Like you say...BADA BING...they of course are the ones that also have far higher investment balances. Which the earnings don't ever show up as earned income. Thats why Insaid it makes sense to not include retirees. I suspect that the percentage of well off retirees compared to retirees as a whole, is far higher than the same percentage of well off employed housholds of haves and haves nots. And will only increase as wealthier boomers continue to enter the retirement phase. Then that number will flip when the defined benefit retirees are replaced by the younger generation without.
Like you say...BADA BING...they of course are the ones that also have far higher investment balances. Which the earnings don't ever show up as earned income. Thats why Insaid it makes sense to not include retirees. I suspect that the percentage of well off retirees compared to retirees as a whole, is far higher than the same percentage of well off employed housholds of haves and haves nots. And will only increase as wealthier boomers continue to enter the retirement phase. Then that number will flip when the defined benefit retirees are replaced by the younger generation without.
Government is learning the consequences of containing salaries and benefits on employees. Shortages and competency issues are becoming greater in some places. Even the TSA lines at airports has roots in the changing workforce with unemployment dropping. Recruitment and retention of TSA agents is horrible. Salary and benefits are used for recruitment and retention. Teacher shortages are starting to crop up along with certification issues in various districts where austerity has cut the ability to recruit and retain. Not to mention tech and accounting government services.
Damn Larry Siegel and Larry Caldwell quoting each other is too confusing.
Please register to post and access all features of our very popular forum. It is free and quick. Over $68,000 in prizes has already been given out to active posters on our forum. Additional giveaways are planned.
Detailed information about all U.S. cities, counties, and zip codes on our site: City-data.com.

 Please register to participate in our discussions with 2 million other members - it's free and quick! Some forums can only be seen by registered members. After you create your account, you'll be able to customize options and access all our 15,000 new posts/day with fewer ads.