Yantis: Fire Incidents, Texas (TX)
Where are fire incidents reported in Yantis, TX
Something went wrong! Please refresh the page.
|
| |||||||||||||||||||||||||||||||||||||||||||||||||||||||||||||||||||||||||||||||||||||||||||||||||||||||||||||
2003 - 2018 National Fire Incident Reporting System (NFIRS) incidents
- Incident types reported to NFIRS in Yantis, TX
- 89654.8%Fire
- 29718.2%Rescue & EMS
- 29618.1%Good Intent Call
- 654.0%Service Call
- 623.8%Hazardous Condition
- 150.9%False Alarm
- 40.2%Special Incident
- Fire incident types reported to NFIRS in Yantis, TX
- 62569.8%Outside Fires
- 18921.1%Structure Fires
- 505.6%Mobile Property/Vehicle Fires
- 323.6%Other
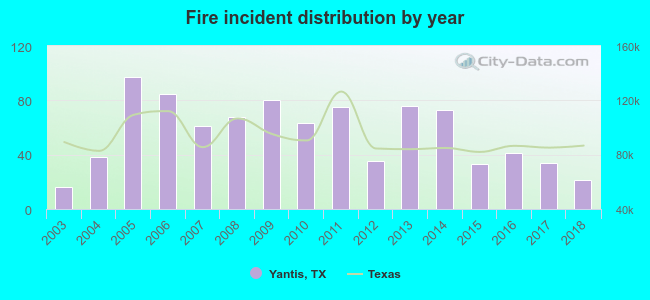 Based on the data from the years 2003 - 2018 the average number of fires per year is 56. The highest number of fire incidents - 97 took place in 2005, and the least - 16 in 2003. The data has a growing trend.
 The median response time based on all reported fire incidents is 6 minutes. This is about the same as the state median value.
The median response time in Yantis, TX compared to nearest cities:
(Note: Based on data for all years, including only cities with at least 500 fire incidents)
| Yantis: | 6 minutes |
| Emory: | 8 minutes |
| Quitman: | 9 minutes |
| Sulphur Springs: | 9 minutes |
| Winnsboro: | 10 minutes |
| Mineola: | 11 minutes |
| Grand Saline: | 8 minutes |
| Lone Oak: | 13 minutes |
| Campbell: | 13 minutes |
 23.8% incidents where reported in the morning and 76.2% in the evening. The most fires (18.3%) took place on Saturday, and the least (12.1%) on Tuesday.
 Based on the 896 reports from years 2003 - 2018 most fires (15.7%) took place during January, and the least (2.6%) in May.
 Out of all 1,635 cases reported during the years 2003 - 2018, the most belonged to the categories: Fire (54.8%), Overpressure Rupture (18.2%), and Service Call (18.1%).
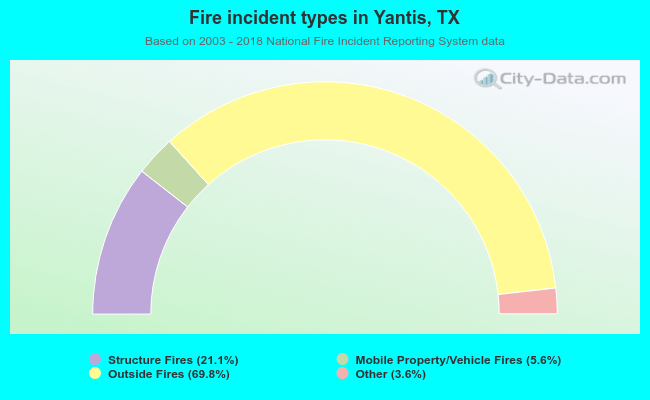 When looking into fire subcategories, the most reports belonged to: Outside Fires (69.8%), and Structure Fires (21.1%).