Sulphur Springs: Fire Incidents, Texas (TX)
Where are fire incidents reported in Sulphur Springs, TX
Something went wrong! Please refresh the page.
| Fire incidents reported | |
|---|---|
| Sreet name | Count |
| INTERSTATE 30 HWY | 380 |
| HIGHWAY 11 RD | 172 |
| HIGHWAY 19 RD | 100 |
| I-30 | 94 |
| INDUSTRIAL DR | 90 |
| HIGHWAY 154 RD | 88 |
| MAIN ST | 84 |
| FARM MARKET ROAD 71 RD | 70 |
| FARM MARKET ROAD 2297 RD | 64 |
| FARM MARKET ROAD 1567 RD | 62 |
| HWY 19 | 62 |
| FARM MARKET ROAD 69 RD | 60 |
| BROADWAY ST | 56 |
| CR 3341 | 52 |
| COLLEGE ST | 50 |
| HILLCREST DR | 50 |
| SHANNON RD | 48 |
| CHURCH ST | 46 |
| FM 1870 | 46 |
| COUNTY ROAD 2310 RD | 44 |
| HWY 11 | 44 |
| JEFFERSON ST | 44 |
| FARM MARKET ROAD 2560 RD | 42 |
| FARM MARKET ROAD 275 RD | 42 |
| FARM MARKET ROAD 900 RD | 42 |
| HOUSTON ST | 42 |
| INTERSTATE 30 | 40 |
| FARM MARKET ROAD 269 RD | 38 |
| IH 30 | 38 |
| HWY 154 | 36 |
| Other | 2,387 |
2002 - 2018 National Fire Incident Reporting System (NFIRS) incidents
- Incident types reported to NFIRS in Sulphur Springs, TX
- 5,58039.8%Rescue & EMS
- 4,51332.2%Fire
- 1,78912.8%Hazardous Condition
- 8245.9%Good Intent Call
- 7385.3%Service Call
- 5473.9%False Alarm
- 180.1%Special Incident
- 150.1%Overpressure Rupture
- Fire incident types reported to NFIRS in Sulphur Springs, TX
- 2,79762.0%Outside Fires
- 99322.0%Structure Fires
- 60013.3%Mobile Property/Vehicle Fires
- 1232.7%Other
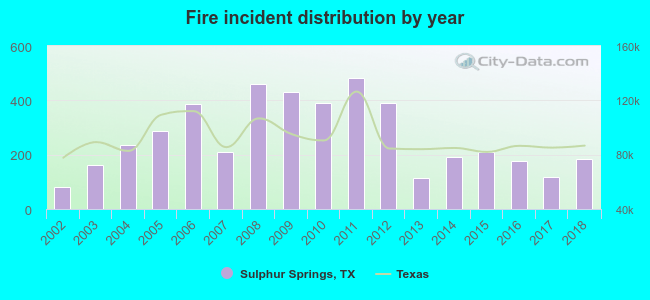 Based on the data from the years 2002 - 2018 the average number of fires per year is 265. The highest number of fires - 482 took place in 2011, and the least - 82 in 2002. The data has a growing trend.
The average number of yearly fire incidents per 10k residents in Sulphur Springs, TX compared to nearest cities:
(Note: Based on data for the last 3 years, including only cities with population 5,000 and above)
| Sulphur Springs: | 99.7 |
| Commerce: | 140.7 |
| Greenville: | 80.1 |
| Mount Pleasant: | 39.6 |
| Paris: | 75.2 |
| Royse City: | 121.2 |
| Lindale: | 274.4 |
| Bonham: | 63.3 |
| Gilmer: | 449.8 |
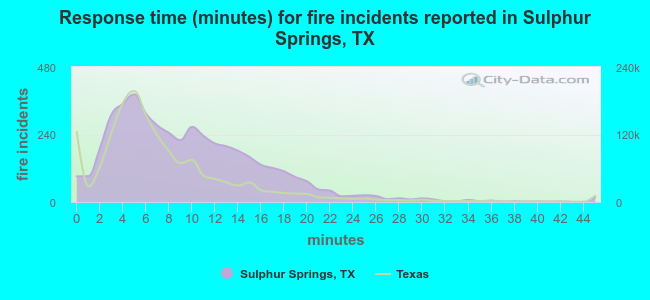 The median response time based on all reported fire incidents is 9 minutes. This is higher compared to the state median value.
The median response time in Sulphur Springs, TX compared to nearest cities:
(Note: Based on data for all years, including only cities with at least 500 fire incidents)
| Sulphur Springs: | 9 minutes |
| Yantis: | 6 minutes |
| Cooper: | 10 minutes |
| Commerce: | 5 minutes |
| Emory: | 8 minutes |
| Campbell: | 13 minutes |
| Winnsboro: | 10 minutes |
| Lone Oak: | 13 minutes |
| Quitman: | 9 minutes |
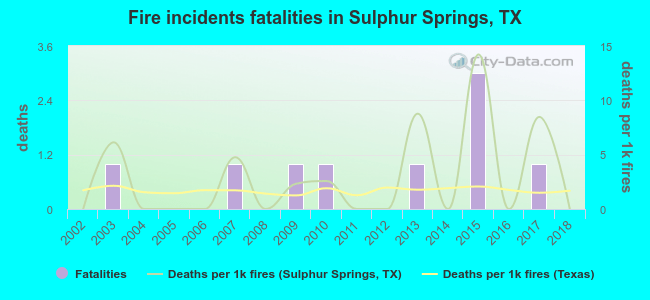 Based on the data from the years 2002 - 2018 the average number of fire-related fatalities per year is 1. The highest number of reported deaths - 3 took place in 2015, and the lowest - 0 in 2002. The data has a constant trend.
The average number of deaths per 1,000 fire incidents is 3. This indicator was the highest - 14 in 2015, and the lowest 0 in 2002. The trend for fatalities per 1,000 fires is constant. Compared to the state value the number of deaths per 1,000 fire incidents is about the same.
Based on the data from the years 2002 - 2018 the average number of fire-related fatalities per year is 1. The highest number of reported deaths - 3 took place in 2015, and the lowest - 0 in 2002. The data has a constant trend.
The average number of deaths per 1,000 fire incidents is 3. This indicator was the highest - 14 in 2015, and the lowest 0 in 2002. The trend for fatalities per 1,000 fires is constant. Compared to the state value the number of deaths per 1,000 fire incidents is about the same.Deaths per 1,000 incidents in Sulphur Springs, TX compared to nearest cities:
(Note: Based on data for all years, including only cities with at least 2,500 fire incidents)
| Sulphur Springs: | 2.0 |
| Greenville: | 2.1 |
| Paris: | 3.0 |
| Canton: | 2.4 |
| Lindale: | 0.7 |
| Gilmer: | 0.8 |
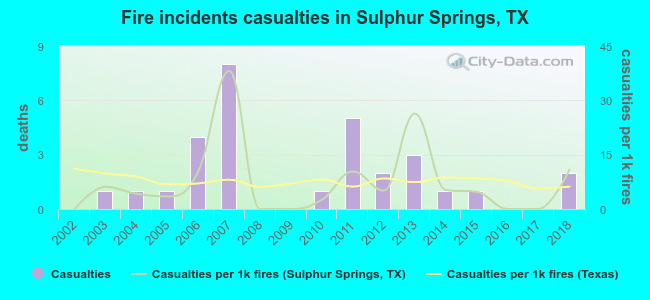 Based on the data from the years 2002 - 2018 the average number of fire-related casualties per year is 2. The highest number of casualties - 8 took place in 2007, and the lowest - 0 in 2002. The data has a growing trend.
The average number of injuries per 1,000 fire incidents is 7. This indicator was the highest - 38 in 2007, and the lowest 0 in 2002. The trend for casualties per 1,000 fires is rising. Compared to the state value the number of injuries per 1,000 fire incidents is similar.
Based on the data from the years 2002 - 2018 the average number of fire-related casualties per year is 2. The highest number of casualties - 8 took place in 2007, and the lowest - 0 in 2002. The data has a growing trend.
The average number of injuries per 1,000 fire incidents is 7. This indicator was the highest - 38 in 2007, and the lowest 0 in 2002. The trend for casualties per 1,000 fires is rising. Compared to the state value the number of injuries per 1,000 fire incidents is similar.
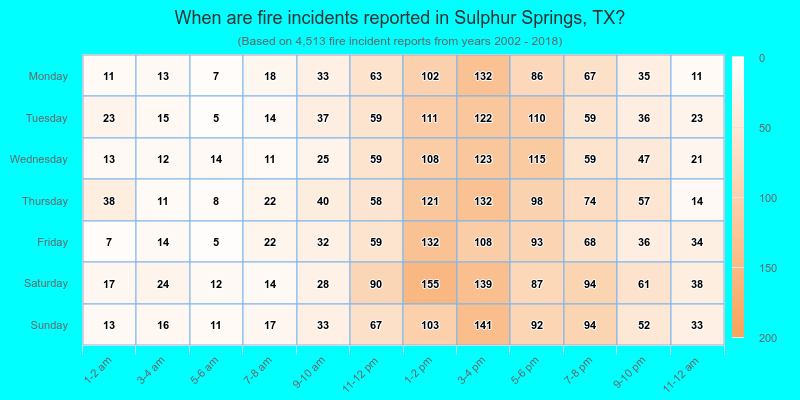
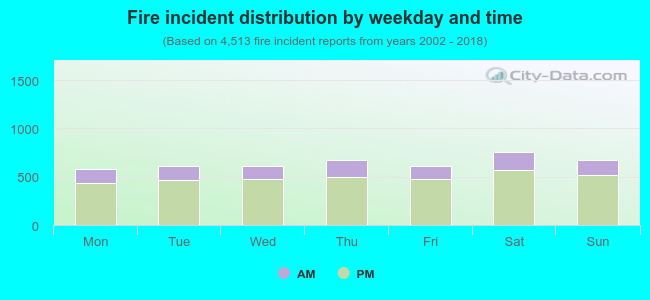 24.2% incidents where reported in the morning and 75.8% in the evening. The most fires (16.8%) took place on Saturday, and the least (12.8%) on Monday.
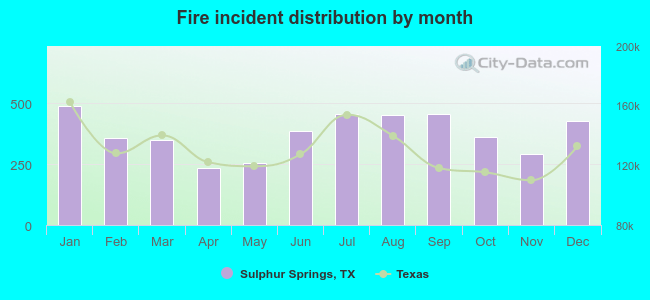 According to the 4,513 fires from years 2002 - 2018 most fires (10.9%) took place during January, and the least (5.2%) in April.
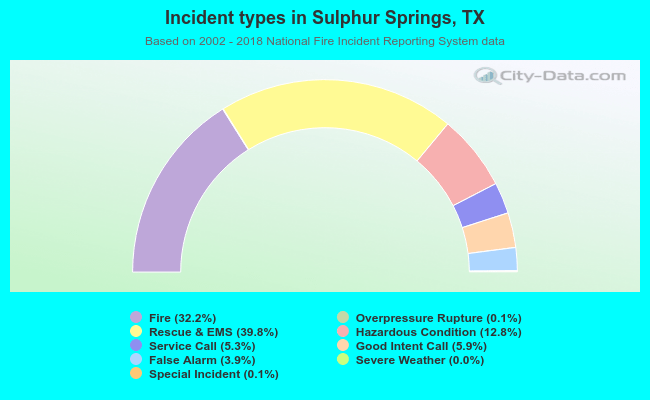 Out of all 14,029 cases reported during the years 2002 - 2018, the most belonged to the categories: Rescue & EMS (39.8%), Fire (32.2%), and Hazardous Condition (12.8%).
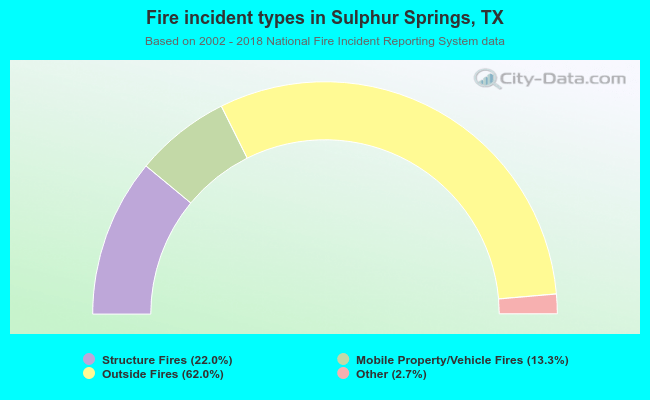 When looking into fire subcategories, the most reports belonged to: Outside Fires (62.0%), and Structure Fires (22.0%).