Xenia: Fire Incidents, Ohio (OH)
Where are fire incidents reported in Xenia, OH
Something went wrong! Please refresh the page.
| Fire incidents reported | |
|---|---|
| Sreet name | Count |
| MAIN ST | 174 |
| SECOND ST | 162 |
| DETROIT ST | 148 |
| STELTON RD | 94 |
| MARKET ST | 84 |
| THIRD ST | 74 |
| US68 | 60 |
| JASPER RD | 54 |
| BELLBROOK AVE | 50 |
| DEER CREEK DR | 50 |
| CINCINNATI AV | 48 |
| COLORADO DR | 48 |
| COLUMBUS ST | 48 |
| CHURCH ST | 46 |
| BELLBROOK AV | 40 |
| XENIA TOWNE SQ | 40 |
| BRUSH ROW RD | 38 |
| CHESTNUT ST | 38 |
| ALLISON AV | 34 |
| CINCINNATI AVE | 34 |
| GREENE LAKE DR | 34 |
| UNION RD | 32 |
| WYOMING DR | 32 |
| BICKETT RD | 30 |
| HOME AV | 30 |
| HOSPITALITY DR | 30 |
| JUNE DR | 30 |
| KINSEY RD | 30 |
| DAYTON AV | 28 |
| HOOK RD | 28 |
| Other | 764 |
2002 - 2018 National Fire Incident Reporting System (NFIRS) incidents
- Incident types reported to NFIRS in Xenia, OH
- 2,43223.6%Fire
- 2,28022.2%Hazardous Condition
- 2,00219.5%Rescue & EMS
- 1,73316.8%Good Intent Call
- 1,0229.9%False Alarm
- 7627.4%Service Call
- 250.2%Special Incident
- 210.2%Overpressure Rupture
- 160.2%Severe Weather
- Fire incident types reported to NFIRS in Xenia, OH
- 1,35455.7%Structure Fires
- 70428.9%Outside Fires
- 34714.3%Mobile Property/Vehicle Fires
- 271.1%Other
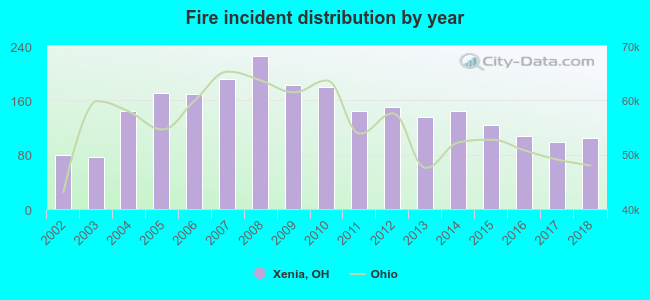 According to the data from the years 2002 - 2018 the average number of fires per year is 143. The highest number of reported fires - 225 took place in 2008, and the least - 76 in 2003. The data has a rising trend.
The average number of yearly fire incidents per 10k residents in Xenia, OH compared to nearest cities:
(Note: Based on data for the last 3 years, including only cities with population 5,000 and above)
| Xenia: | 40.1 |
| Beavercreek: | 4.4 |
| Bellbrook: | 10.0 |
| Fairborn: | 22.3 |
| Kettering: | 14.8 |
| Centerville: | 14.6 |
| Riverside: | 20.2 |
| Oakwood: | 46.2 |
| Dayton: | 44.3 |
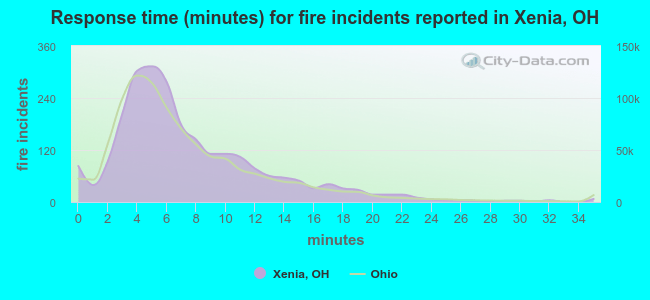 The median response time based on all reported fire incidents is 6 minutes. This is similar to the state median value.
The median response time in Xenia, OH compared to nearest cities:
(Note: Based on data for all years, including only cities with at least 500 fire incidents)
| Xenia: | 6 minutes |
| Beavercreek: | 6 minutes |
| Fairborn: | 6 minutes |
| Jamestown: | 11 minutes |
| Kettering: | 6 minutes |
| Centerville: | 7 minutes |
| Riverside: | 6 minutes |
| Oakwood: | 5 minutes |
| Dayton: | 5 minutes |
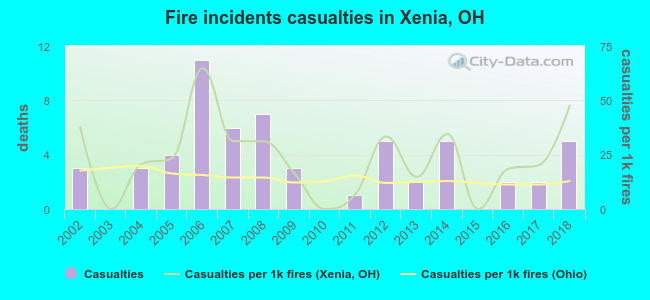 Based on the reports from the years 2002 - 2018 the average number of fire-related casualties per year is 3. The highest number of casualties - 11 took place in 2006, and the lowest - 0 in 2003. The data has an increasing trend.
The average number of injuries per 1,000 fire incidents is 24. This indicator was the highest - 65 in 2006, and the lowest 0 in 2003. The trend for casualties per 1,000 fires is increasing. Compared to the state value the number of injuries per 1,000 fires is higher.
Based on the reports from the years 2002 - 2018 the average number of fire-related casualties per year is 3. The highest number of casualties - 11 took place in 2006, and the lowest - 0 in 2003. The data has an increasing trend.
The average number of injuries per 1,000 fire incidents is 24. This indicator was the highest - 65 in 2006, and the lowest 0 in 2003. The trend for casualties per 1,000 fires is increasing. Compared to the state value the number of injuries per 1,000 fires is higher.Casualties per 1,000 incidents in Xenia, OH compared to nearest cities:
(Note: Based on data for all years, including only cities with at least 500 fire incidents)
| Xenia: | 24.3 |
| Beavercreek: | 36.2 |
| Fairborn: | 27.6 |
| Jamestown: | 2.7 |
| Kettering: | 25.7 |
| Centerville: | 33.9 |
| Riverside: | 19.3 |
| Oakwood: | 2.1 |
| Dayton: | 20.5 |
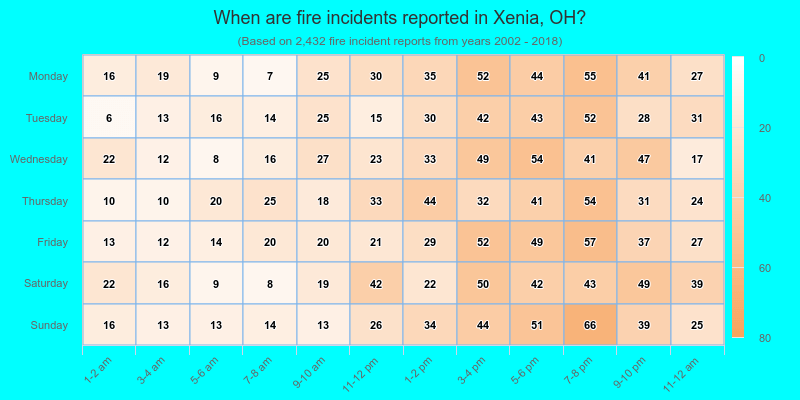
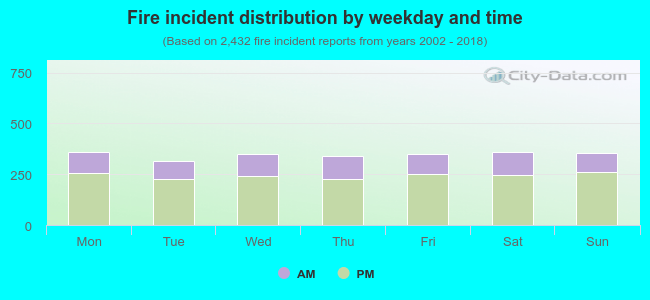 30.0% incidents where reported in the morning and 70.0% in the evening. The most fires (14.8%) took place on Saturday, and the least (13.0%) on Tuesday.
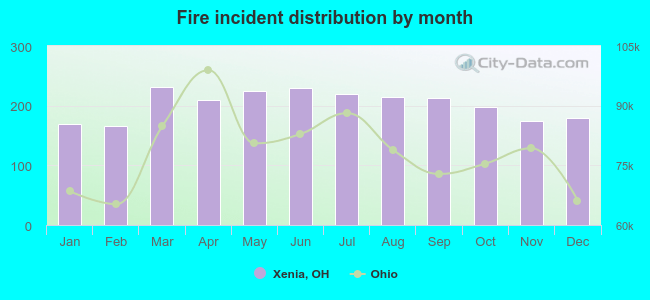 According to the 2,432 fires from years 2002 - 2018 most fires (9.5%) took place during March, and the least (6.8%) in February.
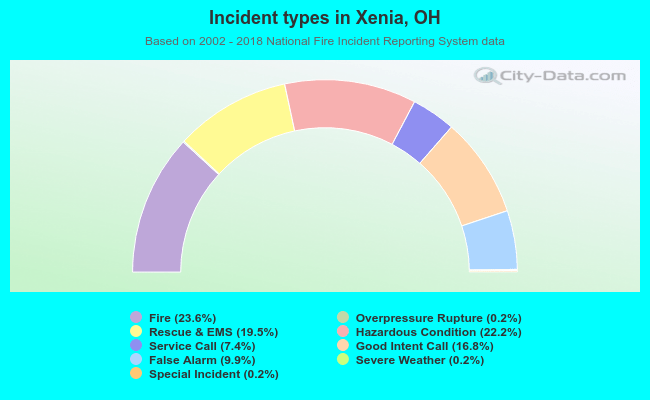 Out of all 10,293 cases reported during the years 2002 - 2018, the most belonged to the categories: Fire (23.6%), Hazardous Condition (22.2%), and Rescue & EMS (19.5%).
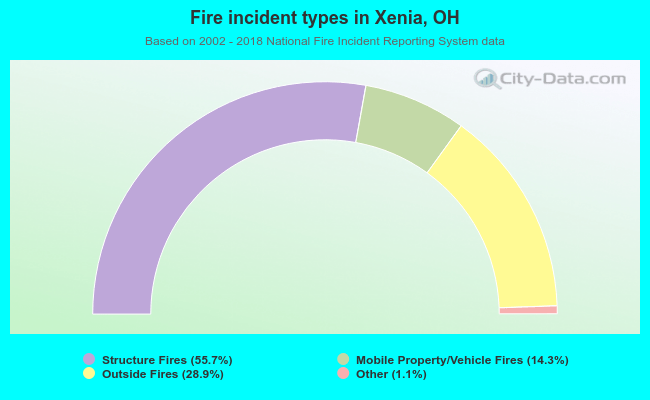 When looking into fire subcategories, the most reports belonged to: Structure Fires (55.7%), and Outside Fires (28.9%).