Wheeling: Fire Incidents, West Virginia (WV)
Where are fire incidents reported in Wheeling, WV
Something went wrong! Please refresh the page.
| Fire incidents reported | |
|---|---|
| Sreet name | Count |
| NATIONAL RD | 524 |
| MAIN ST | 210 |
| CHAPLINE ST | 152 |
| MARKET ST | 134 |
| WARWOOD AVE | 114 |
| EOFF ST | 98 |
| WASHINGTON AVE | 92 |
| JACOB ST | 78 |
| 15TH ST | 58 |
| EAGLE CT | 54 |
| HURON ST | 52 |
| WOOD ST | 46 |
| PENN ST | 42 |
| 14TH ST | 40 |
| BROADWAY ST | 38 |
| MEDICAL PARK RD | 34 |
| VIRGINIA ST | 34 |
| MCCOLLOCH ST | 32 |
| 29TH ST | 26 |
| 5TH ST | 24 |
| FRONT ST | 24 |
| PENINSULA ST | 24 |
| ZANE ST | 24 |
| 18TH ST | 20 |
| STONE CHURCH RD. | 20 |
| WABASH ST | 20 |
| 19TH ST | 18 |
| FRAZIER AVE | 18 |
| WATER ST | 18 |
| CARMEL RD | 16 |
| Other | 607 |
2003 - 2018 National Fire Incident Reporting System (NFIRS) incidents
- Incident types reported to NFIRS in Wheeling, WV
- 21,26452.2%Rescue & EMS
- 6,28115.4%Hazardous Condition
- 4,0269.9%Service Call
- 3,2598.0%Good Intent Call
- 2,9037.1%False Alarm
- 2,6916.6%Fire
- 2420.6%Overpressure Rupture
- Fire incident types reported to NFIRS in Wheeling, WV
- 1,51056.1%Structure Fires
- 66624.7%Outside Fires
- 42715.9%Mobile Property/Vehicle Fires
- 883.3%Other
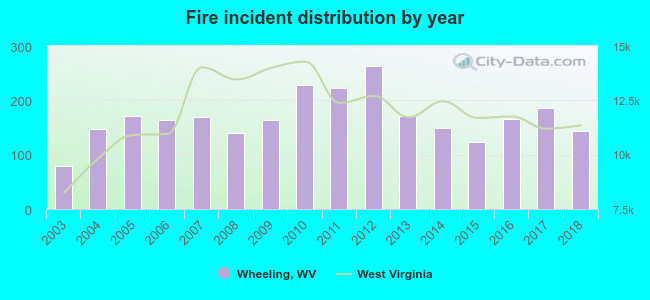 According to the data from the years 2003 - 2018 the average number of fires per year is 168. The highest number of reported fires - 264 took place in 2012, and the least - 80 in 2003. The data has a growing trend.
The average number of yearly fire incidents per 10k residents in Wheeling, WV compared to nearest cities:
(Note: Based on data for the last 3 years, including only cities with population 5,000 and above)
| Wheeling: | 59.4 |
| Moundsville: | 92.6 |
| Weirton: | 35.8 |
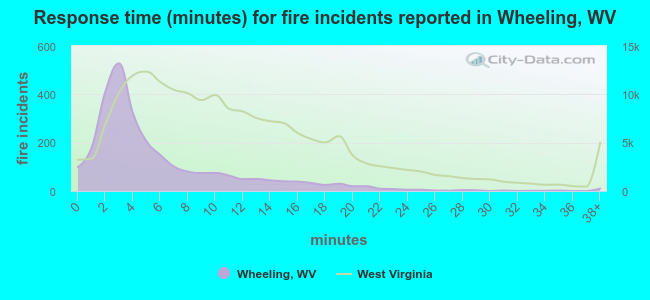 The median response time based on all reported fire incidents is 4 minutes. This is much lower compared to the West Virginia median value.
The median response time in Wheeling, WV compared to nearest cities:
(Note: Based on data for all years, including only cities with at least 500 fire incidents)
| Wheeling: | 4 minutes |
| Bridgeport: | 8 minutes |
| Martins Ferry: | 7 minutes |
| Bellaire: | 7 minutes |
| Moundsville: | 7 minutes |
| Wellsburg: | 8 minutes |
| Mingo Junction: | 6 minutes |
| Follansbee: | 6 minutes |
| Steubenville: | 3 minutes |
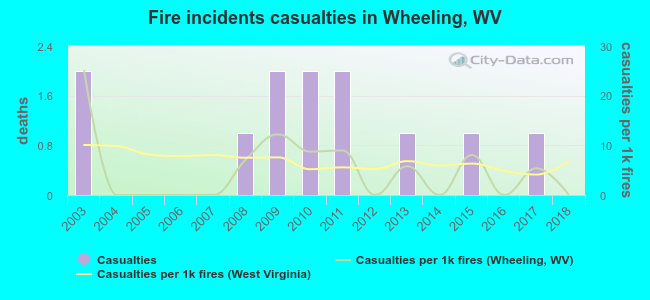 Based on the data from the years 2003 - 2018 the average number of fire-related yearly casualties is 1. The highest number of casualties - 2 took place in 2003, and the lowest - 0 in 2004. The data has a dropping trend.
The average number of injuries per 1,000 fire incidents is 5. This indicator was the highest - 25 in 2003, and the lowest 0 in 2004. The trend for casualties per 1,000 fires is declining. Compared to the West Virginia value the number of injuries per 1,000 fire incidents is lower.
Based on the data from the years 2003 - 2018 the average number of fire-related yearly casualties is 1. The highest number of casualties - 2 took place in 2003, and the lowest - 0 in 2004. The data has a dropping trend.
The average number of injuries per 1,000 fire incidents is 5. This indicator was the highest - 25 in 2003, and the lowest 0 in 2004. The trend for casualties per 1,000 fires is declining. Compared to the West Virginia value the number of injuries per 1,000 fire incidents is lower.Casualties per 1,000 incidents in Wheeling, WV compared to nearest cities:
(Note: Based on data for all years, including only cities with at least 500 fire incidents)
| Wheeling: | 4.5 |
| Bridgeport: | 9.5 |
| Martins Ferry: | 9.9 |
| Bellaire: | 0.0 |
| Moundsville: | 38.9 |
| Wellsburg: | 2.4 |
| Mingo Junction: | 40.9 |
| Follansbee: | 13.8 |
| Steubenville: | 16.9 |
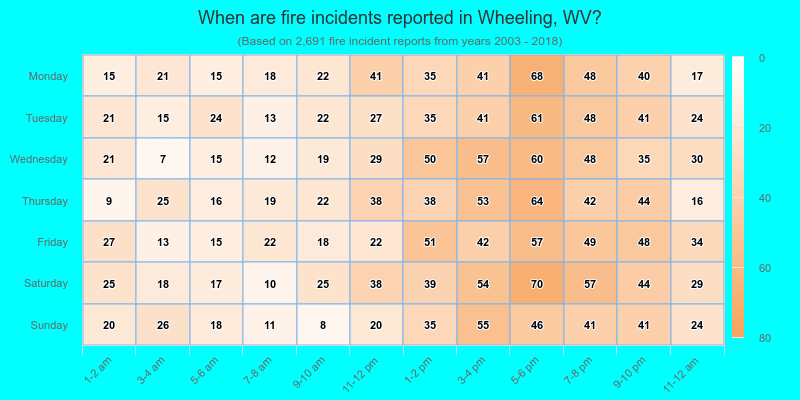
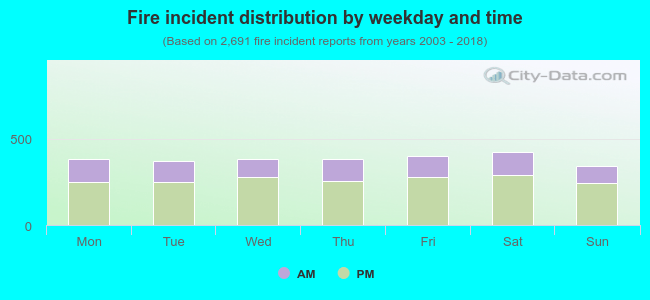 31.2% incidents where reported in the morning and 68.8% in the evening. The most fires (15.8%) took place on Saturday, and the least (12.8%) on Sunday.
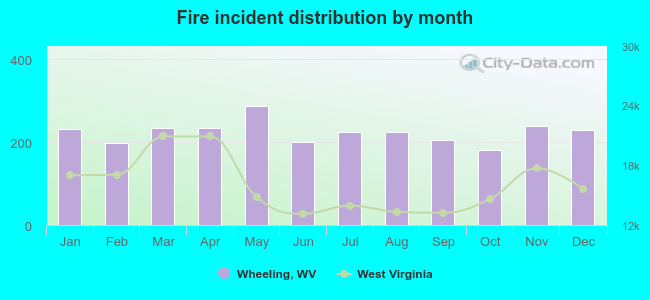 According to the 2,691 fires from years 2003 - 2018 most fires (10.7%) took place during May, and the least (6.8%) in October.
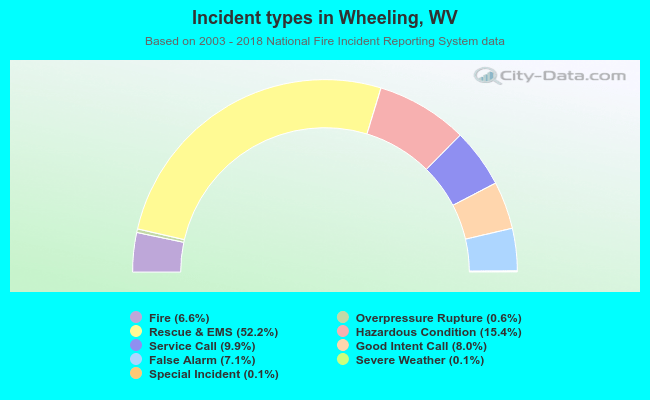 Out of all 40,728 cases reported during the years 2003 - 2018, the most belonged to the categories: Rescue & EMS (52.2%), Hazardous Condition (15.4%), and Service Call (9.9%).
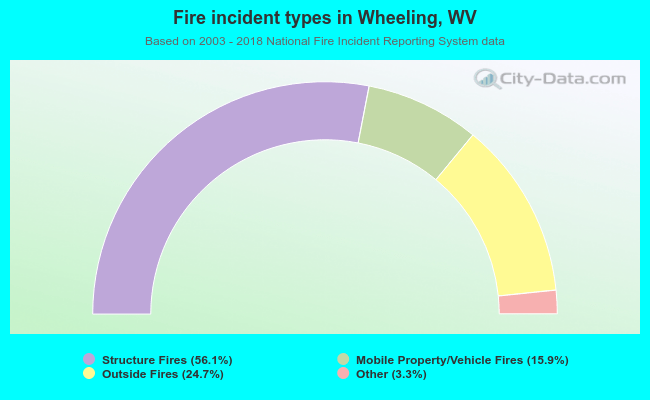 When looking into fire subcategories, the most incidents belonged to: Structure Fires (56.1%), and Outside Fires (24.7%).