Follansbee: Fire Incidents, West Virginia (WV)
Where are fire incidents reported in Follansbee, WV
Something went wrong! Please refresh the page.
|
| |||||||||||||||||||||||||||||||||||||||||||||||||||||||||||||||||||||||||||||||||||||||||||||||||||||||||||||
2003 - 2018 National Fire Incident Reporting System (NFIRS) incidents
- Incident types reported to NFIRS in Follansbee, WV
- 1,99054.7%Rescue & EMS
- 65117.9%Fire
- 42411.6%Hazardous Condition
- 2296.3%Good Intent Call
- 2085.7%Service Call
- 1263.5%False Alarm
- 110.3%Severe Weather
- Fire incident types reported to NFIRS in Follansbee, WV
- 41263.3%Structure Fires
- 11517.7%Outside Fires
- 7311.2%Mobile Property/Vehicle Fires
- 517.8%Other
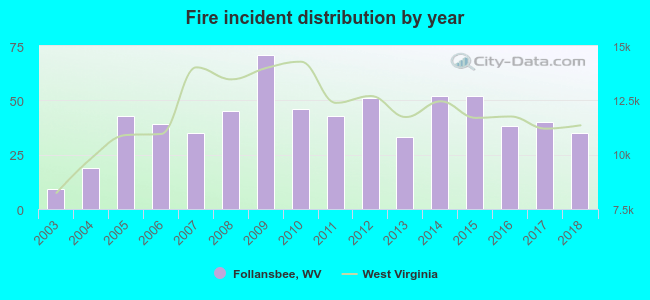 Based on the data from the years 2003 - 2018 the average number of fires per year is 41. The highest number of fires - 71 took place in 2009, and the least - 9 in 2003. The data has a rising trend.
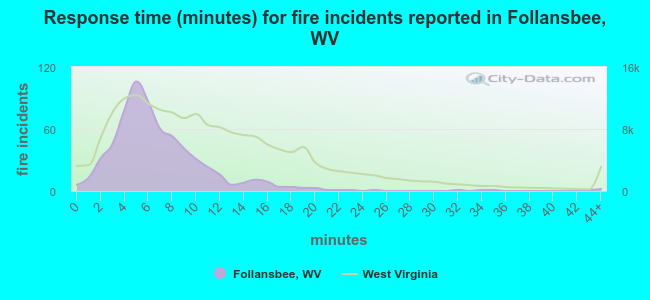 The median response time based on all reported fire incidents is 6 minutes. This is lower than the state median value.
The median response time in Follansbee, WV compared to nearest cities:
(Note: Based on data for all years, including only cities with at least 500 fire incidents)
| Follansbee: | 6 minutes |
| Mingo Junction: | 6 minutes |
| Steubenville: | 3 minutes |
| Wellsburg: | 8 minutes |
| Weirton: | 5 minutes |
| Toronto: | 8 minutes |
| New Cumberland: | 12 minutes |
| Martins Ferry: | 7 minutes |
| Wheeling: | 4 minutes |
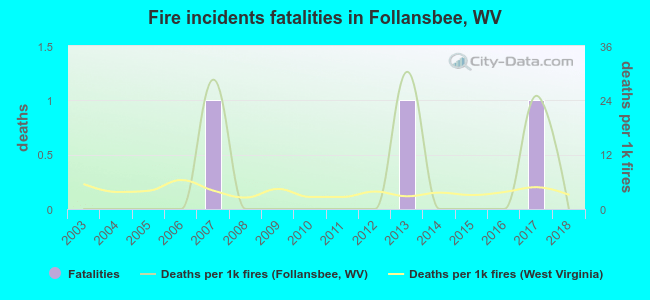 Based on the reports from the years 2003 - 2018 the average number of fire-related yearly deaths is 0. The highest number of reported deaths - 1 took place in 2007, and the lowest - 0 in 2003. The data has a constant trend.
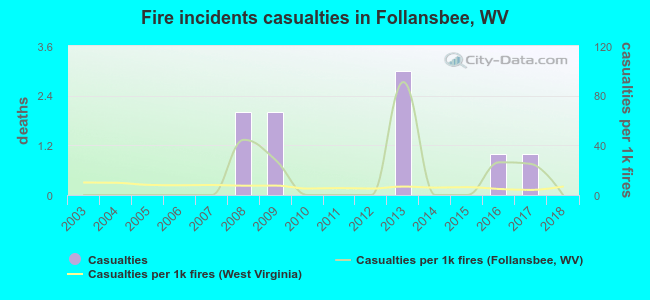 Based on the reports from the years 2003 - 2018 the average number of fire-related casualties per year is 1. The highest number of injuries - 3 took place in 2013, and the lowest - 0 in 2003. The data has a constant trend.
The average number of injuries per 1,000 fires is 13. This indicator was the highest - 91 in 2013, and the lowest 0 in 2003. The trend for injuries per 1,000 incidents is constant. Compared to the state value the number of casualties per 1,000 fires is much higher.
Based on the reports from the years 2003 - 2018 the average number of fire-related casualties per year is 1. The highest number of injuries - 3 took place in 2013, and the lowest - 0 in 2003. The data has a constant trend.
The average number of injuries per 1,000 fires is 13. This indicator was the highest - 91 in 2013, and the lowest 0 in 2003. The trend for injuries per 1,000 incidents is constant. Compared to the state value the number of casualties per 1,000 fires is much higher.Casualties per 1,000 incidents in Follansbee, WV compared to nearest cities:
(Note: Based on data for all years, including only cities with at least 500 fire incidents)
| Follansbee: | 13.8 |
| Mingo Junction: | 40.9 |
| Steubenville: | 16.9 |
| Wellsburg: | 2.4 |
| Weirton: | 47.7 |
| Toronto: | 11.2 |
| New Cumberland: | 10.1 |
| Martins Ferry: | 9.9 |
| Wheeling: | 4.5 |
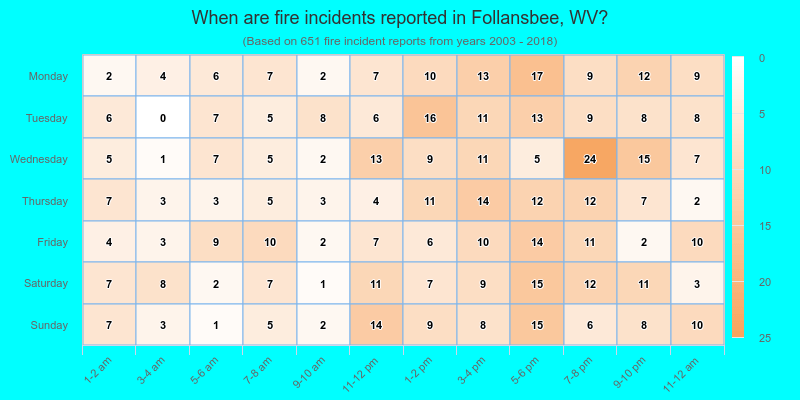
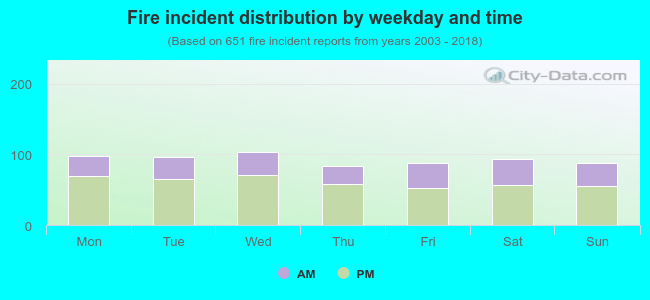 33.9% incidents where reported in the morning and 66.1% in the evening. The most fires (16.0%) took place on Wednesday, and the least (12.7%) on Thursday.
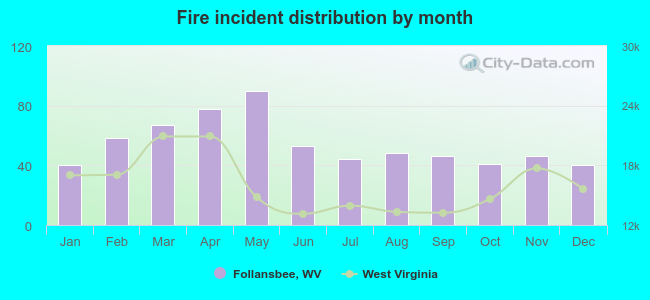 According to the 651 reports from years 2003 - 2018 most fires (13.8%) took place during May, and the least (6.1%) in January.
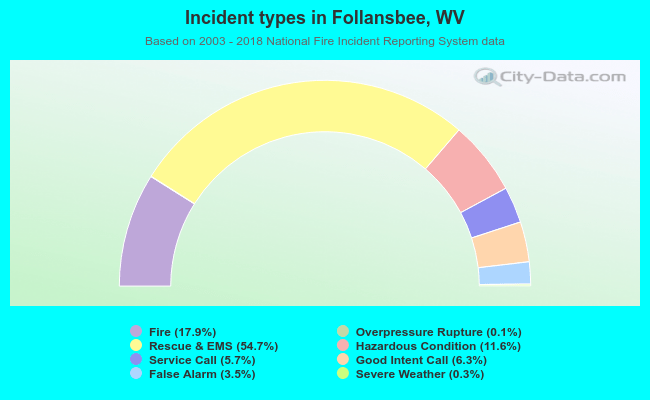 Out of all 3,641 cases reported during the years 2003 - 2018, the most belonged to the categories: Rescue & EMS (54.7%), Fire (17.9%), and Hazardous Condition (11.6%).
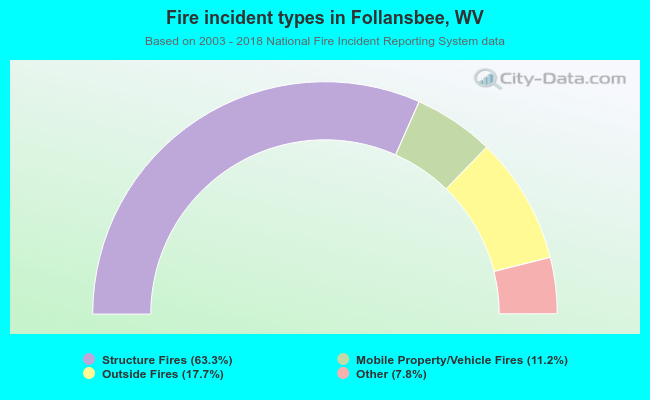 When looking into fire subcategories, the most reports belonged to: Structure Fires (63.3%), and Outside Fires (17.7%).