West Wareham: Fire Incidents, Massachusetts (MA)
Where are fire incidents reported in West Wareham, MA
Something went wrong! Please refresh the page.
|
| |||||||||||||||||||||||||||||||||||||||||||||||||||||||||||||||||||||||||||||||||||||||||||||||||||||||||||||
2002 - 2017 National Fire Incident Reporting System (NFIRS) incidents
- Incident types reported to NFIRS in West Wareham, MA
- 28931.8%Hazardous Condition
- 25227.7%Rescue & EMS
- 13514.8%Fire
- 9910.9%Service Call
- 818.9%False Alarm
- 495.4%Good Intent Call
- 40.4%Overpressure Rupture
- 10.1%Special Incident
- Fire incident types reported to NFIRS in West Wareham, MA
- 4835.6%Structure Fires
- 4533.3%Outside Fires
- 3525.9%Mobile Property/Vehicle Fires
- 75.2%Other
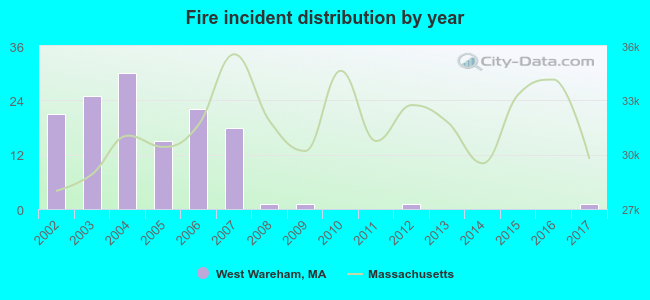 According to the data from the years 2002 - 2017 the average number of fire incidents per year is 8. The highest number of reported fire incidents - 30 took place in 2004, and the least - 0 in 2010. The data has a declining trend.
 Based on the reports from the years 2002 - 2017 the average number of fire-related casualties per year is 0. The highest number of injuries - 3 took place in 2005, and the lowest - 0 in 2002. The data has a constant trend.
 30.4% incidents where reported in the morning and 69.6% in the evening. The most fires (16.3%) took place on Wednesday, and the least (12.6%) on Tuesday.
 Based on the 135 fire incident reports from years 2002 - 2017 most fires (13.3%) took place during April, and the least (5.9%) in February.
 Out of all 910 cases reported during the years 2002 - 2017, the most belonged to the categories: Hazardous Condition (31.8%), Rescue & EMS (27.7%), and Fire (14.8%).
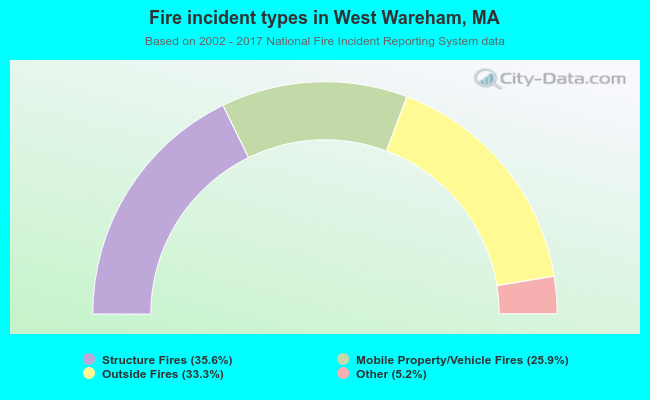 When looking into fire subcategories, the most incidents belonged to: Structure Fires (35.6%), and Outside Fires (33.3%).