West Union: Fire Incidents, South Carolina (SC)
Where are fire incidents reported in West Union, SC
Something went wrong! Please refresh the page.
|
| |||||||||||||||||||||||||||||||||||||||||||||||||||||||||||||||||||||||||||||||||||||||||||||||||||||||||||||
| Other | 48 | |||||||||||||||||||||||||||||||||||||||||||||||||||||||||||||||||||||||||||||||||||||||||||||||||||||||||||||
2002 - 2018 National Fire Incident Reporting System (NFIRS) incidents
- Incident types reported to NFIRS in West Union, SC
- 64627.9%Hazardous Condition
- 52622.7%Fire
- 43718.9%Good Intent Call
- 38416.6%Rescue & EMS
- 1436.2%Service Call
- 1365.9%False Alarm
- 341.5%Severe Weather
- 70.3%Special Incident
- Fire incident types reported to NFIRS in West Union, SC
- 23544.7%Outside Fires
- 20639.2%Structure Fires
- 5610.6%Mobile Property/Vehicle Fires
- 295.5%Other
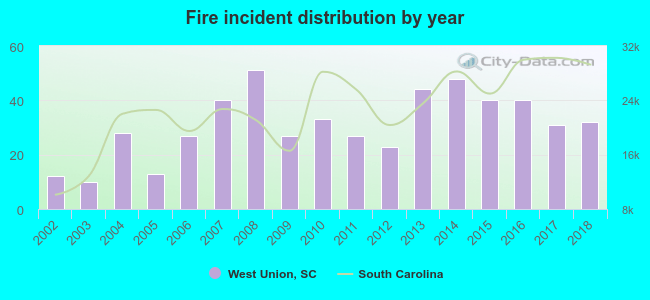 Based on the data from the years 2002 - 2018 the average number of fires per year is 31. The highest number of reported fires - 51 took place in 2008, and the least - 10 in 2003. The data has a growing trend.
 The median response time based on all reported fire incidents is 7 minutes. This is comparable to the state median value.
The median response time in West Union, SC compared to nearest cities:
(Note: Based on data for all years, including only cities with at least 500 fire incidents)
| West Union: | 7 minutes |
| Walhalla: | 6 minutes |
| Westminster: | 8 minutes |
| Seneca: | 8 minutes |
| Six Mile: | 7 minutes |
| Clemson: | 6 minutes |
| Central: | 6 minutes |
| Pendleton: | 8 minutes |
| Fair Play: | 8 minutes |
 27.9% incidents where reported in the morning and 72.1% in the evening. The most fires (18.8%) took place on Saturday, and the least (12.0%) on Wednesday.
 Based on the 526 fire incident reports from years 2002 - 2018 most fires (14.4%) took place during January, and the least (4.8%) in September.
 Out of all 2,315 cases reported during the years 2002 - 2018, the most belonged to the categories: Hazardous Condition (27.9%), Fire (22.7%), and Good Intent Call (18.9%).
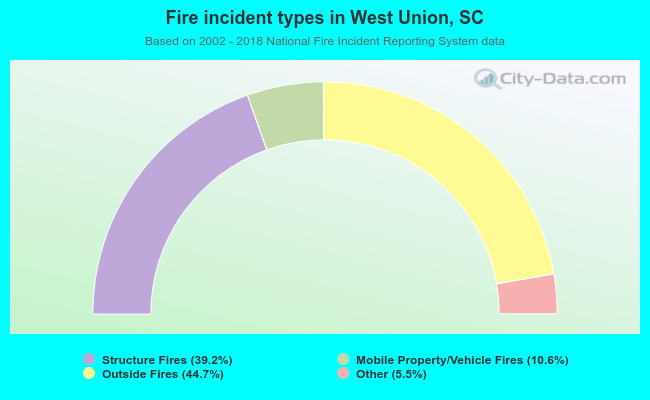 When looking into fire subcategories, the most incidents belonged to: Outside Fires (44.7%), and Structure Fires (39.2%).