Six Mile: Fire Incidents, South Carolina (SC)
Where are fire incidents reported in Six Mile, SC
Something went wrong! Please refresh the page.
|
| |||||||||||||||||||||||||||||||||||||||||||||||||||||||||||||||||||||||||||||||||||||||||||||||||||||||||||||
2005 - 2018 National Fire Incident Reporting System (NFIRS) incidents
- Incident types reported to NFIRS in Six Mile, SC
- 82736.0%Rescue & EMS
- 57024.8%Fire
- 27912.1%False Alarm
- 26911.7%Hazardous Condition
- 1787.7%Good Intent Call
- 1737.5%Service Call
- Fire incident types reported to NFIRS in Six Mile, SC
- 32256.5%Outside Fires
- 18231.9%Structure Fires
- 5910.4%Mobile Property/Vehicle Fires
- 71.2%Other
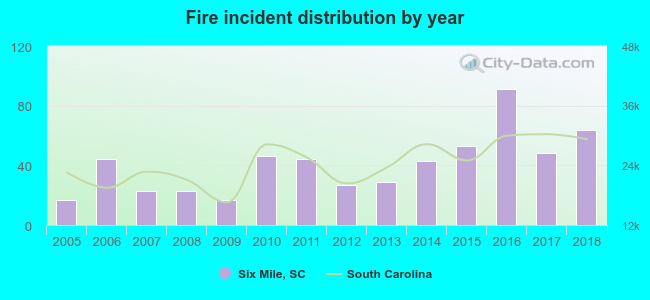 Based on the data from the years 2005 - 2018 the average number of fire incidents per year is 41. The highest number of fire incidents - 91 took place in 2016, and the least - 17 in 2005. The data has a growing trend.
 The median response time based on all reported fire incidents is 7 minutes. This is similar to the state median value.
The median response time in Six Mile, SC compared to nearest cities:
(Note: Based on data for all years, including only cities with at least 500 fire incidents)
| Six Mile: | 7 minutes |
| Central: | 6 minutes |
| Liberty: | 6 minutes |
| Clemson: | 6 minutes |
| Pickens: | 7 minutes |
| Pendleton: | 8 minutes |
| Seneca: | 8 minutes |
| Easley: | 6 minutes |
| West Union: | 7 minutes |
 24.6% incidents where reported in the morning and 75.4% in the evening. The most fires (17.7%) took place on Saturday, and the least (10.4%) on Tuesday.
 According to the 570 fire incident reports from years 2005 - 2018 most fires (13.2%) took place during March, and the least (5.8%) in May.
 Out of all 2,298 cases reported during the years 2005 - 2018, the most belonged to the categories: Rescue & EMS (36.0%), Fire (24.8%), and False Alarm (12.1%).
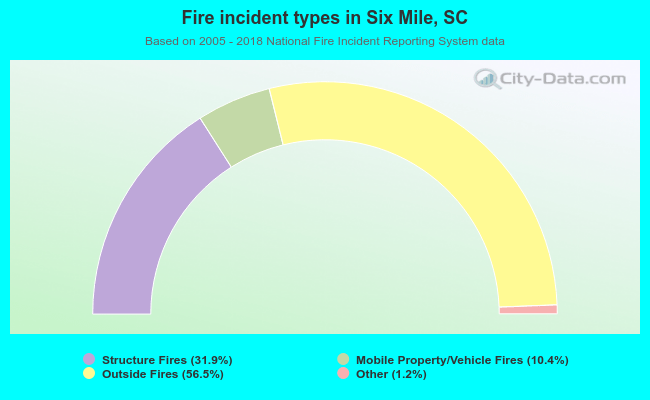 When looking into fire subcategories, the most reports belonged to: Outside Fires (56.5%), and Structure Fires (31.9%).