West Grove: Fire Incidents, Pennsylvania (PA)
Where are fire incidents reported in West Grove, PA
Something went wrong! Please refresh the page.
|
| |||||||||||||||||||||||||||||||||||||||||||||||||||||||||||||||||||||||||||||||||||||||||||||||||||||||||||||
2003 - 2018 National Fire Incident Reporting System (NFIRS) incidents
- Incident types reported to NFIRS in West Grove, PA
- 46634.4%Fire
- 24117.8%Hazardous Condition
- 22116.3%Good Intent Call
- 16512.2%Rescue & EMS
- 15611.5%Service Call
- 1027.5%False Alarm
- 20.1%Special Incident
- Fire incident types reported to NFIRS in West Grove, PA
- 33672.1%Structure Fires
- 6914.8%Outside Fires
- 429.0%Mobile Property/Vehicle Fires
- 194.1%Other
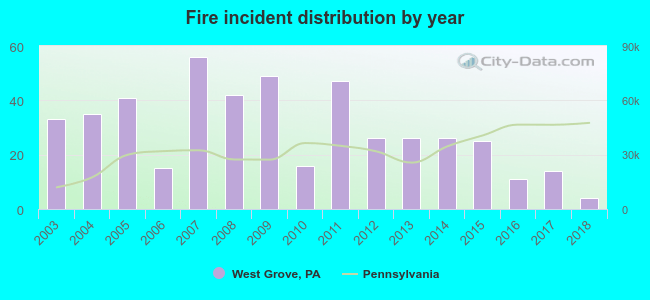 Based on the data from the years 2003 - 2018 the average number of fires per year is 29. The highest number of reported fire incidents - 56 took place in 2007, and the least - 4 in 2018. The data has a dropping trend.
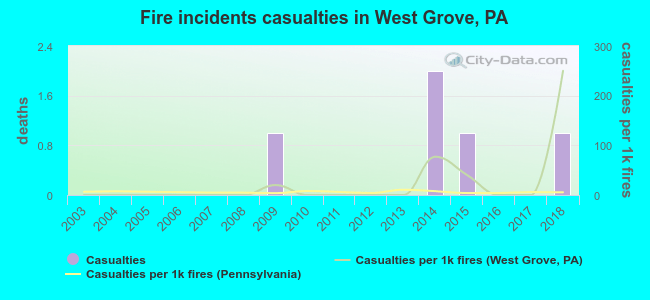 According to the reports from the years 2003 - 2018 the average number of fire-related yearly casualties is 0. The highest number of reported casualties - 2 took place in 2014, and the lowest - 0 in 2003. The data has an increasing trend.
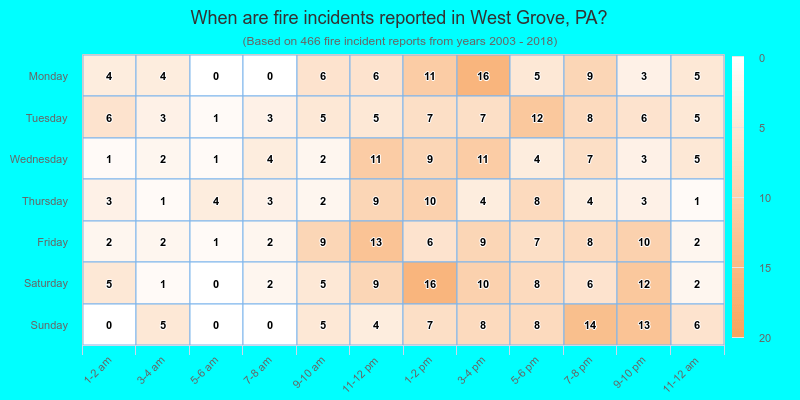
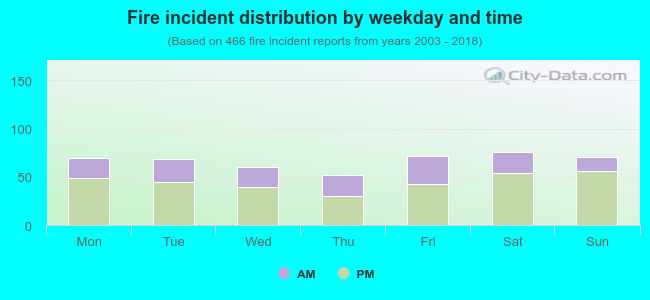 32.4% incidents where reported in the morning and 67.6% in the evening. The most fires (16.3%) took place on Saturday, and the least (11.2%) on Thursday.
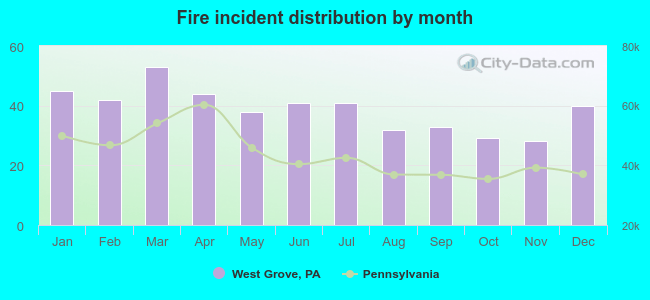 Based on the 466 fire incident reports from years 2003 - 2018 most fires (11.4%) took place during March, and the least (6.0%) in November.
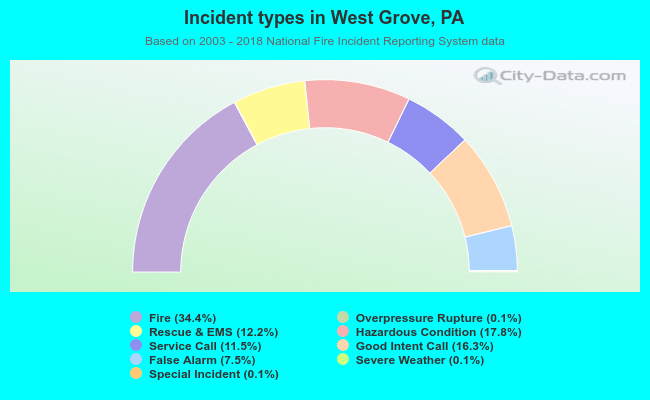 Out of all 1,355 cases reported during the years 2003 - 2018, the most belonged to the categories: Fire (34.4%), Hazardous Condition (17.8%), and Good Intent Call (16.3%).
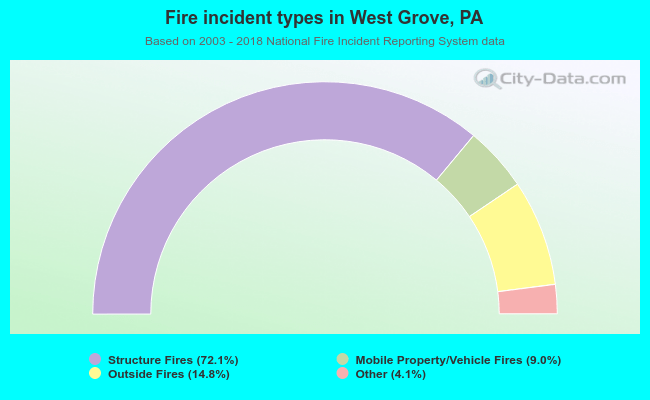 When looking into fire subcategories, the most incidents belonged to: Structure Fires (72.1%), and Outside Fires (14.8%).